Photometrically Triggered Keck Spectroscopy of Fermi BL Lac Objects
Abstract
We report on Keck spectra of ten Fermi blazars. J0622+3326, previously unobserved, is shown to be a flat-spectrum radio quasar at redshift . The others are known BL Lac-type objects that have resisted previous attempts to secure redshifts. Using a photometric monitoring campaign with the 0.76 m Katzman Automatic Imaging Telescope at Lick Observatory, we identified epochs when the relativistic jet emission was fainter than usual, thus triggering the Keck spectroscopy. This strategy gives improved sensitivity to stars and ionized gas in the host galaxy, thereby providing improved redshift constraints for seven of these sources.
Subject headings:
BL Lacertae objects: general — galaxies: active — gamma rays: galaxies — quasars: general — surveys1. Introduction
Blazars are the brightest extragalactic point sources in the gamma-ray (and microwave) bands; study of their population and evolution are key to high-energy astrophysics. Many blazars are so-called BL Lacertae objects, where the optical spectrum is dominated by continuum synchrotron radiation. These tend to be hard-spectrum -ray sources, and appear to provide a substantial fraction of the GeV extragalactic -ray background (The Fermi-LAT Collaboration, 2013). However, the extreme continuum domination in the optical makes it particularly difficult to obtain redshifts, compromising studies of the BL Lac population and its cosmic evolution (Shaw et al., 2013, hereafter S13).
Using two years of sky-survey data, The Fermi Second Source Catalog (2FGL; Nolan et al., 2012) reports on the 1873 most significant sources detected in the Large Area Telescope (LAT; Atwood et al., 2009). More than half of these objects are associated with active galactic nuclei (AGNs) — in particular, jet-dominated “blazars,” which are generally compact, flat-spectrum radio sources. Of the 1121 such associations (1017 at ) in the Second Catalog of AGNs detected by the Fermi LAT (2LAC; Ackermann et al., 2011), 410 were flagged as BL Lacs. In S13, additional spectroscopy increased the BL Lac number to 475. However, despite extensive observations with 10 m-class telescopes, secure spectroscopic redshifts were obtained for only 209 BL Lac objects (44%). Fortunately, with high-quality spectra one can derive constraints on the redshift of the other BL Lac objects, especially using standard assumptions about the host-galaxy luminosity. In S13, such constraints (or redshifts) were obtained for of the BL Lac objects, providing substantial improvement in our understanding of BL Lac evolution (Ajello et al. 2013).
The principal barrier to spectroscopic redshifts is the extreme dominance of the optical continuum. This continuum can, however, be highly variable; the constraints can improve and additional redshifts may be obtained when the source is in a “low” state. In fact, Shaw et al. (2012) describe five LAT blazars which qualify as BL Lac objects when in a high state, but show broad-line emission with equivalent width (EW) Å in low states, such that they would be defined as flat-spectrum radio quasars (FSRQs) at these epochs. We have therefore used photometry from an ongoing blazar optical monitoring campaign to trigger low-state spectroscopy of blazars lacking secure redshifts. Here we report on the results of those observations.
In §2 we describe the monitoring campaign and the target selection for spectroscopy. Section 3 presents the spectroscopic observations and reductions. We discuss redshifts and redshift constraints in §4. Our conclusions are summarized in §5, and we note how similar campaigns may provide the best prospect for additional BL Lac redshifts. In this paper, we assume an approximate concordance cosmology: , , and H km s-1 Mpc-1.
2. KAIT Photometry
To have the best chance of detecting significant short-timescale variability, we selected LAT blazars that are relatively bright in both the -ray and optical bands. In the -ray bands, we selected sources having a likelihood test statistic, TS (; for details see Nolan et al. 2012, and references therein) in the first year of LAT observations. In the optical, the selected sources had quiescent magnitude . After restricting to high Galactic latitude () and , and dropping a few famous sources that are well monitored by other programs, we finalized a sample of 156 LAT AGNs.
The photometric monitoring was obtained with the Katzman Automatic Imaging Telescope (KAIT; Filippenko et al., 2001), a 0.76 m robotic telescope at Lick Observatory on Mt. Hamilton whose primary mission is to discover and monitor young, nearby supernovae (e.g., Ganeshalingam et al., 2010; Leaman et al., 2011; Li et al., 2011). The blazars were added to the queue, with 30–60 s white-light (unfiltered, but roughly in overall response; Li et al. 2003) exposures to be taken on a 3-day cadence, subject to weather and angular separation from the Sun. An automated photometry pipeline extracts simple aperture magnitudes each night, calibrated against the USNO B1.0 -band magnitudes of a manually selected set of stars in each target field. Fluxes and updated light curves for newly observed targets are distributed for inspection the following day.
The blazars do indeed show a wide range of variability on a variety of time scales. A principal goal of the program is to measure optical/-ray correlations; we will report on this analysis elsewhere. The monitored set does include many BL Lac objects lacking spectroscopic redshifts (50 at the start of the campaign), and we can improve the understanding of these sources with sensitive spectroscopy at low states. As part of an ongoing program to study supernovae and other transients, we have access to the Keck 10 m telescopes on an approximately monthly basis. Thus, KAIT-monitored BL Lac objects lacking redshifts and that happened to be in an especially low state during a Keck run were selected as spectroscopic targets.
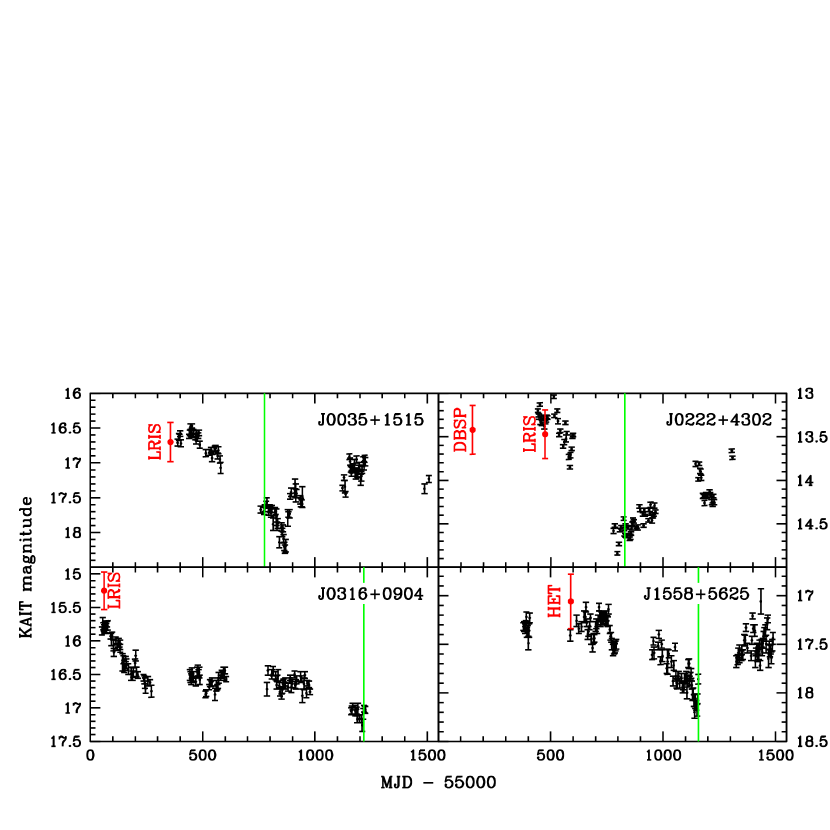
Figure 1 shows the light curves of four of these targets. For each target we had previous observations with 5–10 m-class telescopes, establishing the sources as BL Lac objects with a very low EW limit on any emission or absorption lines. The triggered KAIT epoch is indicated by a green line and the approximate magnitude during previous spectroscopy, scaled relative to the flux at the KAIT-selected epoch, is shown in red. At the triggered epochs, the objects are generally mag fainter than normal.
3. Keck LRIS Spectroscopy
Spectra were obtained with the Low Resolution Imaging Spectrometer (LRIS; Oke et al., 1995) on the Keck-I telescope. Observations were taken through a slit of width and the 5600 Å dichroic filter was used. On the blue side, we employed the 600/4000 grism, for an effective resolution of Å, a dispersion of Å per pixel, and coverage from the atmospheric limit (3100 Å) to Å). On the red side, the 400/8500 grating was used, for an effective resolution of 7 Å, a dispersion of Å per pixel, and coverage from 5500 Å to 10,200 Å.
LRIS has an atmospheric dispersion corrector, and we also generally oriented the slit along the parallactic angle (Filippenko, 1982) to minimize differential losses. At least two exposures were taken of every target to allow simple removal of cosmic rays. The MJD of the exposure and the net integration times are listed in Table 1. These are bright targets for Keck/LRIS; thus, spectra were usually taken during twilight or in nonphotometric conditions. Typically we are not background limited and the resulting spectra have a high signal-to-noise ratio (S/N) per resolution element, 50 to .
In addition to nine known BL Lac objects selected by continuum drops, we observed J0622+3326, associated with 2FGL J0622.9+3326 at % probability. This is a source in Nolan et al. (2012), and one of the brightest Fermi objects having previously unknown optical type.
Spectroscopic data reduction proceeded using the IRAF package (Tody, 1986; Valdes, 1986) with standard techniques. Data were bias-subtracted and flat-fielded (with dome flats). Wavelength calibration employed afternoon spectra of lamps and was confirmed by night-sky emission lines. We used an optimal extraction algorithm (Valdes, 1992), maximizing the final S/N. Spectra, especially those taken with the red-side camera (which utilizes a thick CCD chip), were visually cleaned of residual cosmic-ray contamination affecting only individual exposures.
Spectrophotometric calibrations were made using standard stars from Oke (1990) and Bohlin (2007). These were generally observed on the same night as the BL Lac targets, but in a few cases they were unavailable and standard stars from other nights were substituted. Since BL Lac spectra are generally simple power laws, we used our objects to monitor residual errors in the sensitivity function. Nevertheless, in these very high-S/N data, some residual calibration errors (at the –3% level) remain.
Spectra were corrected for atmospheric extinction using typical values for Mauna Kea (Krisciunas et al., 1987). We used IRAF’s dereddening function with the recently updated Galactic extinction maps (Schlafly & Finkbeiner, 2011) to remove any Galactic reddening. We made no attempt to remove intrinsic (host-galaxy) reddening.
Telluric templates were generated from the standard-star observations on each night. We determined templates for the oxygen and water-line complexes and corrected individually for the telluric absorptions of these two species. We find significant residuals only in high-S/N spectra taken under varying, nonphotometric atmospheric conditions.
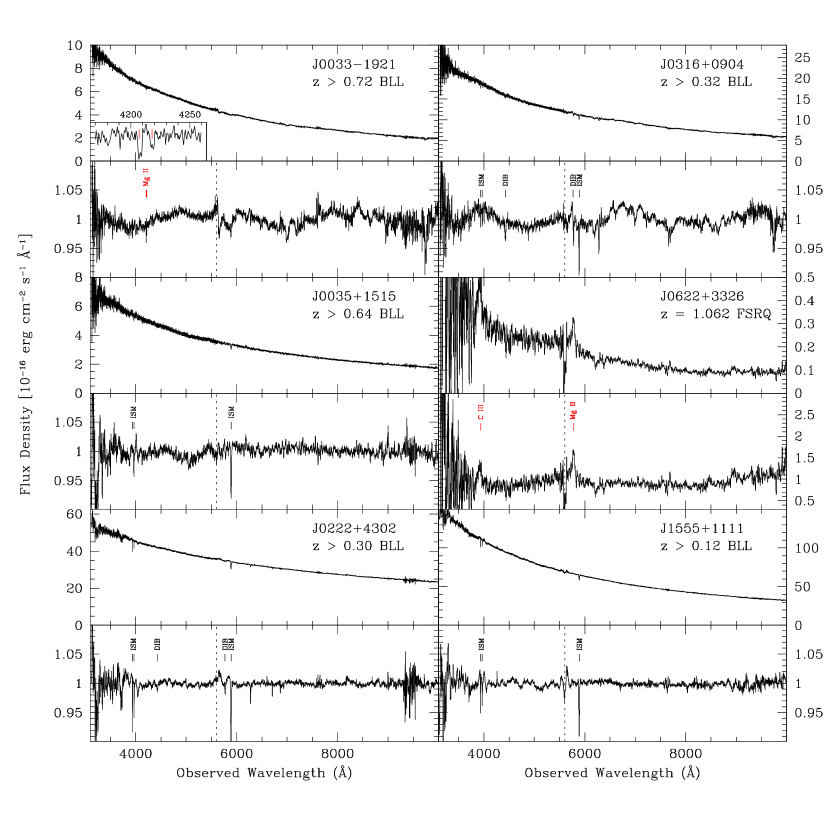
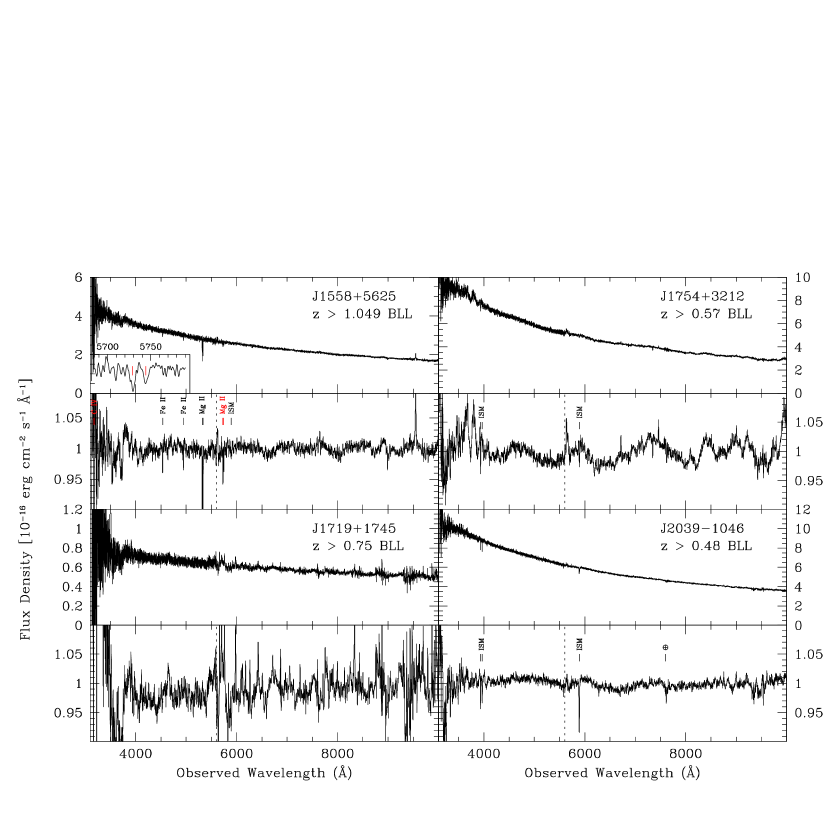
After these calibrations, we co-added individual exposures separately on the red and blue sides, weighted by S/N. Finally, we stitched the red-side and blue-side spectra together, and these are presented in Figure 2.
We estimate systematic errors in absolute spectrophotometry of % (Healey et al., 2008), primarily due to variable slit losses and changing atmospheric conditions; relative spectrophotometry is likely considerably better.
A few systematic artifacts are still visible in the stitched spectra (Fig. 2). Occasionally, there is a systematic step at the dichroic cutoff. Due to the strongly varying sensitivity through the cutoff wavelength, our calibrations are sensitive to very subtle perturbations (i.e., from varying temperature); thus, the flux variations near the dichroic are probably not real. In J0316+0904 and J1719+1745, residual telluric features near 7600 Å are present in the reduced spectra. Due to the varying atmospheric conditions, the standard stars did not perfectly model the telluric absorption in the object spectra, and division left a detectable residual. We visually compared any residuals to previous spectra of these objects; none were found to be consistent, suggesting that they are not weak, intrinsic features. These residual effects are at the few percent level; the BL Lac spectra are impressive power laws, and our data allow us to search for subtle departures associated with any underlying broad-line region and AGN host.
4. Redshift Measurements and Constraints
Since previous spectroscopic observations of these obdurate sources did not provide redshifts (S13), even spectra in a low state require careful analysis. Such work is motivated by the need to have high redshift completeness in the LAT sample when probing source evolution (Ajello et al., 2012).
In this program we observed one -bright LAT blazar without previous spectroscopic study. J0622+3326 proved to be an FSRQ, and a single 640 s observation in twilight sufficed to identify highly significant (), broad C III] (rest 1909 Å) and Mg II (rest 2795.5, 2802.7 Å) emission at , measured by cross-correlation analysis with the “rvsao” tool (Kurtz & Mink, 1998). All other sources were known BL Lac objects and, even in a low state, we did not find significant broad emission-line features. More subtle constraints on redshift must be extracted.
Intervening metal-line absorption systems provide secure lower limits on the blazar redshift. We search for Mg II 2795.5, 2802.7 and C IV 1548.2, 1550.77 absorption lines in all spectra. Visual inspection revealed two sources with absorption doublets, as reported in Table 1. We fit the absorption with a two-Gaussian template having wavelength spacing that scales with , and free amplitudes. For the doublet to be significant we require the stronger (weaker) component to be (), and the doublet ratio to be in the acceptable range (between 1:1 and 2:1, with the blue line dominant), following Nestor et al. (2005).
J0033–1921 shows significant Mg II absorption at . This feature was too weak to detect in previous (5 m-class) observations. It is, however, less constraining than the model-dependent host lower limits discussed below. In J1558+5625, we confirm the previously known system at , and we find a weaker, but still significant Mg II absorption doublet at . This model-independent constraint is consistent with and stronger than the host limits, and pushes this BL Lac out to an interesting redshift.
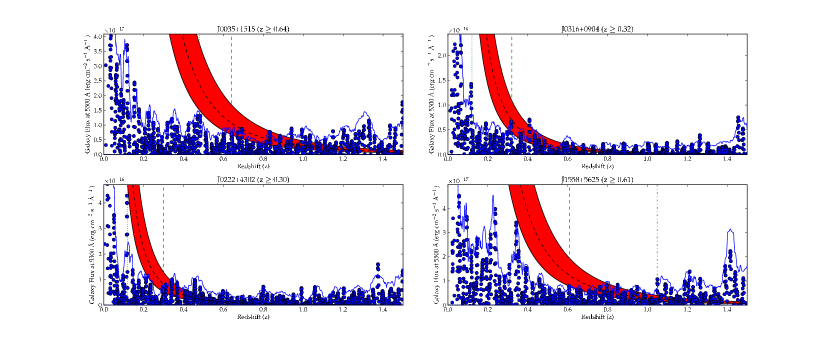
We next follow the technique developed by S13 to derive redshift lower limits based on nondetection of galaxy hosts. In brief, we fit the observed BL Lac spectra with two components: a power law for the core emission, and an elliptical host-galaxy template for the galaxy emission. All spectra are bandpass filtered before fitting to minimize sensitivity to the residual systematic noise. The fit thus returns power-law parameters, host flux, and error estimates at each trial redshift. The power-law errors in Table 1 include systematics from flux calibration and a spectral-index systematic estimated by separately fitting the red and blue halves of the spectra.
BL Lac hosts have been described as standard candles with mag (Urry et al., 2000; Sbarufatti et al., 2005b). In our study of the Fermi BL Lac objects (S13) we recalibrated this magnitude, finding less luminous ( mag) hosts for the LAT-detected BL Lacs. When the fitted host at a trial is fainter than the standard-candle luminosity, we exclude that redshift, as shown in Figure 3. To be conservative, we adopt here the mag calibration, assuming mag gives slightly larger lower bounds. (For further details see S13.) These BL Lac redshift lower limits are reported in Table 1; they are typically more stringent than those quoted by S13, with the improvement given as .
We can also provide statistical upper limits on redshift from the lack of Ly absorption features. Given a known density of Ly-forest absorbers, we define a redshift range over which we are likely (probability ; ) to find an absorption feature,
| (1) |
where is the measured EW limit (S13). We find , where 1.55 is the redshift where Ly reaches the blue end of our spectra. The “proximity effect” is negligible at these redshifts; for a derivation, see S13. Upper limits are reported for each BL Lac object in Table 1; they generally vary from 1.6 to 1.8 based on the S/N of the spectrum.
5. Discussion and Conclusions
Most BL Lac samples have redshifts for % of the sources, even after extensive 10 m-class observations. In S13 we showed, using other redshift constraints (intervening absorbers and host flux limits), that the unsolved BL Lac objects were generally at higher redshift than those having spectroscopic redshifts. Thus, redshift incompleteness introduces serious biases into studies of BL Lac evolution. Although use of the redshift constraints can partially obviate this problem (Ajello et al. 2013), it is important to identify as many redshifts as possible and/or improve constraints to extract the tightest limits on the source .
Several of our BL Lacs are well-known objects, with previous redshift estimates presented in the literature. These estimates have propagated to the NASA Extragalactic Database (NED). Our data do not confirm the emission or absorption lines reported for J0033–1921 (; Piranomonte et al., 2007), J1558+5625 (; Falco et al., 1998), and J1719+1745 (; Sowards-Emmerd et al., 2005), despite the increased wavelength coverage and larger S/N in the present study, so we believe that those values are erroneous.
We have shown how triggered low-state spectroscopy can provide improved redshift constraints on BL Lac sources. Although none of the BL Lac objects here showed significant broad-line emission or host-galaxy features (and are thus highly continuum dominated even at these low states), for seven of nine sources the analysis resulted in a smaller allowed redshift range. For J1555+1111, the archival (pre-KAIT) observation was actually at a quite low state, so the new observation during a minimum of the KAIT light curve, was, in fact, at a brighter state, and thus less constraining. For J1754+3212, the short exposure under poor conditions did not match the quality of the previous spectra, so that, despite the fainter continuum state, we obtained similar redshift constraints. We also provide a spectroscopic redshift for J0622+3326, a newly identified LAT FSRQ, and power-law parameters for the BL Lac optical continua, which can be useful to those modeling the sources’ spectral energy distributions.
While triggered 10 m spectroscopy helps, other observations may also be useful in restricting the allowed redshift range. For example, for J0222+4302 (3C 66A), Furniss et al. (2013) have used HST ultraviolet (UV) spectroscopy to study the Ly absorbers. These show that and (99% confidence). Such UV spectroscopy is particularly powerful at lowering the upper limits. UV photometry can also reveal continuum drops associated with the onset of Ly absorption. Rau et al. (2012) report an estimate of for J0035+1515 and an upper limit of for J1555+1111. Both are consistent with our spectroscopic limits.
An additional constraint is available when high-quality imaging can resolve the BL Lac host from the point-source core, providing an estimate of the flux, and thus, through the standard-candle approximation, of the redshift (e.g., Sbarufatti et al., 2005a; Meisner & Romani, 2010). Although none of the present sources have imaging estimates, these can provide useful constraints to and so might be pursued in the future. Finally, a combination of imaging and spectroscopy, with an optimal aperture extracted from integral field unit (IFU) spectroscopic observations, can help isolate the host for improved measurements or limits on its spectrum. Of course, both of these techniques benefit from decreased core luminosity, so observations triggered by low states in the light curve will give optimal results.
Clearly, the measurement of redshifts for BL Lac objects with extreme continuum dominance, such as those studied here, will remain challenging for the foreseeable future. However, the motivation to obtain complete spectroscopic identification of high-energy selected samples is becoming increasingly strong, as these can provide improved understanding of BL Lac evolution and the cosmic -ray and optical backgrounds. As shown here, coordination with photometric monitoring campaigns, to obtain the spectra and/or host imaging in the lowest state possible, is important as it makes optimal use of expensive 10 m-class telescope time.
References
- Ackermann et al. (2011) Ackermann, M., et al. 2011, ApJ, 743, 171
- Ajello et al. (2012) Ajello, M., et al. 2012, ApJ, 751, 108
- Atwood et al. (2009) Atwood, W. B., et al. 2009, ApJ, 697, 1071
- Bohlin (2007) Bohlin, R. C. 2007, in Astronomical Society of the Pacific Conference Series, Vol. 364, The Future of Photometric, Spectrophotometric and Polarimetric Standardization, ed. C. Sterken, 315
- Falco et al. (1998) Falco, E. E., Kochanek, C. S., & Munoz, J. A. 1998, ApJ, 494, 47
- Filippenko (1982) Filippenko, A. V. 1982, PASP, 94, 715
- Filippenko et al. (2001) Filippenko, A. V., Li, W. D., Treffers, R. R., & Modjaz, M. 2001, in Astronomical Society of the Pacific Conference Series, Vol. 246, IAU Colloq. 183: Small-Telescope Astronomy on Global Scales, ed. B. Paczynski, W.-P. Chen, & C. Lemme, 121
- Furniss et al. (2013) Furniss, A., Fumagalli, M., Danforth, C., Williams, D. A., & Prochaska, J. X. 2013, ApJ, 766, 35
- Ganeshalingam et al. (2010) Ganeshalingam, M., et al. 2010, ApJS, 190, 418
- Healey et al. (2008) Healey, S. E., et al. 2008, ApJS, 175, 97
- Krisciunas et al. (1987) Krisciunas, K., et al. 1987, PASP, 99, 887
- Kurtz & Mink (1998) Kurtz, M. J., & Mink, D. J. 1998, PASP, 110, 934
- Leaman et al. (2011) Leaman, J., Li, W., Chornock, R., & Filippenko, A. V. 2011, MNRAS, 412, 1419
- Li et al. (2003) Li, W., Filippenko, A. V., Chornock, R., & Jha, S. 2003, PASP, 115, 844
- Li et al. (2011) Li, W., et al. 2011, MNRAS, 412, 1441
- Meisner & Romani (2010) Meisner, A. M., & Romani, R. W. 2010, ApJ, 712, 14
- Nestor et al. (2005) Nestor, D. B., Turnshek, D. A., & Rao, S. M. 2005, ApJ, 628, 637
- Nolan et al. (2012) Nolan, P. L., et al. 2012, ApJS, 199, 31
- Oke (1990) Oke, J. B. 1990, AJ, 99, 1621
- Oke et al. (1995) Oke, J. B., et al. 1995, PASP, 107, 375
- Piranomonte et al. (2007) Piranomonte, S., Perri, M., Giommi, P., Landt, H., & Padovani, P. 2007, A&A, 470, 787
- Rau et al. (2012) Rau, A., et al. 2012, A&A, 538, A26
- Sbarufatti et al. (2005a) Sbarufatti, B., Treves, A., & Falomo, R. 2005a, ApJ, 635, 173
- Sbarufatti et al. (2005b) Sbarufatti, B., Treves, A., Falomo, R., Heidt, J., Kotilainen, J., & Scarpa, R. 2005b, AJ, 129, 559
- Schlafly & Finkbeiner (2011) Schlafly, E. F., & Finkbeiner, D. P. 2011, ApJ, 737, 103
- Shaw et al. (2012) Shaw, M. S., et al. 2012, ApJ, 748, 49
- Shaw et al. (2013) —. 2013, ApJ, 764, 135
- Sowards-Emmerd et al. (2005) Sowards-Emmerd, D., Romani, R. W., Michelson, P. F., Healey, S. E., & Nolan, P. L. 2005, ApJ, 626, 95
- The Fermi-LAT Collaboration (2013) The Fermi-LAT Collaboration. 2013, ArXiv e-prints
- Tody (1986) Tody, D. 1986, in Society of Photo-Optical Instrumentation Engineers (SPIE) Conference Series, Vol. 627, SPIE, ed. D. L. Crawford, 733
- Urry et al. (2000) Urry, C. M., Scarpa, R., O’Dowd, M., Falomo, R., Pesce, J. E., & Treves, A. 2000, ApJ, 532, 816
- Valdes (1986) Valdes, F. 1986, in Society of Photo-Optical Instrumentation Engineers (SPIE) Conference, Vol. 627, SPIE, ed. D. L. Crawford, 749
- Valdes (1992) Valdes, F. 1992, in Astronomical Society of the Pacific Conference Series, Vol. 25, Astronomical Data Analysis Software and Systems I, ed. D. M. Worrall, C. Biemesderfer, & J. Barnes, 417
| 2FGL | RA () | Dec. () | Common Name | Name | Type | MJD | Exp. | S/N | ||||||
|---|---|---|---|---|---|---|---|---|---|---|---|---|---|---|
| (J2000) | (J2000) | ( mag) | (s) | |||||||||||
| J0033.51921 | 00 33 34.2 | 19 21 33 | RBS 0076 | J00331921 | 1.670.11 | 0.5970.010 | 0.505 | 0.72 | 0.42 | 1.60 | HBL | 56217 | 1950 | 290 |
| J0035.2+1515 | 00 35 14.7 | 15 15 04 | RBS 0082 | J0035+1515 | 1.590.11 | 0.7870.015 | … | 0.64 | 0.16 | 1.63 | HBL | 55775 | 910 | 150 |
| J0222.6+4302 | 02 22 39.6 | 43 02 08 | 3C66A | J0222+4302 | 2.610.11 | 1.2790.001 | … | 0.30 | 0.18 | 1.59 | IBL | 55830 | 900 | 550 |
| J0316.1+0904 | 03 16 12.7 | 09 04 43 | RGB J0316+090 | J0316+0904 | 2.120.11 | 0.7580.011 | … | 0.32 | 0.20 | 1.61 | HBL | 56217 | 1200 | 230 |
| J0622.9+3326 | 06 22 52.2 | 33 26 10 | B2 0619+33 | J0622+3326 | 0.340.12 | 0.3300.950 | 1.062 | … | … | … | FSRQ | 55978 | 640 | 6.8 |
| J1555.7+1111 | 15 55 43.0 | 11 11 24 | PG 1553+113 | J1555+1111 | 2.880.11 | 0.6720.003 | … | 0.12 | 0.13 | 1.59 | HBL | 55775 | 450 | 450 |
| J1559.0+5627 | 15 58 48.3 | 56 25 14 | 6C B155742.3+563358 | J1558+5625 | 1.490.11 | 1.1740.001 | 1.049 | 0.61 | 0.26 | 1.67 | IBL | 56158 | 660 | 140 |
| J1719.3+1744 | 17 19 13.0 | 17 45 06 | HB89 1717+178 | J1719+1745 | 0.870.12 | 1.5800.160 | … | 0.75 | 0.35 | 1.80 | LBL | 56124 | 3160 | 68 |
| J1754.3+3212 | 17 54 11.8 | 32 12 23 | RGB J1754+322 | J1754+3212 | 1.760.11 | 0.9220.030 | … | 0.57 | 0.01 | 1.61 | HBL | 56046 | 600 | 170 |
| J2039.11046 | 20 39 00.7 | 10 46 42 | CRATES J2039-1046 | J20391046 | 1.850.11 | 1.0320.011 | … | 0.48 | 0.14 | 1.62 | LBL | 55775 | 1000 | 240 |