Copious Amounts of Hot and Cold Dust Orbiting the Main Sequence A-type Stars HD 131488 and HD 121191
Abstract
We report two new dramatically dusty main sequence stars: HD 131488 (A1 V) and HD 121191 (A8 V). HD 131488 is found to have substantial amounts of dust in its terrestrial planet zone (LIR/Lbol410-3), cooler dust further out in its planetary system, and an unusual mid-infrared spectral feature. HD 121191 shows terrestrial planet zone dust (LIR/Lbol2.310-3), hints of cooler dust, and shares the unusual mid-infrared spectral shape identified in HD 131488. These two stars belong to sub-groups of the Scorpius-Centaurus OB association and have ages of 10 Myr. HD 131488 and HD 121191 are the dustiest main sequence A-type stars currently known. Early-type stars that host substantial inner planetary system dust are thus far found only within the age range of 5-20 Myr.
1 Introduction
With Infrared Astronomical Satellite (IRAS; Neugebauer et al. 1984), (Murakami et al. 2007), (; Werner et al. 2004), (WISE; Wright et al. 2010), and ground-based data our team has discovered and characterized some of the dustiest main sequence star systems currently known (e.g., BD+20 307, Song et al. 2005; EF Cha, Rhee et al. 2007a; HD 23514, Rhee et al. 2008; HD 15407, Melis et al. 2010; V488 Per, Zuckerman et al. 2012; TYC 8241 2652 1, Melis et al. 2012; HD 166191, Schneider et al. 2013). These discoveries are part of our ongoing effort to build observational evidence in support of the collisional formation model for rocky planets like Earth around stars of various masses (e.g., Melis et al. 2010, Melis et al. 2013 in preparation). From these systems we are able to determine that, for terrestrial-like planets, the epoch of final mass accumulation through giant impacts occurs at ages between 30 and 100 Myr for stars of roughly Solar mass (Melis et al., 2010) and ages of 5-20 Myr for stars a few times the mass of the Sun (see Section 4).
This paper reports two new dusty A-type stars discovered in our ongoing search of mid-infrared databases. These two systems are the dustiest A-type stars discovered to date. Section 2 discusses observational follow-up of these systems, Section 3 reports results and analysis on all available data, and discussion is provided in Section 4.
2 Observations
HD 131488 was identified as a potentially dusty star in a cross-correlation of the Tycho-2 (Høg et al., 2000) catalog of stellar sources and the Faint Source Catalog (Moshir et al. 1992; more details about this cross-correlation can be found in Melis 2009). HD 121191 was identified in a cross-correlation of Tycho-2 with the InfraRed Camera catalog (Onaka et al. 2007; Ishihara et al. 2010). Ground-based observations for these candidate dusty stars were conducted to verify the suggestion of excess emission and to characterize the stellar hosts.
2.1 Imaging
2.1.1 Mid-infrared
Ground-based follow-up imaging in the mid-infrared was pursued at Gemini-South with T-ReCS (Telesco et al., 1998). T-ReCS hosts a 320240 pixel array whose 0.09′′ pixel-1 plate scale affords a field of view of 28.8′′21.6′′. Observations were performed with the default chop-nod parameters: 15′′ chop throws along a position angle of 0∘ and an ABBA nod pattern. Data reduction followed standard high thermal background techniques. Chop pairs are differenced to remove the rapidly fluctuating background signal. Stacked chop pairs of different nods are then combined to yield the final reduced image. Observations were performed with the N-band filter (broad 10 m for T-ReCS; see Table 1) and aimed to verify IRAS and/or AKARI 10 m-detected flux levels and to rule out contamination by nearby sources. Flux calibration standards were selected from lists of well-characterized, mid-infrared bright stars (e.g., Cohen et al. 1999). Mid-infrared observations are summarized in Table 1 and retrieved flux densities shown in Table 2 and Figure 1. Although the epoch 2009 images of HD 131488 were performed in non-photometric conditions, a point-spread function calibration star was observed to enable a search for extended emission toward HD 131488 in either band-pass.
2.1.2 Adaptive Optics
L′-band (3.7760.7 m) adaptive optics imaging of HD 131488 was performed on UT 17 July 2009 to further search for small-separation contaminating sources. Observations were carried out with the Mauna Kea Observatory Keck Adaptive Optics system (Wizinowich et al., 2000). The Keck Adaptive Optics system was fed into NIRC2, a camera with a 1024 1024 InSb Aladdin-3 array. Observations were performed in the “Narrow” camera mode with a plate scale of 0.01′′ pixel-1. HD 131488 served as the guide star for the adaptive optics systems and provided reasonable atmospheric correction (Strehl ratio 0.4). Data obtained for HD 131488 did not make use of a dither sequence; when reducing the data background subtraction is done with a subsequent image of a field close in the plane of the sky to HD 131488. Individual images are then flat-fielded, rotated such that North points up in each image, and stacked to yield the final reduced image.
2.2 Spectroscopy
Spectroscopic observations were performed in the optical as well as in the infrared to characterize host stars and their infrared excess.
2.2.1 Optical
Optical echelle and grating spectroscopy was carried out at Siding Spring Observatory (SSO) with the 2.3-m telescope and at Mauna Kea Observatory with the Keck I 10-m telescope. High-spectral resolution data were obtained with HIRES (Vogt et al., 1994) at Keck and the SSO 2.3-m echelle (SSO-E). Moderate-resolution grating spectroscopy were obtained with the Double-Beam Spectrograph (DBS; Rodgers et al. 1988) and WiFeS (Dopita et al., 2007) at SSO. Observation parameters including wavelength range covered, instrumental resolution, and resulting signal-to-noise ratio of the spectrum can be found in Table 3.
HIRES data are reduced and extracted with the MAKEE software package. Siding Spring (except WiFeS) data are reduced following standard IRAF tasks and procedures. WiFeS integral-field unit data were obtained in single-star mode with twice the spatial binning (1′′ spatial pixels). Spectra are obtained by optimally extracting and combining five image slices (effectively a 5′′ diameter aperture around the object) that contain the majority of the stellar flux. Low-resolution optical spectra for HD 131488 and HD 121191 are shown in Figure 2.
2.2.2 Infrared
Infrared spectroscopic observations sought to further characterize the slope of the continuum excess emission and to identify solid-state emission features.
Ground-based mid-infrared spectroscopy was pursued at Gemini-South with T-ReCS. The observing strategy was similar to that used for imaging (Section 2.1.1), except a slit and grating were employed. Slit sizes and other spectroscopic parameters are listed in Table 4. Data are reduced in the same way as imaging data (Section 2.1.1). Spectral data are then extracted using in-house software routines. Telluric features are removed by dividing target spectral data by spectral data of a standard star. Observational details, including standard stars, can be found in Table 4. Mid-infrared spectra for both stars can be found in Figures 1 and 3.
IRTF SpeX (Rayner et al., 2003) observations of HD 131488 were performed during engineering time; observation parameters can be found in Table 4. The SpeX data for HD 131488 were obtained at an average airmass of 2.15 (close to transit for Mauna Kea). Spectral data are reduced, extracted, wavelength calibrated, and telluric calibrated using SpeXTool (Cushing et al., 2004; Vacca et al., 2003). Telluric features in the SpeX data are removed by dividing the target spectrum by a standard star (HD 130163) observed at similar airmass using a similar observation sequence. The final reduced, flux calibrated spectrum is shown in Figure 1.
3 Results and Analysis
Here observations are synthesized to characterize each host star and its orbiting dust. In addition to the observations reported above, photometric measurements for each source from Tycho-2, 2MASS (Skrutskie et al., 2006), , , and are collected and reported in Table 2. No archival observations exist for either HD 131488 nor HD 121191.
3.1 HD 131488
3.1.1 Association and Age of HD 131488
HD 131488 is located within the greater Scorpius-Centaurus OB association (ScoCen; e.g., Preibisch & Mamajek 2008) and resides in a region of the sky that is typically ascribed to the Upper-Centaurus-Lupus association (UCL; see Table 5 herein and Figure 8 of Zuckerman & Song, 2004). Age estimates for the UCL range from 10-20 Myr (de Geus et al. 1989; de Zeeuw et al. 1999; Sartori et al. 2003; Song et al. 2012). It is interesting to note that if HD 131488 has such a young age, then it should be on the zero-age main sequence for A-type stars and lie with other young A-type stars on the HR-diagram presented in Figure 5 of Zuckerman (2001). Under this consideration it is possible to make estimates for the distance to HD 131488 with the assumption that it is young. These estimates can then be checked for robustness by seeking agreement with kinematics of the UCL and HD 131488 (indeed, as shown below, such agreement is found). For distances of 190 pc, HD 131488 would appear close to the Pleiades A-type main sequence, while for distances less than 150 pc it would appear below the ZAMS for A-type stars. Thus, to have agreement with the zero-age main sequence for A-type stars, a distance estimate of 150 pc (and a distance range of 150-180 pc) is obtained for HD 131488. Such distances agree with those for the UCL (de Zeeuw et al., 1999).
We obtained several high- and medium-resolution optical echelle spectra of HD 131488 to determine its radial velocity (and hence kinematics to compare to those of the UCL) and whether or not the radial velocity varied (to search for evidence of binarity). No evidence for radial velocity variation is seen between individual epochs to within the measurement errors (which are typically 3 km s-1 for this rapidly rotating A-type star). The radial velocity quoted in Table 5 is the average of all five epochs. Combining this measurement with the Tycho-2 measured proper motion and the above photometric distance estimate allows us to calculate the UVW space motions for HD 131488111UVW are defined with respect to the Sun; we employ a right-handed coordinate system and have positive U towards the Galactic center, positive V in the direction of Galactic rotation, and positive W toward the North Galactic pole.. Comparing HD 131488’s UVW space motions (Table 5) to those of the UCL (U5.10.6 km s-1, V19.70.4 km s-1, W4.60.3 km s-1; Sartori et al. 2003; Chen et al. 2011) secures our identification of HD 131488 as a member of that association. We adopt an age of 10 Myr for HD 131488, consistent with the considerations of Song et al. (2012).
3.1.2 Characterizing HD 131488’s Infrared Excess
T-ReCS N-band photometric imaging recovers a point source having flux consistent with the IRAS 12 m data point. Further imaging at N- and Qa-band allowed us to identify, to within 0.5′′, HD 131488 as the carrier of the mid-infrared excess. No extension in the point-spread function of any mid-infrared imaging was detected. -band adaptive optics imaging also recovers a single point source with a core point-spread function full-width at half-maximum of 80 milliarcseconds.
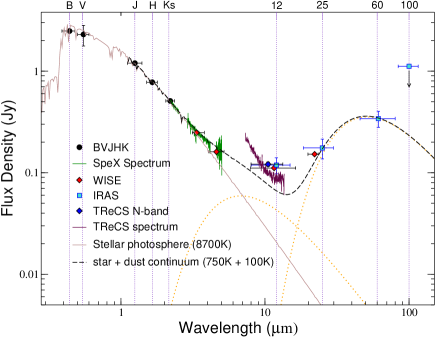
SpeX thermal-infrared spectroscopy in the 2-5 m range suggests that the excess emission towards HD 131488 begins at wavelengths as short as 4 m (Figure 1). T-ReCS N-band spectroscopy reveals a strange profile reminiscent of the Rayleigh-Jeans slope of a blackbody (Figure 1). However, the flux level of the spectrum is significantly above the stellar photosphere. Since it is unlikely that there is a contaminating background source, this strange profile is attributed to material associated with the star. The possibility of a solid-state feature is discussed in Section 4.
We estimate the dust temperature and fractional infrared luminosity of the material surrounding HD 131488 through model fitting. We fit optical and near-infrared measurements out to J-band with a synthetic stellar atmosphere spectrum (Hauschildt et al., 1999) to estimate the stellar flux and add blackbodies (eventually found through 2 minimization to have temperatures of 750 and 100 K) to fit the near- to far-infrared excess emission. Two blackbodies are used as a single blackbody cannot reasonably fit both the short- and long-wavelength excess emission. Decomposing the dust into two components, hot and cold, we estimate that the cool component contributes 210-3 to the total fractional infrared luminosity (total LIR/Lstar610-3) while the hot component contributes 410-3. From the fitted temperatures, and adopting the spectral energy distribution fit Tstar=8800 K and the derived Lstar=15.5 L⊙, we determine that blackbody dust grains having temperatures of 750 and 100 K reside at 0.6 AU and 35 AU separations from HD 131488, respectively. We note that this temperature decomposition is ambiguous due to the incomplete far-infrared coverage of the cool dust excess emission. Far-infrared measurements extending beyond 60 m will enable an unambiguous decomposition of the hot and cold dust regions and perhaps further enable identification of the strange absorption/emission feature seen in the T-ReCS spectrum.
3.2 HD 121191
3.2.1 Association and Age of HD 121191
HD 121191 falls in the plane of the sky between the UCL and Lower-Centaurus-Crux associations (LCC; e.g., see Table 5 and Figure 8 of Zuckerman & Song 2004). Using a methodology similar to that described for HD 131488 (Section 3.1.1), we estimate a distance to HD 121191 of roughly 130 pc and a distance range of 120-140 pc. Such a distance is in agreement with accepted distances to UCL and LCC (e.g., de Zeeuw et al., 1999). Two epochs of SSO-E measurements reveal no evidence for radial velocity variability and the value reported in Table 5 is the average of both epochs. We compute UVW space motions from the obtained kinematic data and find that HD 121191 has space motions consistent with either of the UCL or LCC sub-regions (Table 5; LCC has U7.80.6 km s-1, V20.70.6 km s-1, W6.00.3 km s-1; e.g., Sartori et al., 2003; Chen et al., 2011). Similar to the UCL sub-region, age estimates for the LCC range from 10-20 Myr (de Zeeuw et al., 1999; Sartori et al., 2003; Pecaut et al., 2012; Song et al., 2012). We adopt an age of 10 Myr for HD 121191.
3.2.2 Dust Orbiting HD 121191
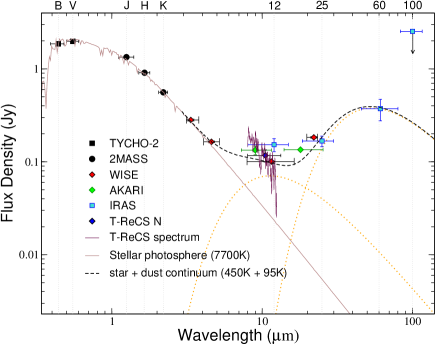
T-ReCS N-band imaging recovers flux consistent with the AKARI measurement and shows that there is no contaminating source outside of 0.4′′ of HD 121191. Measurements from the IRAS Faint Source Reject Catalog suggest strong mid- and far-infrared excess emission toward HD 121191 (Table 2 and Figure 1). However, the IRAS catalog entry for HD 121191 states that there are five cirrus-only extractions near its location and examination of the Scan Processing and Integration tool (ScanPI222http://scanpi.ipac.caltech.edu:9000/applications/Scanpi/index.html) shows a strong 60 m detection at the position of HD 121191 cast over a strongly sloping and structured background. This is suggestive of significant Galactic cirrus (interstellar medium dust clouds) near the location of HD 121191 that could be generating a Pleiades-type effect (Kalas et al., 2002). Although the T-ReCS measurements provide evidence against such an interpretation for the mid-infrared excess emission (such emission would be resolved by T-ReCS; see the case of 29 Per in Zuckerman et al. 2012), it is not clear that the far-infrared excess emission also originates from circumstellar dust and not from cirrus. WISE 22 m measurements of the star show no evidence of extent and report flux density consistent with the IRAS 25 m measurement, hinting that the 60 m flux may indeed originate from circumstellar dust. In the following analysis we consider the 60 m emission as originating from orbiting circumstellar dust, but note that far-infrared imaging is necessary to concretely identify the origin of this star’s far-infrared excess emisson.
Dust temperature and fractional infrared luminosity estimates for the material orbiting HD 121191 are performed in a similar manner to HD 131488 (Section 3.1.2). The blackbodies used in fitting the excess emission seen toward HD 121191 have temperatures of 450 and 95 K (Figure 1) and result in a total fractional infrared luminosity of LIR/Lstar4.910-3. Decomposing this into the hot and cold dust components it is found that the hot dust contributes 2.310-3 to the fractional infrared luminosity while the cold component contributes 2.610-3. From the spectral energy distribution fit Tstar7700 K and the derived Lstar7.9 L⊙ we determine that blackbody dust grains having temperatures of 450 and 95 K would have orbital semi-major axes of 1.3 and 28 AU. Similar to the case of HD 131488, and given the question of the origin of the far-infrared excess emission, it is possible that these values will change when complete far-infrared measurements become available.
4 Discussion
Given the young ages of HD 131488 and HD 121191, it is prudent to wonder whether their orbiting material could be remnant protoplanetary disk material left over from the star formation event. If this were the case, and given the location of the inner planetary system dust (Sections 3.1.2 and 3.2.2), we would expect to see some gaseous material infalling onto the star that would manifest itself as emission lines in an optical spectrum. We see no evidence in either our low- or high-resolution spectra for infalling gaseous material (Figure 2). When considered with the results of Zuckerman et al. (1995), Carpenter et al. (2006), and Currie et al. (2009) regarding the more rapid evolution of disks around early-type stars, the lack of signatures of gas accreting onto either star leads us to conclude that their orbiting material is second generation debris that is being released by the collisions of mature rocky objects.
Modeling the observed excess infrared emission shows that both HD 131488 and HD 121191 host dusty debris in regions of their planetary system with temperature-equivalent separations in our Solar system comparable to the orbit of Mercury and close to that of Saturn. For the cool dust in each system we estimate that the maximum fractional infrared luminosity that could be produced by steady-state collisions of planetesimals (fmax in Equation 18 from Wyatt, 2008) is 0.1%. Since the cool dust fractional infrared luminosity (LIR/Lbol; hereafter ) for both HD 131488 and HD 121191 is not significantly greater than the fmax value, this suggests that the cool dust orbiting both stars is readily explained as originating in steady-state collisions among rocky objects in a Kuiper-belt analog (Wyatt, 2008).
HD 131488 and HD 121191 are the first early-type stars identified with hot debris disks having large fractional infrared luminosities and substantial outer debris belts. To date, other early type stars, when hosting copious amounts of inner planetary system dust, showed no signs of dust production in their outer planetary systems (see Table Copious Amounts of Hot and Cold Dust Orbiting the Main Sequence A-type Stars HD 131488 and HD 121191 and references therein). Thus, HD 131488 and HD 121191 join a growing class of objects previously only populated by Sun-like stars namely V488 Per (Zuckerman et al., 2012) and HD 166191 (Schneider et al., 2013) to host both substantial inner and outer planetary system debris belts. It is worth noting that a strong solid-state emission feature detected toward HD 166191 almost certainly originates from silicate species (Schneider et al., 2013), indicating that the unusual feature potentially seen in the mid-infrared spectra of HD 131488 and HD 121191 is not a common feature of stars hosting both inner and outer planetary system dust. V488 Per, despite being the dustiest main sequence star known to date and host to hot and cold dust, has no mid-infrared spectrum that we know of.
The hot dust components seen for each star host values that are the largest yet seen for A-type stars. Table Copious Amounts of Hot and Cold Dust Orbiting the Main Sequence A-type Stars HD 131488 and HD 121191 compiles all main sequence stars of spectral type earlier than F3 which host confirmed inner planetary system material with 10-3. It is clear that HD 131488 and HD 121191 dominate other stars of spectral type A. Also notable is a dramatic drop in the most extreme values observed when crossing from spectral types F to A. Of special interest, though, is the tight clustering of the ages of these sources. Even when one considers the range of plausible ages for these systems which is on the order of 10-20 Myr for all Table Copious Amounts of Hot and Cold Dust Orbiting the Main Sequence A-type Stars HD 131488 and HD 121191 stars except HD 145263 (whose age is likely between 3-10 Myr) there are no systems with ages above 20 Myr. This result is despite numerous targeted surveys and blind cross-correlation searches that included early-type stars with ages greater than 20 Myr (e.g., Rieke et al. 2005, Moór et al. 2006, Su et al. 2006, Rhee et al. 2007b, Currie et al. 2008, Balog et al. 2009, Melis 2009, Morales et al. 2009, Zuckerman et al. 2011, Chen et al. 2012). This age clustering suggests that early-type stars experience large dust-producing events at an earlier time than do Sun-like stars which have been shown to host extremely dusty systems between ages of 30-100 Myr (Melis et al., 2010). If these dust-producing events at early-type stars are associated with terrestrial planet building as was suggested for the Sun-like stars in Melis et al. (2010), then the indication is that early-type stars complete the terrestrial planet building process much more rapidly than do stars like the Sun.
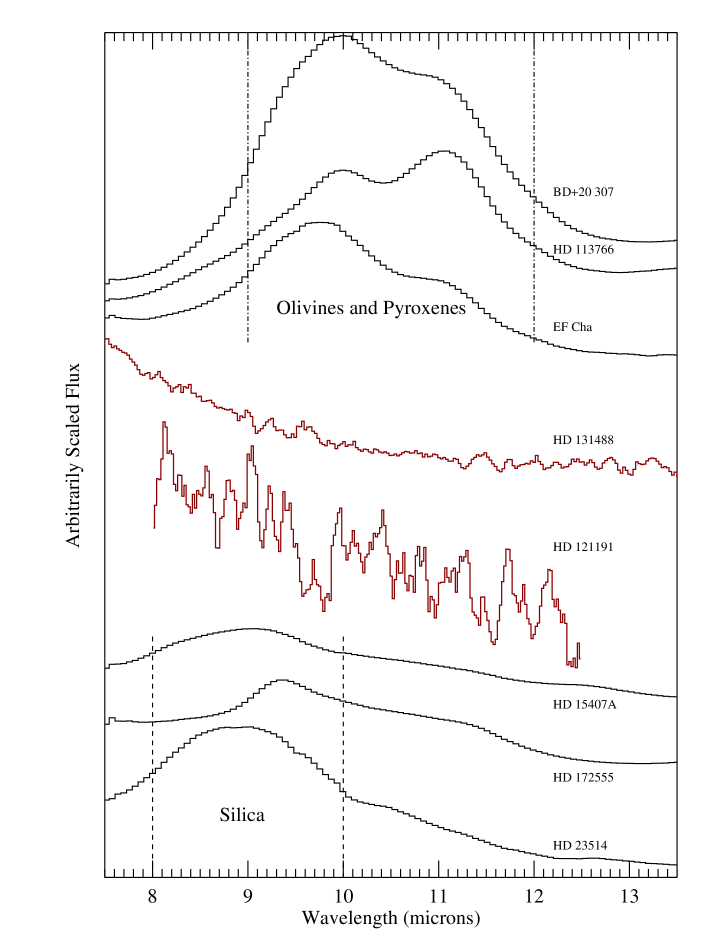
The strange profile detected in the T-ReCS N-band spectra adds an extra peculiarity to the cases of HD 131488 and HD 121191. The SpeX data and the T-ReCS N-band photometric measurement for HD 131488 require that the red wavelengths of the T-ReCS N-band spectrum be roughly consistent with the dashed model sum line plotted in Figure 1. When the red part of the T-ReCS N-band spectrum is anchored as such, then the rising slope at blue wavelengths of the T-ReCS spectrum must turn over to meet the red end of the SpeX spectrum as it rises off of the stellar photosphere. These features suggest an emission “bump” in the mid-infrared that is likely due to a broad solid-state resonance in emission. The T-ReCS spectrum for HD 121191, although of low signal-to-noise ratio, presents a slope like that seen in HD 131488 (Figure 3) and hence suggests a similar feature in its mid-infrared spectrum. Comparing to other well-studied sources (Figure 3) suggests that the unusual solid state emission feature cannot be due to more commonly observed minerals like olivine, pyroxene, or silica (e.g., Chen et al., 2006; Lisse et al., 2008, 2009; Sargent et al., 2009). Unfortunately, the limited data set in hand prevents conclusive analysis. We note that carbonaceous materials, like calcite (CaCO3), are able to reproduce reasonably well an emission feature with peak near 7 m and the red shoulder of the T-ReCS N-band spectra. But, these materials often have other transitions that should be seen in our T-ReCS or SpeX spectra (e.g., the 11.5 m calcite band). High quality mid-infrared spectroscopy should be able to settle the existence and identity of any spectral features. Until the hot dust mineralogy is settled, it cannot be concluded with confidence that either of HD 131488 or HD 121191 have inner planetary system dust generated by collisions between rocky bodies. For example, one might consider a scenario where the mid-infrared continuum and emission feature is generated by dust and water from a swarm of out-gassing cometary bodies (C. Lisse 2012, private communication evaporating cometary bodies have been suggested as an explanation of optical and ultraviolet absorption line variability in some dusty stars; see e.g., Ferlet et al. 1987; Montgomery & Welsh 2012).
5 Conclusions
We have identified two early-type main sequence stars that are orbited by copious amounts of hot dust at semi-major axes comparable to that of the Sun’s terrestrial planets. In addition to hot inner planetary system material, both HD 131488 and HD 121191 are host to cooler dust in their outer planetary system and strange solid-state emission features that make ambiguous the origin of their inner planetary system dust.
Synthesis of those early-type stars (spectral types earlier than F3) with hot inner planetary system dust and fractional infrared luminosities 10-3 suggests that these systems are typically only found when their host stars have ages between 5-20 Myr. If these systems are linked to the final giant impact-type phase of terrestrial planet-building as suggested for Solar-mass stars (Melis et al., 2010), then early-type stars would appear to finish this stage of planet formation much sooner than do Sun-like stars (for which exceptionally dusty systems have been observed in the age range of 30-100 Myr; Melis et al. 2010).
References
- Balog et al. (2009) Balog, Z., et al. 2009, ApJ, 698, 1989
- Bessell (2000) Bessell, M. S. 2000, PASP, 112, 961
- Carpenter et al. (2006) Carpenter, J. M., Mamajek, E. E., Hillenbrand, L. A., & Meyer, M. R. 2006, ApJ, 651, L49
- Chen et al. (2011) Chen, C. H., Mamajek, E. E., Bitner, M. A., Pecaut, M., Su, K. Y. L., & Weinberger, A. J. 2011, ApJ, 738, 122
- Chen et al. (2012) Chen, C. H., Pecaut, M., Mamajek, E. E., Su, K. Y. L., & Bitner, M. 2012, ApJ, 756, 133
- Chen et al. (2006) Chen, C. H., et al. 2006, ApJS, 166, 351
- Cohen et al. (1999) Cohen, M., Walker, R. G., Carter, B., Hammersley, P., Kidger, M., & Noguchi, K. 1999, AJ, 117, 1864
- Currie et al. (2008) Currie, T., Kenyon, S. J., Balog, Z., Rieke, G., Bragg, A., & Bromley, B. 2008, ApJ, 672, 558
- Currie et al. (2009) Currie, T., Lada, C. J., Plavchan, P., Robitaille, T. P., Irwin, J., & Kenyon, S. J. 2009, ApJ, 698, 1
- Currie et al. (2011) Currie, T., Lisse, C. M., Sicilia-Aguilar, A., Rieke, G. H., & Su, K. Y. L. 2011, ApJ, 734, 115
- Cushing et al. (2004) Cushing, M. C., Vacca, W. D., & Rayner, J. T. 2004, PASP, 116, 362
- Cutri & et al. (2012) Cutri, R. M. & et al. 2012, VizieR Online Data Catalog, 2311, 0
- Cutri et al. (2003) Cutri, R. M., et al. 2003, 2MASS All Sky Catalog of point sources., The IRSA 2MASS All-Sky Point Source Catalog, NASA/IPAC Infrared Science Archive. http://irsa.ipac.caltech.edu/applications/Gator/
- de Geus et al. (1989) de Geus, E. J., de Zeeuw, P. T., & Lub, J. 1989, A&A, 216, 44
- de Zeeuw et al. (1999) de Zeeuw, P. T., Hoogerwerf, R., de Bruijne, J. H. J., Brown, A. G. A., & Blaauw, A. 1999, AJ, 117, 354
- Dopita et al. (2007) Dopita, M., Hart, J., McGregor, P., Oates, P., Bloxham, G., & Jones, D. 2007, Ap&SS, 310, 255
- Ferlet et al. (1987) Ferlet, R., Vidal-Madjar, A., & Hobbs, L. M. 1987, A&A, 185, 267
- Fujiwara et al. (2012) Fujiwara, H., et al. 2012, ApJ, 749, L29
- Hauschildt et al. (1999) Hauschildt, P. H., Allard, F., & Baron, E. 1999, ApJ, 512, 377
- Høg et al. (2000) Høg, E., et al. 2000, A&A, 355, L27
- Honda et al. (2004) Honda, M., et al. 2004, ApJ, 610, L49
- Ishihara et al. (2010) Ishihara, D., et al. 2010, A&A, 514, A1
- Kalas et al. (2002) Kalas, P., Graham, J. R., Beckwith, S. V. W., Jewitt, D. C., & Lloyd, J. P. 2002, ApJ, 567, 999
- Lisse et al. (2008) Lisse, C. M., Chen, C. H., Wyatt, M. C., & Morlok, A. 2008, ApJ, 673, 1106
- Lisse et al. (2009) Lisse, C. M., Chen, C. H., Wyatt, M. C., Morlok, A., Song, I., Bryden, G., & Sheehan, P. 2009, ApJ, 701, 2019
- Melis et al. (2010) Melis, C., Zuckerman, B., Rhee, J. H., & Song, I. 2010, ApJ, 717, L57
- Melis et al. (2012) Melis, C., Zuckerman, B., Rhee, J. H., Song, I., Murphy, S. J., & Bessell, M. S. 2012, Nature, 487, 74
- Melis (2009) Melis, C. A. 2009, Ph.D. thesis, University of California, Los Angeles
- Montgomery & Welsh (2012) Montgomery, S. L. & Welsh, B. Y. 2012, PASP, 124, 1042
- Moór et al. (2006) Moór, A., et al. 2006, ApJ, 644, 525
- Morales et al. (2009) Morales, F. Y., et al. 2009, ApJ, 699, 1067
- Moshir et al. (1992) Moshir, M., Kopman, G., & Conrow, T. A. O. 1992, IRAS Faint Source Survey, Explanatory supplement version 2
- Murakami et al. (2007) Murakami, H., et al. 2007, PASJ, 59, 369
- Neugebauer et al. (1984) Neugebauer, G., et al. 1984, ApJ, 278, L1
- Olofsson et al. (2012) Olofsson, J., Juhász, A., Henning, T., Mutschke, H., Tamanai, A., Moór, A., & Ábrahám, P. 2012, A&A, 542, A90
- Onaka et al. (2007) Onaka, T., et al. 2007, PASJ, 59, 401
- Pecaut et al. (2012) Pecaut, M. J., Mamajek, E. E., & Bubar, E. J. 2012, ApJ, 746, 154
- Preibisch & Mamajek (2008) Preibisch, T. & Mamajek, E., The Nearest OB Association: Scorpius-Centaurus (Sco OB2), 235
- Rayner et al. (2003) Rayner, J. T., et al. 2003, PASP, 115, 362
- Rhee et al. (2007a) Rhee, J. H., Song, I., & Zuckerman, B. 2007a, ApJ, 671, 616
- Rhee et al. (2008) — 2008, ApJ, 675, 777
- Rhee et al. (2007b) Rhee, J. H., Song, I., Zuckerman, B., & McElwain, M. 2007b, ApJ, 660, 1556
- Rieke et al. (2005) Rieke, G. H., et al. 2005, ApJ, 620, 1010
- Rodgers et al. (1988) Rodgers, A. W., Conroy, P., & Bloxham, G. 1988, PASP, 100, 626
- Sargent et al. (2009) Sargent, B. A., et al. 2009, ApJS, 182, 477
- Sartori et al. (2003) Sartori, M. J., Lépine, J. R. D., & Dias, W. S. 2003, A&A, 404, 913
- Schneider et al. (2013) Schneider, A., Song, I., Melis, C., Zuckerman, B., Bessell, M., Hufford, T., & Hinkley, S. 2013, ArXiv e-prints
- Skrutskie et al. (2006) Skrutskie, M. F., et al. 2006, AJ, 131, 1163
- Song et al. (2012) Song, I., Zuckerman, B., & Bessell, M. S. 2012, AJ, 144, 8
- Song et al. (2005) Song, I., Zuckerman, B., Weinberger, A. J., & Becklin, E. E. 2005, Nature, 436, 363
- Su et al. (2006) Su, K. Y. L., et al. 2006, ApJ, 653, 675
- Telesco et al. (1998) Telesco, C. M., Pina, R. K., Hanna, K. T., Julian, J. A., Hon, D. B., & Kisko, T. M. 1998, in Society of Photo-Optical Instrumentation Engineers (SPIE) Conference Series, edited by A. M. Fowler, vol. 3354 of Society of Photo-Optical Instrumentation Engineers (SPIE) Conference Series, 534–544
- Vacca et al. (2003) Vacca, W. D., Cushing, M. C., & Rayner, J. T. 2003, PASP, 115, 389
- Vogt et al. (1994) Vogt, S. S., et al. 1994, in Proc. SPIE Instrumentation in Astronomy VIII, David L. Crawford; Eric R. Craine; Eds., Volume 2198, p. 362, edited by D. L. Crawford & E. R. Craine, vol. 2198 of Presented at the Society of Photo-Optical Instrumentation Engineers (SPIE) Conference, 362
- Weinberger et al. (2011) Weinberger, A. J., Becklin, E. E., Song, I., & Zuckerman, B. 2011, ApJ, 726, 72
- Werner et al. (2004) Werner, M. W., et al. 2004, ApJS, 154, 1
- Wizinowich et al. (2000) Wizinowich, P., et al. 2000, PASP, 112, 315
- Wright et al. (2010) Wright, E. L., et al. 2010, AJ, 140, 1868
- Wyatt (2008) Wyatt, M. C. 2008, ARA&A, 46, 339
- Zuckerman (2001) Zuckerman, B. 2001, ARA&A, 39, 549
- Zuckerman et al. (1995) Zuckerman, B., Forveille, T., & Kastner, J. H. 1995, Nature, 373, 494
- Zuckerman et al. (2012) Zuckerman, B., Melis, C., Rhee, J. H., Schneider, A., & Song, I. 2012, ApJ, 752, 58
- Zuckerman et al. (2011) Zuckerman, B., Rhee, J. H., Song, I., & Bessell, M. S. 2011, ApJ, 732, 61
- Zuckerman & Song (2004) Zuckerman, B. & Song, I. 2004, ARA&A, 42, 685


| Star | UT Date | Gemini Program | Instrument | Filter | Filter | Photometric |
|---|---|---|---|---|---|---|
| Name | Wavelength (m) | Standard | ||||
| HD 131488 | 16 Jul 2007 | GS-2007A-Q-43 | T-ReCS | N-broad | 10.365.3 | HD 130157 |
| HD 131488 | 06 Jun 2009 | GS-2009A-C-1 | T-ReCS | N-broad | 10.365.3 | aaConditions were not photometric. |
| HD 131488 | 06 Jun 2009 | GS-2009A-C-1 | T-ReCS | Qa | 18.301.5 | aaConditions were not photometric. |
| HD 121191 | 12-14 Aug 2010 | GS-2010B-DD-1 | T-ReCS | N-broad | 10.365.3 | HD 119193bbPhotometry was performed with spectroscopy acquisition images obtained 14 Aug 2010. |
| Filter Name | HD 131488 | HD 121191 | |||
|---|---|---|---|---|---|
| (m) | magnitude | Flux (mJy) | magnitude | Flux (mJy) | |
| 0.44 | 8.090.02 | 232343 | 8.400.02 | 174632 | |
| 0.55 | 8.000.01 | 227121 | 8.160.01 | 196018 | |
| 1.25 | 7.850.03 | 118033 | 7.730.02 | 131924 | |
| 1.65 | 7.850.05 | 76135 | 7.680.02 | 89016 | |
| 2.20 | 7.800.03 | 50614 | 7.700.02 | 55510 | |
| 3.35 | 7.720.02 | 2505 | 7.590.03 | 2828 | |
| 4.60 | 7.560.02 | 1613 | 7.540.02 | 1643 | |
| IRC | 9 | 1647 | 13414 | ||
| T-ReCS N | 10.6 | 12112 | 11712 | ||
| 11.56 | 6.080.01 | 1071 | 6.150.02 | 1012 | |
| 12 | 16930 | 19131 | |||
| IRC | 18 | 1353 | |||
| 22.09 | 4.310.02 | 1563 | 4.140.02 | 1833 | |
| 25 | 15133 | 22130 | |||
| 60 | 34863 | 476125 | |||
Note. — data are from Tycho-2 (Høg et al., 2000) and are converted to the Johnson system following Bessell (2000). data are from 2MASS (Cutri et al., 2003). data are from (Cutri & et al., 2012) and are not color corrected. data are from the IRC all-sky catalog (Ishihara et al., 2010); HD 131488 does not have a reported 18 m flux density in that catalog. data are from the Faint Source Catalog (Moshir et al., 1992) for HD 131488 and the Faint Source Reject Catalog for HD 121191. Neither source was detected by at 100 m and the upper limits are not reported here as they are not restrictive (see Figure 1).
| Star | UT Date | Instrument | Setup | Coverage (Å) | ResolutionaaResolution measurements are from the FWHM of single arclines in our comparison spectra. | S/N | of S/NbbWavelength where S/N measurement was made in the spectrum. (Å) |
|---|---|---|---|---|---|---|---|
| HD 131488 | 14 Feb 2008 | HIRES | UV Collimator | 3000-5900 Å | 40,000 | 100 | 4600 Å |
| HD 131488 | 15 Feb 2008 | SSO-E | 3910-6730 | 25,000 | 50 | 6100 | |
| HD 131488 | 26 Feb 2008 | HIRES | Red Collimator | 4600-9200 Å | 40,000 | 100 | 6350 Å |
| HD 131488 | 14 Jun 2008 | SSO-E | 3910-6730 | 25,000 | 70 | 6100 | |
| HD 131488 | 17 Jun 2008 | DBS | 300B, 3′′ slit | 3300-6200 | 6.8 Å | 100 | 4600 |
| HD 131488 | 13 Jul 2008 | SSO-E | 3910-6730 | 25,000 | 80 | 6100 | |
| HD 131488 | 14 Jul 2008 | DBS | 600B, 3′′ slit | 3800-5500 | 3.3 Å | 100 | 4600 |
| HD 131488 | 15 Jul 2008 | DBS | 600R, 3′′ slit | 5500-7300 | 3.3 Å | 100 | 6700 |
| HD 121191 | 06 Jun 2010 | WiFeS | B3000 | 3400-5900 | 3,000 | 100 | 4600 |
| HD 121191 | 24 Jun 2010 | SSO-E | 4130-6930 | 25,000 | 70 | 6100 | |
| HD 121191 | 20 Jul 2010 | SSO-E | 3910-6720 | 25,000 | 100 | 6100 |
| Star | UT Date | Instrument | Setup | Coverage | Resolution | Telluric | S/N | of S/NaaWavelength where signal-to-noise ratio measurement was made in the spectrum. |
|---|---|---|---|---|---|---|---|---|
| (m) | Standard | (m) | ||||||
| HD 131488 | 27 Apr 2009 | T-ReCS | 0.7′′ slit | 7.5-13.5 | 100 | HD 130157 | 20 | 10.5 |
| HD 131488 | 02 Jul 2009 | SpeX | 0.5′′ slit | 2.2-5.0 | 1500 | HD 130163 | 20 | 4 |
| HD 121191 | 14 Aug 2010 | T-ReCS | 0.26′′ slit | 7.5-13.5 | 300 | HD 119193 | 7 | 10.5 |
Note. — HD 131488 Gemini data are from GS-2009A-DD-5 while HD 121191 data are from GS-2010B-DD-1.
| Parameter | HD 131488 | HD 121191 |
|---|---|---|
| R.A. (J2000) | 14 55 08.03 | 13 55 18.89 |
| Decl. (J2000) | 41 07 13.3 | 54 31 42.7 |
| Vmag | 8.00 | 8.16 |
| BV | 0.09 | 0.24 |
| Sp. Type | A1 V | A5 IV/V |
| Tstar (K) | 8800 | 7700 |
| Rstar (R⊙) | 1.7 | 1.6 |
| Lstar (L⊙) | 15.5 | 7.9 |
| pmRA (mas yr-1) | 19.01.3 | 26.71.4 |
| pmDE (mas yr-1) | 21.81.2 | 18.01.3 |
| RV (km s-1) | +72 | +123 |
| Dist. (pc) | 150 | 130 |
| UVW (km s-1) | 4, 21, 5 | 6, 23, 6 |
| Assoc. | UCL | LCCccHD 121191 lies between the UCL and LCC associations in the plane of the sky and could potentially belong to either group. |
Note. — R.A. and Decl. are from 2MASS (Cutri et al., 2003). Vmag and BV are from Tycho-2 (Høg et al., 2000); see note to Table 2. Spectral types are from the SIMBAD database. Tstar and Rstar are extracted from atmospheric model fits to broadband photomteric measurements. Lstar is then calculated using L4R2SBT4. pmRA and pmDE are from Tycho-2. Radial velocities are measured from our high- and medium-resolution echelle spectra. See Section 3 for how distances are estimated. UVW for the UCL and LCC subgroups are roughly 7 km s-1, 20 km s-1, and 6 km s-1 (Sartori et al., 2003; Chen et al., 2011). Uncertainties for UVW in the table are typically 2-3 km s-1.
| Star | Spectral | Age | Tdust | hotaaLIR/Lbol, the fractional infrared luminosity of the dust. | Rdust | Cool | Solid-State | References |
|---|---|---|---|---|---|---|---|---|
| TypebbSpectral types are estimated from temperatures obtained when fitting atmospheric models to the stellar spectral energy distribution. | (Myr) | (K) | (10-4) | (AU) | Dust? | Features?ccY indicates that solid-state emission features have been detected in mid-infrared spectra of the source. | ||
| HD 131488 | A2 | 10 | 750,100 | 40ddtotal = 60 10-4, see Section 3.1.2. | 0.6 | Y | Y | 1 |
| HD 172555 | A7 | 12 | 320 | 8.1 | 2.6 | N | Y | 2,3,4 |
| HD 121191 | A8 | 10 | 450,95 | 23eetotal = 49 10-4, see Section 3.2.2. | 1.2 | Y? | Y | 1 |
| EF Chamaeleontis | A9 | 10 | 240 | 10 | 4.9 | N | Y | 3,5 |
| HD 113766 | F0 | 10 | 350 | 150 | 1.9 | N | Y | 2,6,7 |
| HD 145263 | F2 | 5 | 200 | 100 | 5.2 | N | Y | 8,9 |