Sub-arcsecond high sensitivity measurements of the DG Tau jet with e-MERLIN
Abstract
We present very high spatial resolution deep radio continuum observations at 5 GHz (6 cm) made with e-MERLIN of the young stars DG Tau A and B. Assuming it is launched very close ( au) from the star, our results suggest that the DG Tau A outflow initially starts as a poorly focused wind and undergoes significant collimation further along the jet ( au). We derive jet parameters for DG Tau A and find an initial jet opening angle of within 2 au of the source, a mass-loss rate of M☉ yr-1 for the ionised component of the jet, and the total ejection/accretion ratio to range from . These results are in line with predictions from MHD jet-launching theories.
keywords:
radiation mechanisms: general — stars: formation.1 Introduction
Young stellar objects (YSOs) drive powerful outflows due to accretion from a surrounding envelope and circumstellar disc. The Class II stage of low-mass protostellar evolution, also known as the Classical T Tauri Star (CTTS) stage, occurs when most of the original core has been accreted, resulting in lower accretion rates through the surrounding accretion disc onto the YSO and the system becomes optically visible (e.g. Pudritz et al., 2007). The physical mechanism by which these outflows are launched and collimated into jets still remains a mystery, however it is widely accepted that magnetic fields play an important role (e.g. Cabrit, 2007). The competing theories for a magnetohydrodynamic (MHD) jet launching mechanism are the X-wind model (Shu et al., 2000), where the jet originates from the interface between the star’s magnetosphere and disc, and the disc-wind model (Ferreira et al., 2006; Pudritz et al., 2007), where the jet is launched from disc radii of 0.1 to a few au. A stellar component may also be present (Matt et al., 2012). CTTSs are a perfect laboratory for studying the jet launching and collimation mechanisms as their proximity (140 pc to the nearest star forming regions) and lack of obscuring envelope give access to the inner jet regions within 20-200 au, where the outflow structure might not yet be significantly disturbed by interaction with the ambient medium (Ray, 2007; Agra-Amboage et al., 2011).
Observations with radio interferometers of YSO outflows have the advantage that their spatial resolution is comparable or better than the Hubble Space Telescope. Moreover, the new class of radio interferometers, such as the extended Multi-Element Radio Linked Interferometer Network (e-MERLIN) in the UK and the Jansky Very Large Array (JVLA) in the US, have vastly improved sensitivity to detect the central jet engine. The emission at these wavelengths for YSOs normally arises from thermal bremsstrahlung radiation (e.g. AMI Consortium: Ainsworth et al., 2012). The emission commonly has a flat or positive power-law spectral index , where the flux density at frequency , and ranges between for the optically thin and for the optically thick case. However, in a number of YSOs non-thermal emission is also seen from an outflow (e.g. Ray, 2007; Carrasco-González et al., 2010) with spectral indices that suggest gyrosynchrotron or synchrotron radiation.
DG Tau A is a highly active CTTS located at a distance of 140 pc in the Taurus Molecular Cloud, and was one of the first T Tauri stars to be associated with an optical jet (HH 158, Mundt & Fried, 1983). The optical outflow is observed to have an onion-like kinematic structure within 500 au of the star, with faster and more collimated gas bracketed by wider and slower material, and the flow becomes gradually denser and of higher excitation close to the central axis (Bacciotti et al., 2000). This behaviour is naturally expected if the wind is launched from a broad range of disc radii (Agra-Amboage et al., 2011). Signatures of jet rotation have been observed (Bacciotti et al., 2002; Coffey et al., 2004, 2007), supporting a magneto-centrifugal jet launch scenario (Pudritz et al., 2007) and the disc has also been shown to rotate in the same direction as the jet (Testi et al., 2002). The HH 158 jet has a position angle (PA) of (Bacciotti et al., 2002) with an inclination angle w.r.t. the line of sight (Eislöffel & Mundt, 1998), and has been traced out to a total projected distance of pc (McGroarty et al., 2007). Radial velocities in the jet have been found to range up to km s-1 with average velocities of km s-1 (Dougados et al., 2000). Extended X-ray emission has also been detected along the outflow (Güdel et al., 2007; Güdel et al., 2008).
Located to the southwest of DG Tau A is DG Tau B, the driving source of the asymmetrical optical jet HH 159 (Mundt & Fried, 1983) and not thought to be related to DG Tau A except by projected proximity (Jones & Cohen, 1986). DG Tau B is a low-luminosity, deeply embedded Class I source (, Watson et al., 2004). It drives a narrow optical jet (Mundt et al., 1991) and a collimated, redshifted CO outflow (Mitchell et al., 1994), both of which are well aligned at a PA of . PAs between have been found for the blueshifted jet (McGroarty & Ray, 2004; Mundt et al., 1991). The total projected length of the DG Tau B bipolar outflow is pc (McGroarty & Ray, 2004). A circumstellar disc has been observed at mm-wavelengths and is perpendicular to the outflow axis (Looney et al., 2000).
In the radio, both DG Tau A and B have compact and elongated morphologies in the known direction of their outflows (Cohen et al., 1982; Bieging et al., 1984; Rodríguez et al., 2012) and possess a positive spectral index typical of free-free emission. Radio spectral energy distributions (SEDs) for these sources are presented in AMI Consortium: Scaife et al. (2012) and Lynch et al. (2013) and show evidence for variability.
In this letter we present the highest resolution radio images of DG Tau A and B made to date and use these new data to constrain the jet opening angle and mass-loss rate in DG Tau A. In Section 2 we present details of these observations and our results in Section 3. In Section 4 we discuss the implications of our findings, compare them with previous data and mock observations, and derive jet parameters. In Section 5 we summarise our conclusions.
2 Observations
The e-MERLIN synthesis telescope is a seven element interferometer with baselines of up to 217 km and connected by a new optical fibre network to Jodrell Bank Observatory near Manchester, UK. An inhomogeneous array, e-MERLIN is comprised of the 76 m Lovell telescope, a 32 m dish at Cambridge, and the following 25 m antennas: Mark II, Knockin, Defford, Pickmere and Darnhall. The data in this work were taken during the commissioning phase of e-MERLIN with only the five 25 m dishes, resulting in a primary beam of , a maximum baseline of 133.7 km (between Pickmere and Defford), and a minimum baseline of 11.2 km (between Pickmere and Mark II). The final, fully expanded array will have a bandwidth of 2 GHz, providing more than the continuum sensitivity as the original MERLIN.
DG Tau A was observed at 5 GHz for hrs by e-MERLIN between 1 and 4 August 2011 (average epoch 2011.58), with MHz sub-bands of 512 spectral channels each, yielding a total bandwidth of 512 MHz. Data were reduced and analysed using the National Radio Astronomy Observatory’s (NRAO) Astronomical Image Processing System (AIPS). Data were initially edited with spflg and ibled, averaged to 64 channels per intermediate frequency (IF) channel, and concatenated with dbcon before further editing was conducted. fring was used to derive delay and rate corrections for the calibrator sources, and calib was used to derive time-dependent phase, and then amplitude and phase solutions.
Flux calibration was performed using short observations of 3C286 at the beginning and end of each run, and the flux density scale was calculated with setjy (Perley & Butler, 2013). The flux density for each IF was then reduced by 4 percent to account for the resolution of the e-MERLIN shortest spacing (see The MERLIN User Guide111www.e-merlin.ac.uk). Calibrator flux densities are listed in Table 1. Bandpass calibration was performed using the bright point sources J 0555+398 and J 1407+284, and the phase was calibrated using interleaved observations of J 0429+2724. Visibilities were re-weighted to take into account the different sensitivity of each dish, and the target source data was split for imaging with the calibration applied. Absolute calibration is expected to be accurate to about 10% for commissioning data.
| Channel No. | 1 | 2 | 3 | 4 |
|---|---|---|---|---|
| Freq. [GHz] | 4.41 | 4.54 | 4.70 | 4.80 |
| 3C286 | 7.63 | 7.50 | 7.37 | 7.25 |
| J 0555+398 | 5.46 | 5.47 | 5.36 | 5.55 |
| J 1407+284 | 2.44 | 2.43 | 2.43 | 2.38 |
3 Results
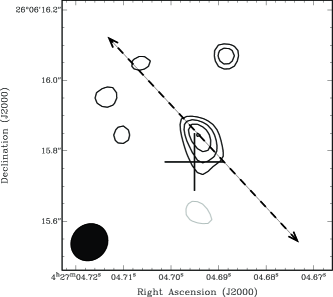
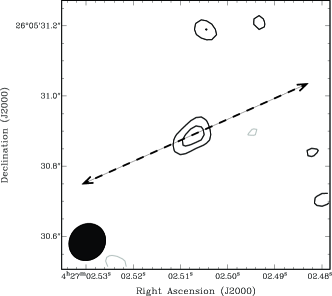
Deconvolution and imaging were performed with imagr. Naturally weighted visibilities were used to ensure optimal signal-to-noise ratio (SNR) levels. Primary beam correction was applied with pbcor. The combined channel map centred at 4.67 GHz (hereafter referred to as 5 GHz) for DG Tau A is shown in Fig. 1a, and we also detect DG Tau B at within our primary beam (see Fig. 1b). The dimensions of the synthesised beam are arcsec with a PA of . The root-mean-square (rms) noise was measured in aips using imean, and the values are Jy beam-1 for the DG Tau A map and Jy beam-1 for the DG Tau B map.
At Epoch 2011.58, we detect DG Tau A at J2000 coordinates . We plot the optical position of this source corrected for proper motion (Zacharias et al., 2013) as a cross in Fig. 1a, where the errors are indicated by the size of the cross, and find our radio detection in agreement within the errors. This signifies that the emission is stationary and coincides with the source and is not a faster moving knot of emission.
Due to the high resolution of e-MERLIN, we are unable to identify the source to the north in Fig. 1a, although we suspect it may be extragalactic. In the absence of further data at similar resolution and sensitivity, we cannot say definitively and therefore do not discuss it further in this work.
(a)
(b)
Flux densities were extracted from the primary beam corrected maps using jmfit. Errors on the flux densities are calculated as , where is 10% absolute calibration error on the total 5 GHz flux density , is the rms noise and is the fitting error returned from jmfit. All errors are quoted to 1 .
4 Discussion
DG Tau A. At 5 GHz, we detect DG Tau A at , and the source exhibits an asymmetric, compact and slightly elongated morphology consistent with the known direction of the outflow axis. We find a total flux density Jy and a peak flux density Jy.
This source has been seen to possess a slightly rising radio spectrum with (Scaife et al. 2012; Lynch et al., 2013), typical of collimated thermal jets or spherical stellar winds (Reynolds, 1986). However, when the total flux density from this work is compared with the nearly coeval JVLA A-configuration observations (Epoch 2011.46) at 8.5 GHz from Lynch et al. (2013), a spectral index is found. Within the error this spectral index is possibly consistent with free-free emission, however is generally considered unphysical for free-free emission. Although variability is expected to cause some difference in the measured flux densities between different observation epochs, we expect this is not the case here. In particular, the transit time across the source at maximum jet velocity is months, which is longer than the amount of time between the JVLA and e-MERLIN epochs (1 month) and is therefore not the cause of the discrepancy. We suggest that the unphysical spectral index in this case arises predominantly from the mismatch in angular scales recovered by the two arrays. The longer baselines of the e-MERLIN array compared to those of the JVLA will reduce the sensitivity to larger scale structure. We expect source components radians ( arcsec for a minimum baseline of km) to be attenuated by more than 50 percent of their flux, and therefore undetected. As a result, extrapolating between the e-MERLIN and JVLA data will give an inaccurate spectral index, which is indeed the case.
To cross-check our commissioning data, we simulated the observations with the casa simulator toolkit using a simple Gaussian flux distribution model of the JVLA data (Lynch et al., 2013) as the sky model (deconvolved dimensions provided by C. Lynch, priv. comm.). Running simobserve, we find that the angular scale and general morphology of DG Tau A from the simulated visibilities is in agreement with our observations. Additional observations with e-MERLIN at different frequencies are needed to constrain the spectral index on this scale, although with the improved sensitivity provided by the Lovell telescope and the full bandwidth of 2 GHz, it may be possible to extract an instantaneous e-MERLIN spectral index from this source.
DG Tau B. We detect DG Tau B at within the e-MERLIN primary beam, with Jy and Jy. The morphology is jet-like and has a deconvolved PA of , consistent with the known jet axis (Mundt et al., 1991). A variable free-free component is suggested by the SED of DG Tau B, which could be explained by non-steady accretion/ejection (e.g. Kenyon & Hartmann, 1995). There is contribution to the radio emission from the dust disc at higher radio frequencies (Scaife et al. 2012), however the contribution at 5 GHz for both DG Tau A and B should be negligible.
4.1 Jet Opening Angle
The strongest constraints on the jet collimation scale come from measurements of nearby T Tauri stars with the Hubble Space Telescope (Ray et al., 1996) and ground-based adaptive optics, including DG Tau A (Dougados et al., 2000). They show that jets from protostars appear resolved transversely and collimated as close as 35-50 au from the central star, with initial opening angles of which drop to only a few degrees beyond 50 au. However, if the jet originates from a region within 1 au of the star, it must have to reach the observed width, and then undergo strong recollimation within 35-50 au (Cabrit, 2002).
We define the direction of the line of brightest emission to be the e-MERLIN jet direction of DG Tau A, which is consistent with that found in the optical. We take one dimensional cuts perpendicular to that direction with the AIPS task slice to determine the initial opening angle found with our e-MERLIN data. Each slice is fit with a Gaussian using slfit and the FWHM of the Gaussian is then deconvolved from the synthesised beam to determine the FWHM of the jet at that distance. The peak of the emission in our 5 GHz map (Fig. 1a) is assumed to be the base of the jet, and the last slice of the jet was made at a distance of 0.07 arcsec from this point and has a FWHM of 0.09 arcsec (12.6 au). As the emission at 5 GHz terminates at this point, we identify it as the unity optical depth surface () and use the radius of the jet measured here to compute the mass-loss rate, see Section 4.2.
In Fig. 2, we show the FWHM of the jet as a function of distance from the star, and include the optical measurement at 56 au from Dougados et al. (2004) in the plot along with our radio measurements. We fit two linear regressions: (1) to only the five e-MERLIN data points, and (2) to the e-MERLIN and 56 au optical data points to calculate the average, constant opening angle for these ranges. From the linear fit to the e-MERLIN data we find an average, constant opening angle (for distances au), and when the optical point at 56 au is included we find an angle of . For comparison, the average opening angle on scales of au is based on data from Dougados et al. (2004).
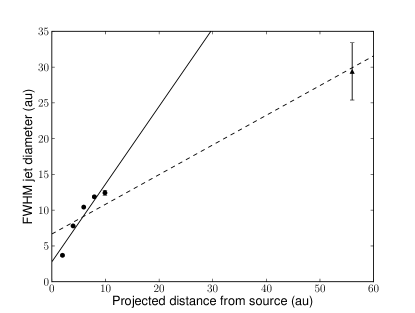
If we derive the opening angles from only the first and last slices, we find at 2 au from the source and at 10 au. Many studies have shown that the initial opening angle is much larger than the average opening angle further down the jet (e.g. Mundt et al., 1991; Raga et al., 1991), indicating that jets are often only partially collimated on scales of tens of au and that a significant amount of collimation is achieved over the length of the jet. DG Tau A itself has also been shown to have a wider compared with other CTTS, and it has been suggested that it is due to precession or contribution from strong bow-shock wings (Dougados et al., 2000). Mundt & Fried (1983) find an opening angle of for a jet length of 8 arcsec, showing further collimation on large scales. Our measurement of is much larger than that found further along the jet, suggesting that the DG Tau A jet starts initially as a poorly collimated wind close to the star and is recollimated further down the flow, in agreement with both disc wind (Ferreira et al., 2006) and X-wind (Shang, 2004) theories.
4.2 Mass-loss Rates
The mass-loss rate () is a vital parameter to derive as the mass ejection to accretion rate ratio is a constraining parameter for MHD launching models. The mass-loss rate for the blueshifted DG Tau A jet has been estimated by various authors using different techniques. Mass-loss rates ranging between M☉ yr-1 have been estimated from observations at optical wavelengths (Hartigan et al., 1995; Lavalley-Fouquet et al., 2000; Bacciotti et al., 2002; Coffey et al., 2008; Agra-Amboage et al., 2011; Maurri et al., 2013, submitted). These estimates show discrepancies of almost two orders of magnitude depending on the adopted method for calculating due to high uncertainties on physical properties (e.g. jet radius) and extinction (Cabrit, 2007; Agra-Amboage et al., 2011).
Using Herschel/PACS observations, Podio et al. (2012) estimate M☉ yr-1 from the [OI] 63 m luminosity. If the ejected material is moving fast enough to produce a dissociated J-shock, then [OI] emission will be the dominant coolant in the postshock gas for temperatures of 100-5000 K and is therefore a direct tracer of the mass flow into the shock.
To directly compare found using our new e-MERLIN data with recent JVLA results, we follow the method described in Lynch et al. (2013). Free-free emission depends on the observing frequency, the plasma temperature, and the linear emission measure. The optical depth at a given location in the jet can be estimated from source structure and the plasma temperature is known from optical line observations, therefore we can calculate the emission measure and further the electron density in the jet at that particular location. As the entire detected radio jet is the optically thick surface for the spatial resolution of e-MERLIN, we identify the observed termination of the radio jet with the unity optical depth surface () at 5 GHz. We measure a distance of arcsec (9.8 au projected for a distance of 140 pc, see Section 4.1) from the base of the jet to the surface. Assuming a mean temperature of K, the emission measure at 0.07 arcsec is pc cm-6. This yields an electron density of cm-3 at this location in the jet.
We then use a simple jet density and cross-section model to compute in the ionised component. For a jet of density , cross-section , and velocity , . Assuming a circular cross section of radius and complete ionisation in the flow such that (where is the mean atomic weight and is the proton mass), the mass-loss rate can be re-written as
| (1) |
For an estimated jet radius of 6.3 au at 0.07 arcsec and an average radial velocity of 200 km s-1, we find M☉ yr-1, within a factor of 3 of that found by Lynch et al. (2013). This is an underestimate of the total mass-loss rate as it is only a measure of the ionised component. An ionisation fraction of per cent is found when comparing our value for with the total mass-loss rate from Podio et al. (2012), which is consistent with previous measurements (e.g. Coffey et al., 2008).
As jets are ultimately powered by accretion (Cabrit et al., 1990; Hartigan et al., 1995), the ejection/accretion ratio is therefore a key parameter to constrain the jet acceleration mechanism and launch site (Cabrit, 2007). Hartigan et al. (1995) inferred a mean one-sided ratio , however recent accretion rate estimates (Agra-Amboage et al., 2011) are an order of magnitude lower on average and therefore provide a ratio higher.
Agra-Amboage et al. (2011) find a possible range for the mass accretion rate M☉ yr-1 for the blueshifted jet of DG Tau A when comparing different estimates of this rate by different authors, and find for the one-sided mass-loss to mass-accretion rate in the [FeII] emitting flow. Maurri et al. (2013, submitted) find , and using the result for presented in this work, we find , compatible with the range of predicted by MHD models for disc-winds (Ferreira et al., 2006) and for X-winds (Shu et al., 2000). Multiplying by 2 to account for the redshifted jet yields for the total ejection/accretion ratio, in agreement with other estimates (Cabrit, 2007).
5 Conclusions
In the case of DG Tau A, our results suggest that the jet starts initially as a poorly collimated wind and becomes collimated on scales of 50 au, in line with MHD disc-wind theory. We find a large initial opening angle of within 2 au of the base of the jet which becomes smaller further out, a mass-loss rate of M☉ yr-1 for the ionised component, and a total ejection/accretion ratio of . These results are in accord with predictions of MHD jet-launching models.
The improved sensitivity of e-MERLIN has provided the highest resolution images of the CTTS DG Tau A and the nearby Class I protostar DG Tau B at cm-wavelengths. This work gives a preview on how e-MERLIN will contribute to the study of low-mass YSOs and their outflows, as observations of the inner 20 au are needed to test different jet-launching scenarios. We have already probed these objects with a new level of angular resolution and sensitivity with e-MERLIN during the commissioning phase, and they will be further improved with the final array.
6 ACKNOWLEDGEMENTS
We thank John Bally for his constructive comments that helped to clarify these results. We thank the staff of the e-MERLIN/VLBI National Radio Astronomy Facility at Jodrell Bank Observatory for their assistance in the commissioning and operation of e-MERLIN. The reserach leading to these results received funding from the European Commission Severnth Framework Programme (FP/2007-2013) under grant agreement No 283393 (RadioNet3). REA would like to thank Anita Richards and Adam Avison of the University of Manchester for assistance with simobserve, and Christene Lynch of the University of Iowa for thorough discussions on the topic of this paper. REA and TPR would also like to acknowledge support from Science Foundation Ireland under grant 11/RFP/AST3331.
References
- Agra-Amboage et al. (2011) Agra-Amboage V., Dougados C., Cabrit S., Reunanen J., 2011, A&A, 532, A59
- AMI Consortium: Ainsworth et al. (2012) AMI Consortium: Ainsworth R. E. et al., 2012, MNRAS, 423, 1089
- AMI Consortium: Scaife et al. (2012) AMI Consortium: Scaife A. M. M. et al., 2012, MNRAS, 420, 3334
- Bacciotti et al. (2000) Bacciotti F., Mundt R., Ray T. P., Eislöffel J., Solf J., Camezind M., 2000, ApJ, 537, L49
- Bacciotti et al. (2002) Bacciotti F., Ray T. P., Mundt R., Eislöffel J., Solf J., 2002, ApJ, 576, 222
- Bieging et al. (1984) Bieging J. H., Cohen M., Schwartz P. R., 1984, ApJ, 282, 699
- Cabrit (2002) Cabrit S., 2002, in Bouvier J., Zahn J.-P., eds, EAS Publications Series Vol. 3, EAS Publications Series. pp 147–182
- Cabrit (2007) Cabrit S., 2007, in Bouvier J., Appenzeller I., eds, IAU Symposium Vol. 243, IAU Symposium. pp 203–214
- Cabrit et al. (1990) Cabrit S., Edwards S., Strom S. E., Strom K. M., 1990, ApJ, 354, 687
- Carrasco-González et al. (2010) Carrasco-González C., Rodríguez L. F., Anglada G., Martí J., Torrelles J. M., Osorio M., 2010, Science, 330, 1209
- Coffey et al. (2008) Coffey D., Bacciotti F., Podio L., 2008, ApJ, 689, 1112
- Coffey et al. (2007) Coffey D., Bacciotti F., Ray T. P., Eislöffel J., Woitas J., 2007, ApJ, 663, 350
- Coffey et al. (2004) Coffey D., Bacciotti F., Woitas J., Ray T. P., Eislöffel J., 2004, ApJ, 604, 758
- Cohen et al. (1982) Cohen M., Bieging J. H., Schwartz P. R., 1982, ApJ, 253, 707
- Dougados et al. (2004) Dougados C., Cabrit S., Ferreira J., Pesenti N., Garcia P., O’Brien D., 2004, Ap&SS, 292, 643
- Dougados et al. (2000) Dougados C., Cabrit S., Lavalley C., Ménard F., 2000, A&A, 357, L61
- Eislöffel & Mundt (1998) Eislöffel J., Mundt R., 1998, AJ, 115, 1554
- Ferreira et al. (2006) Ferreira J., Dougados C., Cabrit S., 2006, A&A, 453, 785
- Güdel et al. (2008) Güdel M., Skinner S. L., Audard M., Briggs K. R., Cabrit S., 2008, A&A, 478, 797
- Güdel et al. (2007) Güdel M., Telleschi A., Audard M., Skinner S. L., Briggs K. R., Palla F., Dougados C., 2007, A&A, 468, 515
- Hartigan et al. (1995) Hartigan P., Edwards S., Ghandour L., 1995, ApJ, 452, 736
- Jones & Cohen (1986) Jones B. F., Cohen M., 1986, ApJ, 311, L23
- Kenyon & Hartmann (1995) Kenyon S. J., Hartmann L., 1995, ApJS, 101, 117
- Lavalley-Fouquet et al. (2000) Lavalley-Fouquet C., Cabrit S., Dougados C., 2000, A&A, 356, L41
- Looney et al. (2000) Looney L. W., Mundy L. G., Welch W. J., 2000, ApJ, 529, 477
- Lynch et al. (2013) Lynch C., Mutel R. L., Güdel M., Ray T., Skinner S. L., Schneider P. C., Gayley K. G., 2013, ApJ, 766, 53
- Matt et al. (2012) Matt S. P., Pinzón G., Greene T. P., Pudritz R. E., 2012, ApJ, 745, 101
- Maurri et al. (2013) Maurri L., Bacciotti F., Podio L., Eislöffel J., Ray T. P., Mundt R., Locatelli U., Coffey D., 2013, preprint
- McGroarty & Ray (2004) McGroarty F., Ray T. P., 2004, A&A, 420, 975
- McGroarty et al. (2007) McGroarty F., Ray T. P., Froebrich D., 2007, A&A, 467, 1197
- Mitchell et al. (1994) Mitchell G. F., Hasegawa T. I., Dent W. R. F., Matthews H. E., 1994, ApJ, 436, L177
- Mundt & Fried (1983) Mundt R., Fried J. W., 1983, ApJ, 274, L83
- Mundt et al. (1991) Mundt R., Ray T. P., Raga A. C., 1991, A&A, 252, 740
- Perley & Butler (2013) Perley R. A., Butler B. J., 2013, ApJS, 204, 19
- Podio et al. (2012) Podio L. et al., 2012, A&A, 545, A44
- Pudritz et al. (2007) Pudritz R. E., Ouyed R., Fendt C., Brandenburg A., 2007, Protostars and Planets V, pp 277–294
- Raga et al. (1991) Raga A. C., Mundt R., Ray T. P., 1991, A&A, 252, 733
- Ray (2007) Ray T. P., 2007, in Bouvier J., Appenzeller I., eds, IAU Symposium Vol. 243, IAU Symposium. pp 183–194
- Ray et al. (1996) Ray T. P., Mundt R., Dyson J. E., Falle S. A. E. G., Raga A. C., 1996, ApJ, 468, L103
- Reynolds (1986) Reynolds S. P., 1986, ApJ, 304, 713
- Rodríguez et al. (2012) Rodríguez L. F., González R. F., Raga A. C., Cantó J., Riera A., Loinard L., Dzib S. A., Zapata L. A., 2012, A&A, 537, A123
- Shang (2004) Shang H., 2004, in Burton M. G., Jayawardhana R., Bourke T. L., eds, IAU Symposium Vol. 221, Star Formation at High Angular Resolution. p. 351
- Shu et al. (2000) Shu F. H., Najita J. R., Shang H., Li Z.-Y., 2000, Protostars and Planets IV, p. 789
- Testi et al. (2002) Testi L., Bacciotti F., Sargent A. I., Ray T. P., Eislöffel J., 2002, A&A, 394, L31
- Watson et al. (2004) Watson D. M. et al., 2004, ApJS, 154, 391
- Zacharias et al. (2013) Zacharias N., Finch C. T., Girard T. M., Henden A., Bartlett J. L., Monet D. G., Zacharias M. I., 2013, AJ, 145, 44