Damage accumulation in quasi-brittle fracture
Abstract
The strength of quasi-brittle materials depends on the ensemble of defects inside the sample and on the way damage accumulates before failure. Using large scale numerical simulations of the random fuse model, we investigate the evolution of the microcrack distribution that is directly related to the strength distribution and its size effects. We show that the broadening of the distribution tail originates from the dominating microcracks in each sample and is related to a tendency of crack coalescence that increases with system size. We study how the observed behavior depends on the disorder present in the sample.
pacs:
46.50.+a, 64.60.Ak, 62.20.mj, 62.20.mm, 62.20.mtI Introduction
The fracture strength of materials is a problem whose general understanding is still based on empirical knowledge that would benefit from a more solid fundamental theory (for a review see Alava et al. (2006, 2009)). The simplest case to study is the one where there is no time-dependent rheology or memory effects like in plastic deformation: the only trace that a sample maintains of its past history is the additional damage that it has accrued during earlier loading. Then, the most important problem of the fracture (peak) strength and its size-scaling becomes an exercise in extremal statistics or the renormalization of distributions of extreme values from sub-systems Manzato et al. (2012); Shekhawat et al. (2013). The main issue can be summarized as follow: does one of the limiting extreme value distributions (i.e. Gumbel, Weibull, Frechet) Gumbel (1958) describe fracture and why? The answer and its explanation depends, in the limit of dilute disorder, on the distribution of (micro)cracks present in the sample. One sub-volume has the largest defect, inducing failure at the stress that this creates by linear elastic fracture mechanics in its neighborhood. Engineers have for decades used the Weibull distribution Weibull (1939) while in other cases, where the stress enhancements turn out to be negligible, even Gaussian (normal) distributions arise (e.g. in the fiber bundle model Pradhan et al. (2010)).
For initially random disorder, the damage present without any previous loading implies an exponential defect distribution at least at weak disorder. If the subsequent damage from loading is neglected, the problem is directly solvable Duxbury et al. (1986, 1987) in terms of a modified Gumbel distribution, which can be shown to flow asymptotically to the limiting Gumbel case Manzato et al. (2012). Damage accumulation does not change this, nor do eventual interactions via long-range stresses do so Shekhawat et al. (2013). However, high-accuracy studies of the defect distributions at peak-load imply that the very small amount of additional damage does affect the tails, changing the original exponential one to a wider one Manzato et al. (2012).
Here, we analyze this mechanism in detail by considering the development of the microcracks for various disorders and as a function of sample size. In the random fuse model simulations we perform to this end - a discretized scalar fracture model - one can keep track of the additional element failures, and analyze in detail the microcrack geometries and densities. The main result we obtain is that the development of the wider tail is a rare-event phenomenon: in each sample, the largest crack contributing to that tail is an unique case, and it typically arises from the coalescence of two smaller microcracks. This phenomenon exhibits scaling with disorder and sample size, and indicates how the details of the damage mechanics will then influence the quantitative stress scaling. This is so since the general form of the defect population merely dictates the form of the extremal distribution and scaling of failure stress with sample size, leaving room for the microscopic detail.
The structure of the rest of this paper is as follows: first we present briefly the numerical model, concentrating more on the analysis of damage and crack evolution. Section 3 presents the results. First we discuss the development of damage as a function of various parameters upto the maximum stress (current) and connect it to the known scaling of the peak stress. Then, we analyze the microcrack distributions at maximum, and pay particular attention to where the largest cracks (in each sample) come from. We present a scaling analysis of their properties with sample size and disorder. Finally, we look at even more detail at the creation of the largest ones: what is the role of damage in crack-coalescence.
II The model
We perform numerical simulations of the two dimensional random fuse model (RFM) de Arcangelis et al. (1985). The model is based on removing one by one conducting bonds, with unit conductivity , from a two-dimensional diamond lattice of size Alava et al. (2006), with periodic boundary conditions in the direction perpendicular to the application of loading. Initially, a fraction of the bonds are removed to result in a statistically homogeneous damage field. In the dilute limit, in particular, it is easy to see Duxbury et al. (1986) that an exponential initial microcrack distribution for defects of size ensues, at zero damage ().
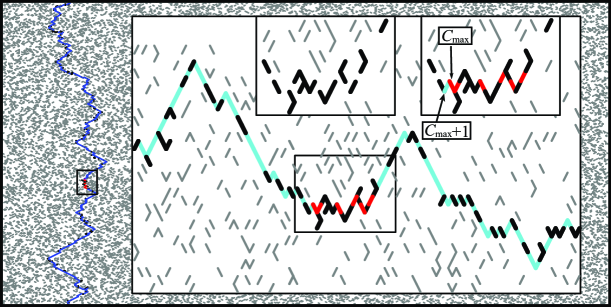
To analyze the development of the microcrack distribution , where now refers to the number of failed bonds/fuses in each sample, we follow the cracks that are present in each sample starting from the original one, . Figure 1 shows an initial damage state and the system at peak load, with . We notice the following details in the damage development: the pre-peak damage is small ( upto ). Some of that damage, if not all of it, is concentrated locally around some pre-existing damage, creating (right small Inset in the Figure) a micro-crack that turns out to be the critical one. This crack is created by the coalesence of damage by ”bridging bonds”. Finally, an unstable avalanche creates the final fracture surface, which is indicated by the blue bonds in the Figure.
III Damage accumulation and cracks
The following analyses are conditioned by the percolation threshold ( for the current geometry). One expects to see different behavior for the damage development in both the weak disorder and percolation limits. Larger values of make the study of crack geometries cumbersome, thus most of the results are confined to . This also excludes the cross-overs from percolation-dominated to ”bulk-like” fracture that happen with increasing in the proximity of the percolation value . We first look in detail at the relevant damage, before concentrating on its role in the formation of the critical microcracks and the crack population dynamics.
III.1 Scaling of damage
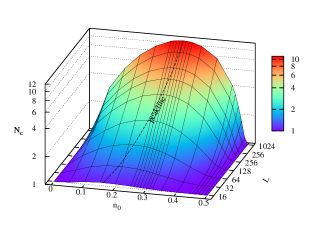
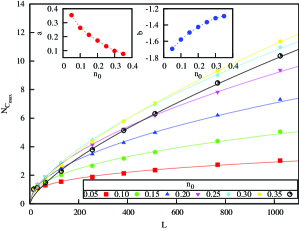
Figure 2 shows the pre-peak damage/sample-averaged in a plot where and are depicted on logarithmic scales. Note that the z-axis starts from unity, since one needs always to break at least one fuse to bring the system to failure. Across the variety of disorder strengths and -values present here it is clear that the typical damage is small — while the strength distribution itself is of the modified Gumbel-type. In both limits of we see that the damage approaches the minimum value. In-between, there is a peak in the damage for a -value, which shifts with and might seem to saturate (i.e. not approach as would be the opposite case).
A more detailed look at the damage scaling in Figure 3 indicates actually the same peak-effect, as the largest disorder case () in the Figure illustrates. All the finite size effects seem to adhere to a power-law increase of , which is sub-extensive, , with negative. Note that the exponent changes monotonically with , and the peak damage with arises thus from a decrease in the prefactor of the power-law. This would imply that the apparent asymptotic saturation of the peak damage in Fig. 2 is just illusory.
III.2 Crack populations at peak strength
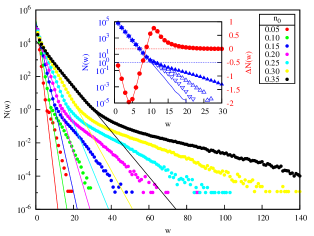
The main question is now, how does the damage influence the cracks at peak strength and thus the important macroscopic scaling of sample strength? Figure 4 shows both a typical result and the main concepts of a detailed analysis to this end. One can distinguish at the peak among several microcrack populations: the original at zero damage (), the one at peak strength, and the one obtained by subtracting for each sample the first- and second- largest microcracks.
As was already pointed out in Ref. Manzato et al. (2012) a wider exponential tail develops at the peak. This, by looking at the difference of the peak and original distributions, arises from the coalescence of original microcracks. By direct observation as such, but also by looking at the distributions with the largest (or second largest as well) removed it becomes clear that the tail is indeed averaged over the largest cracks in each sample.
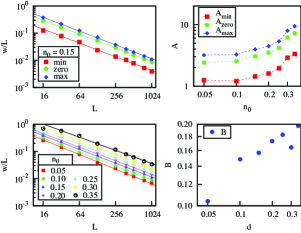
Interestingly Figure 5 shows that the mass transport of cracks follows for all a power-law scaling with . The Inset of Fig. 4 allows to identify three particular values for each and : the negative minimum, the positive maximum, and where the difference of the distributions is zero. They all three follow for each a power-law scaling with the same exponent. The prefactors and power-law exponents follow monotonic trends with disorder.
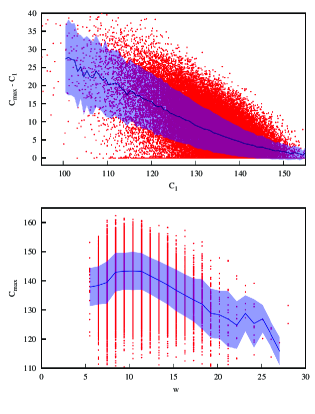
Given that one can find the ”largest crack” in each system, the question remains how and correlate with the strength () of each sample and with each other. Obviously there might be a slight correlation between the two geometrical quantities, since the largest cracks should develop if the system undergoes more failures . The initial step, with is related to the initial strength (or at which the first bond fails. There seems to be a slight anti-correlation in that a large implies a smaller final . If the first bond breaks late, then relatively speaking there is less crack growth. Figure 6 shows the correlation of and : obviously this does not follow the Linear Elastic Fracture Mechanics prediction one-to-one, and it moreover illustrates that the damage that develops is able to decorrelate from . This is not a novelty, since it is known that in the RFM follows a similar modified Gumbel scaling Duxbury et al. (1987) as but with different parameters, and that there is no one-to-one correspondence between and , which would otherwise render fracture prediction rather trivial Duxbury et al. (1987). However, the comparison of with and allows to conclude that such a decorrelation must be due to the fact that the final, critical defect experiences a stress which has a random component.
III.3 Crack coalescence
The results presented above indicate that small amounts of damage is enough to have a profound influence on the kind of dominating microcracks at peak and thus also on the sample strength. Theoretically, the question could be formulated by a Smoluschowsky-like system of rate equations for defects of size to a degree of some generality indeed. As we have already indicated, in the current case — dilution-like random disorder — the most important mechanism seems to be crack coalescence of fusion.
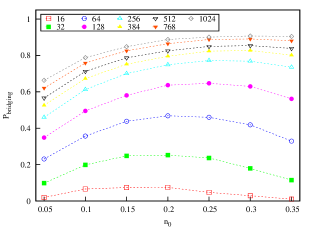
The defining rates or processes for , when — in other words a bond is broken — are i) joining two cracks, ii) crack growth (””), and iii) nucleation of a crack of size one (). One can now check what the effect of is like, and Figure 5 shows the likelihood of the first of these three processes. Three major features emerge: first, the microfailures have a large probability to contribute to crack coalescence. Second, this increases with . Third, there appears again to be a maximum ”efficiency”, at a certain disorder, which shifts slowly with . Attempts to find a scaling form for with and were not successful, leaving an important unanswered question: does it saturate for a given disorder to a value smaller than unity?
IV Conclusions
Here we have done the first systematic analysis of damage mechanics in brittle fracture, using the Random Fuse Model as the theoretical testbed. The approach is interesting for a number of reasons, including the fact that the problem is extremely hard to study experimentally to even a limited extent. What transpires from our results is that the peak-damage and the microcrack populations in our samples at peak stress are determined by the microscopic dynamics of crack growth, which occurs mostly by coalescence. This dynamics is quantitatively dependent to a large degree on the disorder strength and the system size. While the general question of size-effects and fracture strength in these test systems is now finally well-understood, the microscopic details here turn out to be quite important: it is from them that the parameters of the coarse-grained (modified) Gumbel distributions ensue. Thus the damage study at hand here highlights a connection between the microscopic and macroscopic, beyond even that link which ensues during a renormalization or upscaling of sample-size dependent strength distributions.
A number of open avenues for future research must be listed. The detailed connection of the damage scaling(s) and those of strength distributions should be analyzed. The particular case at hand is characterized by a very small damage degree at peak load. Scenarios where the crack population undergoes more a complicated development upto would be of great interest for further studies, such as where the initial one has a power-law form. In a more general sense, our results highlight the old engineering ideas of improving fracture resistance by inhibiting crack growth: minute effects in the fracture resistance may influence the strength quantitatively.
Acknowledgments
S.Z. is supported by the European Research Council Advanced Grant 2011 - SIZEFFECTS and thanks the visiting professor program of Aalto University. We acknowledge support and assistance by CSC IT Center for Science Ltd, Finland and generous resources and sponsorship via the HPC Europe 2 and DEISA Consortium (EU pro jects FP6 RI-031513 and FP7 RI-222919). The Center of Excellence -program (COMP, Center of Excellence in Computational Nanoscience) of the Academy of Finland is thanked. We thank J. P. Sethna and A. Shekhawat for useful discussions.
References
- Alava et al. (2006) M. J. Alava, P. K. V. V. Nukala, and S. Zapperi, Advances in Physics 55, 349 (2006), URL http://www.informaworld.com/10.1080/00018730300741518.
- Alava et al. (2009) M. J. Alava, P. K. V. V. Nukala, and S. Zapperi, Journal of Physics D: Applied Physics 42, 214012 (10) (2009), URL http://stacks.iop.org/0022-3727/42/214012.
- Manzato et al. (2012) C. Manzato, A. Shekhawat, P. K. V. V. Nukala, M. J. Alava, J. P. Sethna, and S. Zapperi, Physical Review Letters 108, 065504 (2012), URL http://link.aps.org/doi/10.1103/PhysRevLett.108.065504.
- Shekhawat et al. (2013) A. Shekhawat, S. Zapperi, and J. P. Sethna, Physical Review Letters 110, 185505 (2013), URL http://link.aps.org/doi/10.1103/PhysRevLett.110.185505.
- Gumbel (1958) E. J. Gumbel, Statistics of Extremes (Columbia University Press, New York, 1958).
- Weibull (1939) W. Weibull, A Statistical Theory Of The Strength Of Materials, no. 151 in Ingeniörsvetenskapsakademiens Handlingar (Generalstabens Litografiska Anstalts Förlag, Stockholm, 1939).
- Pradhan et al. (2010) S. Pradhan, A. Hansen, and B. K. Chakrabarti, Rev. Mod. Phys. 82, 499 (2010), URL http://link.aps.org/doi/10.1103/RevModPhys.82.499.
- Duxbury et al. (1986) P. M. Duxbury, P. D. Beale, and P. L. Leath, Physical Review Letters 57, 1052 (1986), URL http://link.aps.org/doi/10.1103/PhysRevLett.57.1052.
- Duxbury et al. (1987) P. M. Duxbury, P. L. Leath, and P. D. Beale, Physical Review B 36, 367 (1987), URL http://link.aps.org/doi/10.1103/PhysRevB.36.367.
- de Arcangelis et al. (1985) L. de Arcangelis, S. Redner, and H. Herrmann, Journal de Physique Lettres 46, 585 (1985).