A Search for RR Lyrae Stars in Segue 2 and Segue 3
Abstract
We present an extensive search for RR Lyrae stars in and around the ultra-faint Milky Way companions Segue 2 and Segue 3. The former (, Belokurov et al. 2009) appears to be an extremely faint dwarf galaxy companion of the Milky Way. The latter (, Fadely et al. 2011) is among the faintest star clusters known. We use and band time-series imaging obtained at the WIYN 0.9 meter telescope at Kitt Peak National Observatory to search for RR Lyrae in these objects. In our Segue 2 observations, we present a previously unknown fundamental mode (RRab) RR Lyrae star with a period of days. With this measurement, we revisit the inverse correlation between and established in the literature for Milky Way dwarf galaxies and their RR Lyrae. In this context, the long period of Segue 2’s RRab star as well as the known significant spread in metallicity in this dwarf galaxy are consistent with the observed trend in and . We derive the first robust distance to Segue 2, using both its RRab star and spectroscopically confirmed blue horizontal branch stars. Using and dex, we find and kpc; assuming dex, we find kpc. Although no RR Lyrae were present in the Segue 3 field, we found a candidate eclipsing binary star system.
Subject headings:
galaxies: star clusters — galaxies: dwarf — stars: distances — stars: variables: other — techniques: photometric1. Introduction
Over the last decade, numerous ultra-faint () companions of the Milky Way Galaxy have been discovered in Sloan Digital Sky Survey data (e.g. Belokurov et al., 2006, 2007, 2008, 2009, 2010; Koposov et al., 2007; Walsh et al., 2007; Willman et al., 2005a, b; Zucker et al., 2006b, a). Among these discoveries are the least luminous star clusters known (e.g. Koposov et al., 2007; Belokurov et al., 2010; Muñoz et al., 2012), as well as the least luminous, most metal-poor, and most dark matter dominated galaxies known (e.g. Kirby et al., 2008; Wolf et al., 2010; Koposov et al., 2011; Simon et al., 2011; Willman et al., 2011). Due to these satellites’ low luminosities, it is difficult to determine their distances, dynamical states, and stellar populations. The use of RR Lyrae (RRL) stars as standard candles found in time-series observations has provided an alternative to isochrone fitting for measuring satellite distances.
RRL stars are short-period (0.3 - 1.0 days, RRab; 0.1 - 0.55 days, RRc) pulsating variable stars that are found in old and metal-poor stellar populations (Smith, 1995; Vivas et al., 2004; Sesar et al., 2007). They are standard candles with mean absolute band magnitudes of for (Cacciari & Clementini, 2003). RRL stars have been found in considerable numbers in all metal-poor components of the Galaxy; among these RRL are Galactic globular cluster variables as well as field variables in the halo, thick disk, and bulge. RRL stars fall into two distinct regions in period/amplitude space and are thus categorized as fundamental mode (RRab) or first-overtone (RRc) variables whose light curves exhibit characteristic periods, amplitudes, and shapes (Smith, 1995). Both types occupy the intersection of the horizontal branch and the instability strip and thus range in color from to 0.40; additionally, they display a characteristic increase in at minimum light (Smith, 1995).
The QUEST RR Lyrae survey found that RRab stars exhibit light curves with mean band amplitudes of mags and mean periods of days. RRc stars have light curves with mean band amplitudes of mags and mean periods of days. The former have a distinct saw-toothed shape to their light curves, while the latter have a smoother shape (Vivas et al., 2004). Clement et al. (2001) and Miceli et al. (2008) report mean RRL periods for larger samples of RRL stars in Galactic globular clusters and in the field, respectively. The former studies both RRab and RRc stars and finds mean periods for these populations of 0.585 days and 0.349 days, respectively. The latter studies RRab stars alone and reports a mean period of 0.575 days.
Most of the dwarf companions of the Milky Way Galaxy, including many of the ultra-faint companions, have been searched for RRL stars. Boötes I, Canes Venatici II, Coma Berenices, Leo IV, and Ursa Major II are among the ultra-faint companions known to host one or more RRL stars (Siegel, 2006; Dall’Ora et al., 2006; Kuehn et al., 2008; Greco et al., 2008; Musella et al., 2009; Moretti et al., 2009; Dall’Ora et al., 2012). Segue 1, the least-luminous () dwarf galaxy known, has one published RRL star (Simon et al., 2011).
Segue 2 (, Belokurov et al., 2009) and Segue 3 (, Fadely et al., 2011) are two recently discovered ultra-faint companions of the Milky Way Galaxy (see Table 1 for the properties of these objects). Segue 2 is classified as a dwarf galaxy by Kirby et al. (2013), because of the significant spread in the [Fe/H] of its constituent stars (Willman & Strader, 2012). Segue 3 is among the lowest-luminosity star clusters known (Fadely et al., 2011), and shares similar properties with a few other extremely low-luminosity star clusters such as Muñoz 1 (Muñoz et al., 2012). However, its close proximity ( kpc) makes it a particularly strong candidate for studying such an extreme stellar system. Additionally, tidal disruption of the object is suggested by the 11 candidate member stars found more than three half-light radii from the center of the object (Fadely et al., 2011). Thus, Segue 3 may be a valuable laboratory for studying the dynamical evolution of such systems.
The accuracy with which the distances to Segue 2 and 3 can be measured affects the accuracy with which many fundamental physical properties can be determined. The distance to Segue 2 is currently estimated using the apparent magnitudes of four candidate blue horizontal branch members (Belokurov et al., 2009). The distance to Segue 3 is determined by performing isochrone fitting to spectroscopically selected members using a maximum likelihood method (Fadely et al., 2011). If one or more RRL stars can be shown to belong to these objects, then they will provide a robust complimentary approach to constraining these distances.
In this paper, we search for RRL stars in and around Segue 2 and 3. In §2, we describe the collection and reduction of multi-band time-series observations at the WIYN 0.9 meter telescope at Kitt Peak National Observatory. §3 describes the use of DAOPHOT II and ALLSTAR II to perform PSF photometry, details the astrometric and photometric calibration, and describes the selection of variable star candidates. In §4, we present a fundamental mode RRL star in Segue 2 and a candidate eclipsing binary star system in the Segue 3 field. We use the former as well as three confirmed blue horizontal branch members to determine the distance to Segue 2 and then consider its RRL properties in the context of other Milky Way dwarf galaxies. We conclude with a brief review of our results in §5.
2. Data
2.1. Observations and Data Reduction
We obtained Harris and band time-series observations of the Segue 2 and 3 objects using the 0.9 meter WIYN telescope and S2KB CCD camera at Kitt Peak National Observatory. On October 12th and 13th, 2010, in gray conditions, we obtained 24 (11 , 13 band) images of Segue 2 and 42 (20 , 22 band) images of Segue 3. The seeing ranged from to with a median seeing of . From October 8th to 11th, 2011, in bright conditions, we took 69 (34 , 35 band) exposures of Segue 2 and 71 (35 , 36 band) exposures of Segue 3. The seeing ranged from to with a median seeing of . For Segue 2, the exposure times ranged from 300 to 600 seconds in band and 180 to 600 seconds in band. For Segue 3, the exposure times varied from 180 to 300 seconds in both and band. The exposures were taken alternating between the and bands, and the minimum time between subsequent exposures was set by a read-out time of approximately three minutes. The S2KB CCD camera is an array of 2048 by 2048 pixels with a scale of 0.6 arcseconds per pixel. Both Segue 2 (, Belokurov et al. 2009) and Segue 3 (, Fadely et al. 2011) were fully captured within the by field of view.
To prepare the images for analysis, the exposures were bias-subtracted, flat-fielded using dome flats, and trimmed to remove the overscan region. The DAOPHOT II and ALLSTAR II packages were used to perform PSF photometry on all of the images (Stetson, 1987, 1994). We allowed the point-spread function to vary quadratically as a function of position. To assess the point source detection completeness of our photometry, we matched stars from the Sloan Digital Sky Survey Data Release 7 (SDSS DR7) (Abazajian et al., 2009) to our detected sources within the footprint of our observations. For both the Segue 2 and 3 fields, our photometric catalog includes of SDSS stars brighter than mags within our footprint, well below the apparent band magnitude of the horizontal branches of these objects (see §3 and §4). SDSS DR7 is complete to , mags111http://www.sdss.org/dr7/, so we infer a similarly high point source detection completeness for our data. While this comparison with SDSS doesn’t itself account for crowding incompleteness, neither Segue 2 nor Segue 3 are crowded in their central regions. We conclude that it is unlikely that we have missed an RRL star in either Segue 2 or Segue 3 owing to photometric incompleteness, but we cannot rule out the possibility with confidence.
2.2. Astrometric Calibration
The online resource Astrometry.net222http://nova.astrometry.net/ was used to obtain astrometric headers for each exposure. We accessed Astrometry.net with a Python script to enable automated processing of all exposures. We used this astrometry to facilitate cross-matching sources between the S2KB exposures and also to the SDSS DR7 catalog. Since the astrometry in the SDSS catalog is more precise than we could obtain for our KPNO data, all coordinates reported in this paper come from SDSS DR7.
2.3. Photometric Calibration
The data were photometrically calibrated to SDSS DR7 photometry.333Downloaded from http://casjobs.sdss.org/CasJobs/ We transformed the SDSS and magnitudes to and using the filter transformations of Jordi et al. (2006). The errors are on the order of a few hundredths of a magnitude for these filter transformations. In the Segue 2 field, the median errors on our standard magnitudes were thus increased from 0.018 and 0.017 mag in and to 0.037 and 0.020 mag in and , respectively. For the Segue 3 field, the corresponding values were 0.012 and 0.011 in and and 0.029 and 0.016 in and . All magnitudes used for the light curves and distances presented in this paper have been corrected for dust using the Schlegel et al. (1998, hereafter SFD98) maps (assuming = 3.1), and using the updated reddening coefficients presented in Schlafly & Finkbeiner (2011). at the center of Segue 2 is 0.183 and at the center of Segue 3 is 0.099.
We used a maximum likelihood analysis to calibrate our data to SDSS as a function of color, -pixel position, and -pixel position. We maximize the log-likelihood:
| (1) |
where:
| (2) |
and:
| (3) |
Here, refers to the image number and to the star number. and are the instrumental magnitudes and random uncertainties, and are the SDSS magnitudes and uncertainties, and are the SDSS colors and uncertainties, and and are - and -coordinates in pixels. For we use the value reported by the ALLSTAR II software. Thus, a single color term () is found for each data set, while a unique term (), term (), and zero point () is found for each exposure. The final , , , and terms and corresponding uncertainties are taken to be the median and standard deviation of the distributions obtained using a bootstrapping technique. Representative values of , , , and are shown in Table 2. We apply these terms and propagate their uncertainties into the calibrated data and corresponding uncertainties presented in the remainder of this paper. After the data are calibrated, evidence of small spatially dependent residuals is present in the Segue 3 field (but not in the Segue 2 field). While the variable star in the Segue 3 field presented in §4 resides on a part of the chip that appears relatively unaffected, the photometry for the star as presented in Table 3 has an additional systematic uncertainty of a few hundredths of a magnitude.
| Segue 2 | Segue 3 | |
|---|---|---|
| 0.113 | 0.160 | |
| 2.77 | 2.71 | |
| 3.13 | 3.04 |
Note. — Representative values of the photometric calibration coefficients from Equation (2). The , , and terms are medians among all images for each object and filter.
2.4. Selection of Variable Stars
To select a set of variable star candidates, we quantify the change in magnitude between the th observation of a given source and the error-weighted, sigma-clipped average magnitude of the source as:
| (4) |
where and are the average magnitude and the th observed magnitude of the source and and are the uncertainties on these quantities. These include both random and systematic components of the uncertainty. To obtain an initial set of variable star candidates, we selected those stars for which for at least three exposures in either passband and from any observing epoch, as well as those sources which showed a change in magnitude of greater than 0.5 mags.
We evaluate our ability to identify RRL stars as variable star candidates using these selection criteria by simulating RRL light curves at the cadence and precision of our calibrated observations over the full range of RRL period and amplitude parameter space. We base our simulations on a representative set of twenty RRab and two RRc and templates provided by Sesar et al. (2010) and transformed to and using the transformations of Jordi et al. (2006). The uncertainties are simulated as Gaussian random errors equal to the observed uncertainties (including both random and systematic components) for the RRab star in Segue 2 (see §3), and for the candidate eclipsing binary in the Segue 3 field (see §4). We use the eclipsing binary for Segue 3 because its color and magnitude are broadly consistent with the instability strip of Segue 3. A total of 45,000 RRab light curves and 2,000 RRc light curves were simulated by taking linear steps through period, amplitude, and initial phase of observation. The period was varied from 0.3 to 1.0 days for RRab stars and from 0.1 to 0.55 days for RRc stars (Vivas et al., 2004; Sesar et al., 2007). The amplitude was varied from 0.4 to 1.8 mags and from 0.1 to 1.0 mags for RRab and RRc stars, respectively (Vivas et al., 2004; Sesar et al., 2007).
We define the detection efficiency of our study as our ability to select our simulated RRL stars as variable star candidates using the selection criteria described above. Note that this definition of the detection efficiency only assesses our ability to flag a source as a variable star candidate for further evaluation. It does not aim to assess the accuracy with which we recover the source’s input parameters (period, amplitude, etc.) through means such as light curve template fitting. Thus, our detection efficiency mainly assesses whether the cadence of our observations allows for sufficient sampling of RRL light curves to be able to use the selection criteria defined above to identify these light curves as variable.
In Segue 3, nearly all of our simulated RRL were identified as variable star candidates for all periods and amplitudes simulated. In Segue 2, our identification of variable stars was similarly successful; however, in several areas of period/amplitude parameter space, of sources failed to meet our selection criteria. These areas included RRab stars with the lowest amplitudes and longest periods (0.9 - 1.0 days), as well as those with amplitudes of mag. They also included RRc stars with amplitudes mag, with the longest periods again being the least detectable. Given that RRab stars with periods greater than 0.9 days are rare (Miceli et al., 2008; Vivas et al., 2004), as are RRc stars with amplitudes below 0.2 mag (Vivas et al., 2004), we are confident that the cadence of our observations combined with our selection criteria are sufficient for successfully identifying RRL stars as variable star candidates.
In our Segue 2 and 3 observations, approximately 3% and 2% of stars were selected as variable star candidates, respectively. The raw light curves of these candidate variable stars (magnitude vs. HJD) were then visually inspected with particular attention paid to stars that varied in both and band, varied throughout the observing period, and/or showed potentially periodic changes in magnitude. The vast majority of variable star candidates were falsely identified as variable due to outliers in otherwise flat light curves, significant scatter in faint light curves, or proximity to other sources or to the edges of the exposures. A smaller number of stars ( per field) showed non-periodic variation over some or all of the observing period. Although further observation of these stars may inform our understanding of the stellar populations in and around Segue 2 and 3, their lack of periodic variation eliminated them from consideration as RRL stars. Finally, as discussed in Section 4, one clear periodic variable star was identified in each of the Segue 2 and 3 fields.
3. A RR Lyrae in Segue 2
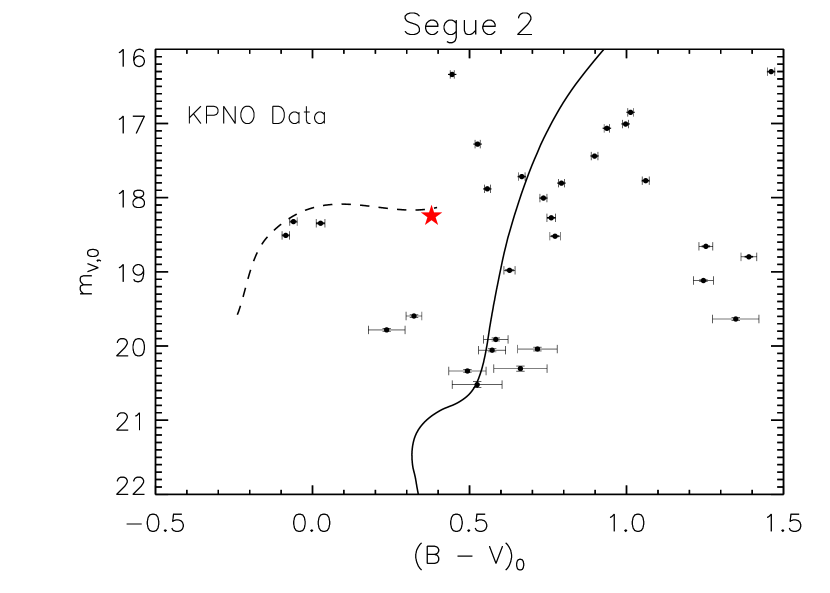
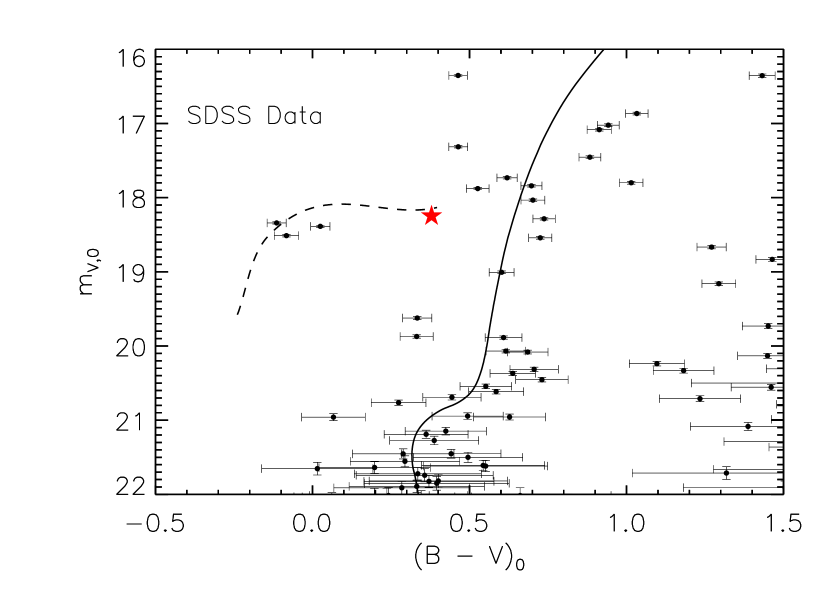
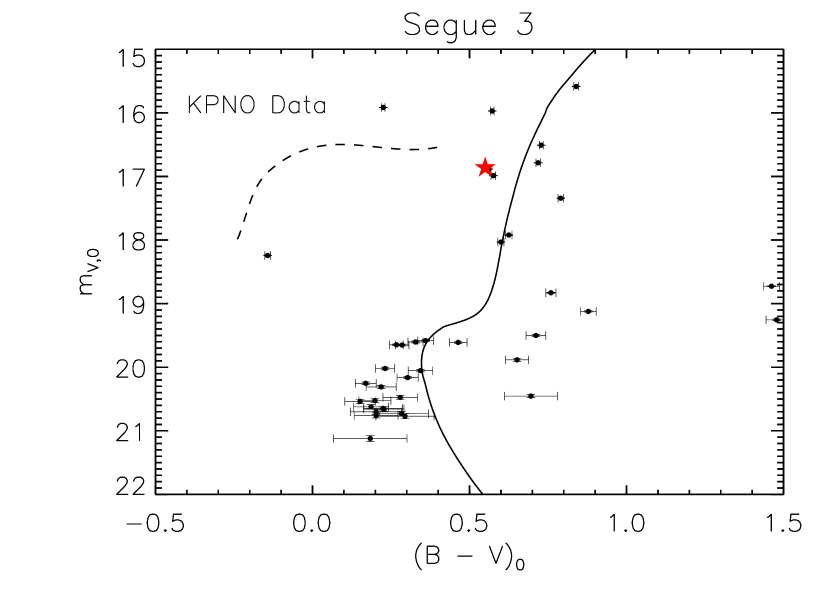
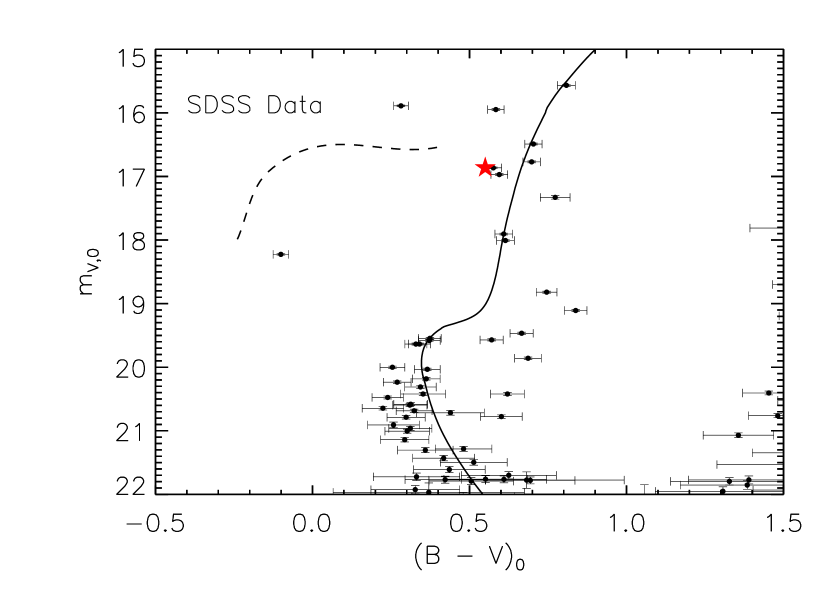
A periodic variable star was detected in Segue 2 at (RA, Dec) = (, ) at a distance of 1.6 half-light radii from the center of the object. This star was found to be a spectroscopic member of Segue 2 by Kirby et al. (2013). The variable has a period, amplitude, and sawtooth-shaped light curve consistent with that of a fundamental mode RRL star (RRab). As shown in Figure 1, the variable has a color and magnitude consistent with being an RRL member of Segue 2 based on past measurements of the distance to Segue 2 (see Belokurov et al. 2009) and KPNO and SDSS photometry of the object.
To deduce the properties of the variable’s light curve, we fit our observed and light curves with the RRab and RRc light curve templates of Sesar et al. (2010). The set consists of approximately twenty RRab and two RRc templates that span a distribution of light curve shapes derived from observations. The SDSS and magnitudes of the templates were transformed to and using the filter transformations of Jordi et al. (2006). For all 420 RRab templates, we initially explored period and amplitude parameter space by conducting gridded searches for a minimum fit. As the template fitting was performed separately in and band, we define the value of a template fit as the sum of the values of its and band fits. We selected eight RRab templates as providing the most reasonable fits to the data (i.e. ). These templates were used to explore the range of possible periods and amplitudes using emcee444http://danfm.ca/emcee/, a Markov Chain Monte Carlo (MCMC) routine (Foreman-Mackey et al., 2012).
For each template, the MCMC sampling returns the posterior distribution of the period and amplitude. We find a bi-modal distribution of periods and amplitudes consisting of a primary and secondary peak in the parameter space. Although the template fitting was performed separately in and band, we selected a single best-fit template having the minimum sum of its values in and . For the primary peak among RRab templates, this best-fit template gives a period of days, a band amplitude of mag, and a band amplitude of mag. At a 68% confidence level, the other seven templates are in good agreement with the first, providing periods as short as 0.742 days and as long as 0.769 days, band amplitudes that range from 0.596 to 0.667 mag, and band amplitudes that range from 0.493 to 0.564 mag. For the secondary peak, the MCMC samples imply a shorter period ( days) and smaller amplitude (). However, the light curve templates in this peak yield much larger values than in the primary peak, and a visual comparison of the light curves and the data reveals them to provide a poor match. Furthermore, Lomb-Scargle periodograms constructed for both bandpasses suggest a most probable period of days, which is broadly consistent with the period of the primary peak.
Additionally, we assessed the likelihood that the variable could instead be an RRc star by exploring period and amplitude parameter space with emcee using two RRc templates. However, the RRc templates generally yield large values and poor visual matches to the data. The only RRc template fits that have values comparable to the RRab fits in the primary peak have periods on the order of 0.75 days, much longer than expected for this class of variable. Thus, this star does not meet the characteristic profile of an RRc star.
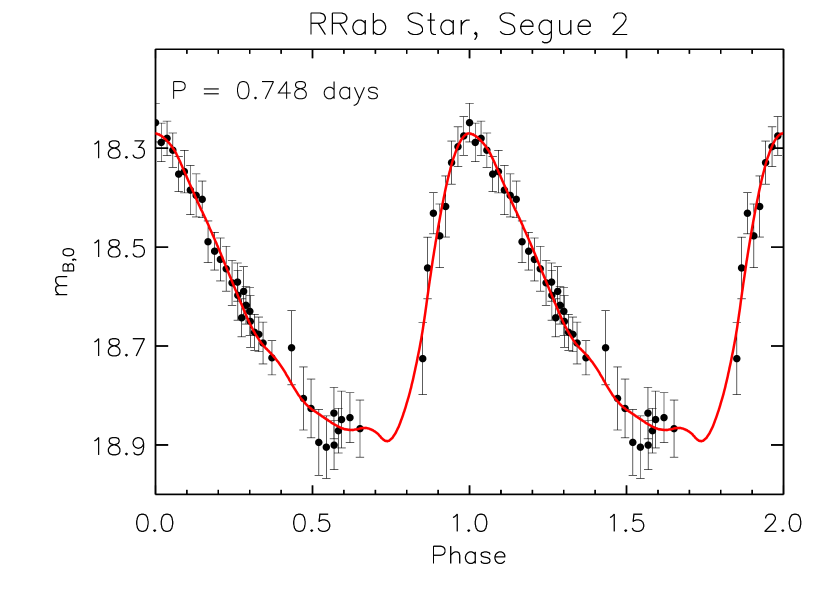
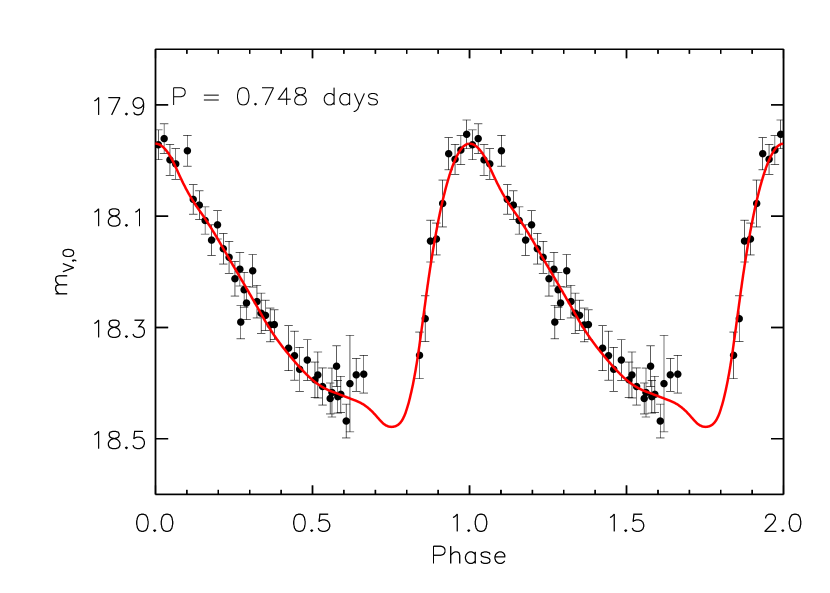
Figure 2 shows the variable’s period folded , , and light curves, with the best fit template overploted. By integrating the set of light curve templates consistent with the observed light curve at a 68% confidence level or better, we calculate a flux-averaged band magnitude of mags and a flux-averaged band magnitude of mags. While using this approach provides a reasonable estimate of the uncertainty in and , the resulting uncertainty bars on the magnitudes are not themselves formal 68% confidence intervals. The star has a median color of and varies in color from to over the course of the pulsational period, displaying the increase in at minimum light that is characteristic of RRL stars (Smith, 1995).
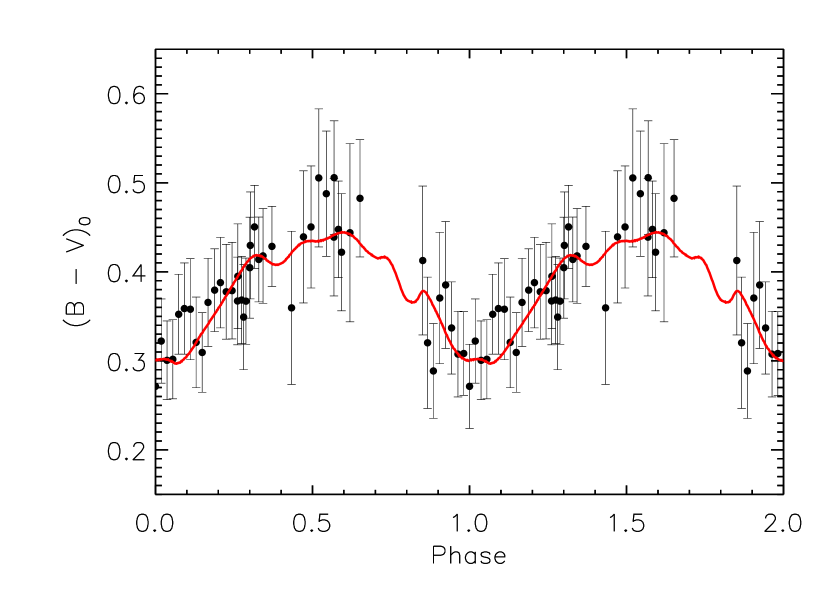
It should be noted that the point-to-point scatter in these light curves appears smaller than expected given the size of the error bars, which include both random and systematic uncertainties. This small point-to-point scatter suggests that the random uncertainties are overestimated by ALLSTAR II and/or the systematic uncertainties are highly correlated from exposure-to-exposure. The systematic uncertainties account for up to 50% of the error. Although the systematics are likely correlated, we chose to include them in the error bars because they are derived separately for each exposure and because they must be included in the error budget for the RRL’s distance estimate in §3.2.
3.1. Comparison with the RRL properties of other Milky Way dwarf galaxies
Here, we briefly discuss Segue 2’s RRL star in the context of the RRL populations of other Milky Way dwarf galaxy companions. Historically, RRab stars in the Milky Way’s halo, globular clusters, and dwarf galaxies have been classified according to their Oosterhoff properties (Oosterhoff, 1939). RRab stars with short periods and large amplitudes are classified as Oosterhoff I (OoI) stars, and those with longer periods and smaller amplitudes are deemed Oosterhoff II (OoII) stars. Milky Way globular clusters are known to show an Oosterhoff gap, or an absence of clusters with (days). However, Milky Way dwarf galaxies do not display this same dichotomy, and instead largely fall in the Oosterhoff intermediate to OoII classifications (see, e.g., Catelan 2009).
Among Galactic globular clusters, an OoII classification is associated with the most metal-poor systems ([Fe/H] ), with a weak negative correlation between the mean RRab period and metallicity (Catelan, 2009). For dwarf galaxies of the Milky Way, which are also metal-poor, a similar correlation between and also exists (see, e.g., Smith et al. 2009; Catelan 2009; Clementini 2010).
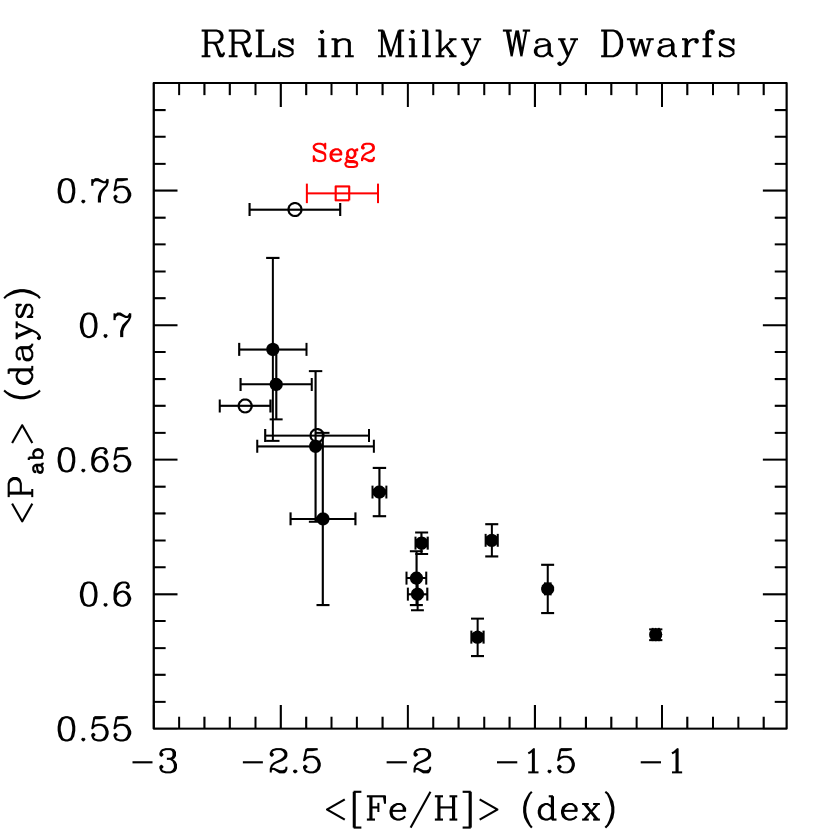
To place the Oosterhoff classification and long period of Segue 2’s RRab star in a more specific context, we revisit the relation between mean RRab period and mean metallicity for dwarf galaxies using homogeneously calculated values obtained with a method that remains robust for ultra-faint systems whose metallicity distributions may be poorly sampled. We use the uniformly calculated set of and associated uncertainties found by Willman & Strader (2012) by applying a Bayesian MCMC technique to published [Fe/H] measurements based on iron lines and their accompanying uncertainties. A similar technique was applied to re-calculate and associated uncertainties from the most current surveys of variable stars in ultra-faint dwarfs.
In Figure 3, we compare Segue 2’s RRab period and mean metallicity with those of other Milky Way dwarf galaxies with predominantly old stellar populations. The long period ( days) and the amplitude ( mag) of Segue 2’s RRab star as well as the dwarf galaxy’s mean metallicity () are consistent with an OoII classification (see, e.g., Kunder et al. 2011). The periods of the single RRL star in each of Segue 2 and CVn II are longer than the (mean) RRab period of any other dwarf galaxy. However, the period of the RRab star in Segue 2 and the mean metallicity of the dwarf galaxy are consistent with the strong anti-correlation between and observed in dwarfs given the significant spread in confirmed by Kirby et al. (2013).
We can also compare the RRL populations of Milky Way dwarf galaxy companions using the RRL specific frequency , or the number of RRL stars per system normalized to a system absolute magnitude of :
| (5) |
Given its one RRL star and an absolute magnitude (Belokurov et al., 2009), Segue 2 has an RRL specific frequency . Using the absolute magnitudes provided in Sand et al. (2012), we find that this is greater than the specific frequency of any other Milky Way dwarf galaxy companion considered in Table 4. These objects have values that range from (Leo I) to (ComBer). Of the known dwarf companions, only Segue 1 (), which is known to have at least one RRL star (Simon et al., 2011), appears to have a higher RRL specific frequency. It is necessary to note that as the completeness of the RRL surveys in these objects is not guaranteed, the specific frequencies of these objects are lower limits. Nevertheless, it is interesting to observe that Segue 2 may have a high specific frequency compared to most other dwarf galaxy companions in which RRL stars have been discovered.
3.2. Distance to Segue 2
We calculate the distance to Segue 2 using both its newly identified RRL star and its blue horizontal branch (BHB) stars (with the technique described in §3 of Sand et al. 2012). As described in §2.3, we used the Schlafly & Finkbeiner (2011) reddening coefficients rather than the SFD98 coefficients for the photometry used to calculate these distances. For both the RRL and the BHB technique, the updated coefficients make the inferred distance to Segue 2 several percent larger than it would have been with the SFD98 coefficients.
Using either the RRL star or BHB stars to calculate the distance to Segue 2 requires knowledge of the stars’ metallicities. Using the individual metallicities of member stars from Kirby et al. (2013), we calculate a mean metallicity of (as described in §3.1). The BHB [Fe/H] value estimated by Belokurov et al. (2009) is consistent with this value. Using the three BHB members and , we find a distance to Segue 2 of kpc.
To calculate the RRL distance, we first estimate the metallicity of the RRL star using each of the following relationships between RRab metallicity, period, and band amplitude:
| (6) |
| (7) |
The former relation, from Alcock et al. (2000), and the latter, from Sarajedini et al. (2006), have estimated uncertainties of approximately 0.31 and 0.45 dex, respectively. Using days and mag, we find values of and dex.
Chaboyer (1999) gives the following relationship between absolute band magnitude and metallicity for RRL stars:
| (8) |
Thus, we derive absolute magnitudes for the RRab star of and for metallicities of and , respectively. Therefore, we find a distance to the RRab star of kpc and kpc. All of our distance measurements individually have 8% uncertainty and are consistent with literature values (see Belokurov et al. 2009 and Ripepi et al. 2012).
The distances to Segue 2 determined using both the RRL and BHB stars are consistent between the two techniques within one standard deviation. Note that this error budget does not include uncertainty in the metallicity of the RRL and BHB stars, nor the uncertainty in the absolute value of at the location of the RRL star. If the reddening uncertainty is similar to the variation in SFD98 reddening across the face of Segue 2, this uncertainty may affect the inferred distance modulus by a couple hundredths of a magnitude (and thus the distance by 1%).
4. A Candidate Eclipsing Binary in the Segue 3 Field
In the Segue 3 field, one periodic variable star was discovered at (RA, Dec) = (, ) at a distance of 17 half-light radii from the center of the object. The variable has a mean band magnitude of mags, a mean band magnitude of mags, and a mean color of . The star has a likely period of days determined from a Lomb-Scargle periodogram. As shown in Figure 4, although the variable’s apparent brightness is consistent with the horizontal branch of Segue 3, the star’s color is more than 0.1 mag redder in than expected for an RRL star. Additionally, its light curves are not well fit by the RRc templates provided by Sesar et al. (2010). The variable’s , , and light curves are shown in Figure 5.
The light curves of RRc stars and eclipsing binary star systems may appear deceptively similar in period, amplitude, and shape (Kinman & Brown, 2010). However, while RRL stars vary in over the course of a pulsational period due to changes in effective temperature, an eclipsing binary system does not show significant variation in (see, e.g., Figures 4-6 of Kinman & Brown 2010). As shown in Figure 5, the variable star does not show clear variation in as a function of phase, suggesting that this variable may be an eclipsing binary.


| Segue 2 Variable | Segue 3 Variable | |
|---|---|---|
| R.A. (J2000) | ||
| Decl. | ||
| 18.25 | 16.86 0.01 | |
| 0.38 0.012 | 0.55 0.004 | |
| Amplitude () | 0.62 | 0.45 |
| Amplitude () | 0.51 | 0.45 |
| Period (Days) | 0.748 | 0.167 |
| 0.220 | 0.102 | |
| Classification | RRab | candidate eclipsing binary |
5. Conclusions
We have used multi-band time-series photometry obtained at the WIYN 0.9 meter telescope at KPNO to conduct a complete search for RRL stars in Segue 2 and Segue 3. We have discovered an RRL star with properties consistent with a fundamental mode RRL (RRab) star in Segue 2, and a candidate eclipsing binary in the Segue 3 field. We derive the first robust distance to Segue 2 using both its RRL star and spectroscopically confirmed BHB stars. The latter method yields a distance of kpc (for ), while the former method gives distances of kpc and kpc for and , respectively. These distances are consistent with one another to within one standard deviation. Future spectroscopic measurements of the RRab and the BHB stars’ [Fe/H] will facilitate an even more robust measurement of the distance to Segue 2.
We revisit the known anti-correlation between and for RRL in Milky Way dwarf galaxies, using a uniformly calculated set of and . Placing the 0.748 day period of the Segue 2 RRab star in this context, we find that the RRab period and mean metallicity of Segue 2 are consistent with the established trend given the significant spread in metallicity in Segue 2 demonstrated by Kirby et al. (2013). The tightness of the observed inverse correlation between and in dwarf galaxies is worthy of careful, continued study as more RRL are found in these objects. This relation may ultimately yield an interesting avenue for inference of the chemical properties of diffuse streams and distant ultra-faint dwarfs in the era of time domain surveys such as LSST.
References
- Abazajian et al. (2009) Abazajian, K. N., Adelman-McCarthy, J. K., Agüeros, M. A., et al. 2009, ApJS, 182, 543
- Alcock et al. (2000) Alcock, C., Allsman, R. A., Alves, D. R., et al. 2000, AJ, 119, 2194
- Belokurov et al. (2006) Belokurov, V., Zucker, D. B., Evans, N. W., et al. 2006, ApJ, 647, L111
- Belokurov et al. (2007) —. 2007, ApJ, 654, 897
- Belokurov et al. (2008) Belokurov, V., Walker, M. G., Evans, N. W., et al. 2008, ApJ, 686, L83
- Belokurov et al. (2009) —. 2009, MNRAS, 397, 1748
- Belokurov et al. (2010) —. 2010, ApJ, 712, L103
- Bersier & Wood (2002) Bersier, D., & Wood, P. R. 2002, AJ, 123, 840
- Bonanos et al. (2004) Bonanos, A. Z., Stanek, K. Z., Szentgyorgyi, A. H., Sasselov, D. D., & Bakos, G. Á. 2004, AJ, 127, 861
- Cacciari & Clementini (2003) Cacciari, C., & Clementini, G. 2003, in Lecture Notes in Physics, Berlin Springer Verlag, Vol. 635, Stellar Candles for the Extragalactic Distance Scale, ed. D. Alloin & W. Gieren, 105–122
- Catelan (2009) Catelan, M. 2009, Ap&SS, 320, 261
- Chaboyer (1999) Chaboyer, B. 1999, Post-Hipparcos Cosmic Candles, 237, 111
- Clement et al. (2001) Clement, C. M., Muzzin, A., Dufton, Q., et al. 2001, AJ, 122, 2587
- Clementini (2010) Clementini, G. 2010, in Variable Stars, the Galactic halo and Galaxy Formation, ed. C. Sterken, N. Samus, & L. Szabados, 107
- Dall’Ora et al. (2006) Dall’Ora, M., Clementini, G., Kinemuchi, K., et al. 2006, ApJ, 653, L109
- Dall’Ora et al. (2012) Dall’Ora, M., Kinemuchi, K., Ripepi, V., et al. 2012, ApJ, 752, 42
- Fadely et al. (2011) Fadely, R., Willman, B., Geha, M., et al. 2011, AJ, 142, 88
- Foreman-Mackey et al. (2012) Foreman-Mackey, D., Hogg, D. W., Lang, D., & Goodman, J. 2012, ArXiv e-prints
- Garofalo et al. (2013) Garofalo, A., Cusano, F., Clementini, G., et al. 2013, ApJ, 767, 62
- Greco et al. (2008) Greco, C., Dall’Ora, M., Clementini, G., et al. 2008, ApJ, 675, L73
- Held et al. (2001) Held, E. V., Clementini, G., Rizzi, L., et al. 2001, ApJ, 562, L39
- Jordi et al. (2006) Jordi, K., Grebel, E. K., & Ammon, K. 2006, A&A, 460, 339
- Kaluzny et al. (1995) Kaluzny, J., Kubiak, M., Szymanski, M., et al. 1995, A&AS, 112, 407
- Kinman & Brown (2010) Kinman, T. D., & Brown, W. R. 2010, AJ, 139, 2014
- Kirby et al. (2013) Kirby, E. N., Boylan-Kolchin, M., Cohen, J. G., et al. 2013, ArXiv e-prints
- Kirby et al. (2008) Kirby, E. N., Simon, J. D., Geha, M., Guhathakurta, P., & Frebel, A. 2008, ApJ, 685, L43
- Kirby et al. (2010) Kirby, E. N., Guhathakurta, P., Simon, J. D., et al. 2010, ApJS, 191, 352
- Koposov et al. (2007) Koposov, S., de Jong, J. T. A., Belokurov, V., et al. 2007, ApJ, 669, 337
- Koposov et al. (2011) Koposov, S. E., Gilmore, G., Walker, M. G., et al. 2011, ApJ, 736, 146
- Kuehn et al. (2008) Kuehn, C., Kinemuchi, K., Ripepi, V., et al. 2008, ApJ, 674, L81
- Kunder et al. (2011) Kunder, A., Walker, A., Stetson, P. B., et al. 2011, AJ, 141, 15
- Mateo et al. (1995) Mateo, M., Fischer, P., & Krzeminski, W. 1995, AJ, 110, 2166
- Miceli et al. (2008) Miceli, A., Rest, A., Stubbs, C. W., et al. 2008, ApJ, 678, 865
- Moretti et al. (2009) Moretti, M. I., Dall’Ora, M., Ripepi, V., et al. 2009, ApJ, 699, L125
- Muñoz et al. (2012) Muñoz, R. R., Geha, M., Côté, P., et al. 2012, ApJ, 753, L15
- Musella et al. (2009) Musella, I., Ripepi, V., Clementini, G., et al. 2009, ApJ, 695, L83
- Musella et al. (2012) Musella, I., Ripepi, V., Marconi, M., et al. 2012, ArXiv e-prints
- Nemec et al. (1988) Nemec, J. M., Wehlau, A., & Mendes de Oliveira, C. 1988, AJ, 96, 528
- Norris et al. (2010) Norris, J. E., Wyse, R. F. G., Gilmore, G., et al. 2010, ApJ, 723, 1632
- Oosterhoff (1939) Oosterhoff, P. T. 1939, The Observatory, 62, 104
- Ripepi et al. (2012) Ripepi, V., Mancini, D., Cortecchia, F., et al. 2012, Memorie della Societa Astronomica Italiana Supplementi, 19, 152
- Sand et al. (2012) Sand, D. J., Strader, J., Willman, B., et al. 2012, ApJ, 756, 79
- Sarajedini et al. (2006) Sarajedini, A., Barker, M. K., Geisler, D., Harding, P., & Schommer, R. 2006, AJ, 132, 1361
- Schlafly & Finkbeiner (2011) Schlafly, E. F., & Finkbeiner, D. P. 2011, ApJ, 737, 103
- Schlegel et al. (1998) Schlegel, D. J., Finkbeiner, D. P., & Davis, M. 1998, ApJ, 500, 525
- Sesar et al. (2007) Sesar, B., Ivezić, Ž., Lupton, R. H., et al. 2007, AJ, 134, 2236
- Sesar et al. (2010) Sesar, B., Ivezić, Ž., Grammer, S. H., et al. 2010, ApJ, 708, 717
- Siegel (2006) Siegel, M. H. 2006, ApJ, 649, L83
- Siegel & Majewski (2000) Siegel, M. H., & Majewski, S. R. 2000, AJ, 120, 284
- Simon et al. (2011) Simon, J. D., Geha, M., Minor, Q. E., et al. 2011, ApJ, 733, 46
- Smith (1995) Smith, H. A. 1995, Cambridge Astrophysics Series, 27
- Smith et al. (2009) Smith, H. A., Catelan, M., & Clementini, G. 2009, in American Institute of Physics Conference Series, Vol. 1170, American Institute of Physics Conference Series, ed. J. A. Guzik & P. A. Bradley, 179–187
- Stetson (1987) Stetson, P. B. 1987, PASP, 99, 191
- Stetson (1994) —. 1994, PASP, 106, 250
- Vivas et al. (2004) Vivas, A. K., Zinn, R., Abad, C., et al. 2004, AJ, 127, 1158
- Walsh et al. (2007) Walsh, S. M., Jerjen, H., & Willman, B. 2007, ApJ, 662, L83
- Willman et al. (2011) Willman, B., Geha, M., Strader, J., et al. 2011, AJ, 142, 128
- Willman & Strader (2012) Willman, B., & Strader, J. 2012, AJ, 144, 76
- Willman et al. (2005a) Willman, B., Blanton, M. R., West, A. A., et al. 2005a, AJ, 129, 2692
- Willman et al. (2005b) Willman, B., Dalcanton, J. J., Martinez-Delgado, D., et al. 2005b, ApJ, 626, L85
- Wolf et al. (2010) Wolf, J., Martinez, G. D., Bullock, J. S., et al. 2010, MNRAS, 406, 1220
- Zucker et al. (2006a) Zucker, D. B., Belokurov, V., Evans, N. W., et al. 2006a, ApJ, 650, L41
- Zucker et al. (2006b) —. 2006b, ApJ, 643, L103
| Object | aaAs the cited RRL surveys are not necessarily complete for the more luminous dwarfs, the number of RRab stars cited as belonging to these dwarfs may be underestimated. Additionally, RRab stars with abnormal or uncertain classifications were not included in the total count. | ref | ref | ||||
|---|---|---|---|---|---|---|---|
| Cvn I | 18 | -1.962 | 0.038 | 0.600 | 0.006 | Kuehn et al. (2008) | WS12, K10 |
| Herc | 6 | -2.518 | 0.140 | 0.678 | 0.013 | Musella et al. (2012) | WS12, K08 |
| For | 396 | -1.025 | 0.012 | 0.585 | 0.002 | Bersier & Wood (2002) | WS12, K10 |
| Dra | 123 | -1.946 | 0.024 | 0.619 | 0.004 | Bonanos et al. (2004) | WS12, K10 |
| Leo IV | 3 | -2.363 | 0.230 | 0.655 | 0.028 | Moretti et al. (2009) | WS12, K08 |
| Sex | 26 | -1.966 | 0.039 | 0.606 | 0.010 | Mateo et al. (1995) | WS12, K10 |
| Leo I | 47 | -1.450 | 0.011 | 0.602 | 0.009 | Held et al. (2001) | WS12, K10 |
| Leo II | 103 | -1.670 | 0.024 | 0.620 | 0.006 | Siegel & Majewski (2000) | WS12, K10 |
| UMi | 47 | -2.112 | 0.027 | 0.638 | 0.009 | Nemec et al. (1988) | WS12, K10 |
| Scl | 129 | -1.726 | 0.024 | 0.584 | 0.007 | Kaluzny et al. (1995) | WS12, K10 |
| Boo I | 7 | -2.531 | 0.132 | 0.691 | 0.034 | Siegel (2006) | Norris et al. (2010) |
| ComBer | 1 | -2.640 | 0.100 | 0.670 | Musella et al. (2009) | WS12, K08 | |
| Cvn II | 1 | -2.444 | 0.178 | 0.743 | Greco et al. (2008) | WS12, K08 | |
| UMa I | 5 | -2.334 | 0.128 | 0.628 | 0.032 | Garofalo et al. (2013) | WS12, K08 |
| UMa II | 1 | -2.357 | 0.204 | 0.659 | Dall’Ora et al. (2012) | WS12, K08 | |
| Seg2 | 1 | -2.257 | 0.140 | 0.748 | present work | Kirby et al. (2013)bbThe mean metallicity of Segue 2 was calculated using the technique described in Willman & Strader (2012) from the individual metallicities published in Kirby et al. (2013). |