Predicting genome-wide DNA methylation using methylation marks, genomic position, and DNA regulatory elements
Abstract
Background
Recent assays for individual-specific genome-wide DNA methylation profiles have enabled epigenome-wide association studies to identify specific CpG sites associated with a phenotype. Computational prediction of CpG site-specific methylation levels is important, but current approaches tackle average methylation within a genomic locus and are often limited to specific genomic regions.
Results
We characterize genome-wide DNA methylation patterns, and show that correlation among CpG sites decays rapidly, making predictions solely based on neighboring sites challenging. We built a random forest classifier to predict CpG site methylation levels using as features neighboring CpG site methylation levels and genomic distance, and co-localization with coding regions, CGIs, and regulatory elements from the ENCODE project, among others. Our approach achieves prediction accuracy of genome-wide methylation levels at single CpG site precision. The accuracy increases to when restricted to CpG sites within CGIs. Our classifier outperforms state-of-the-art methylation classifiers and identifies features that contribute to prediction accuracy: neighboring CpG site methylation status, CpG island status, co-localized DNase I hypersensitive sites, and specific transcription factor binding sites were found to be most predictive of methylation levels.
Conclusions
Our observations of DNA methylation patterns led us to develop a classifier to predict site-specific methylation levels that achieves the best DNA methylation predictive accuracy to date. Furthermore, our method identified genomic features that interact with DNA methylation, elucidating mechanisms involved in DNA methylation modification and regulation, and linking different epigenetic processes.
Keywords
DNA methylation, CpG island, shore, and shelf, random forest classifier, DNase I hypersensitive sites, transcription factor binding sites, EWAS
Background
Epigenetics is the study of changes in gene expression or complex phenotype that are not associated with changes in DNA sequence and but inherited through cell division. Epigenetic markers often change within an individual over time and are cell type specific [1, 2, 3]. Epigenetics has been shown to play a critical role in cell differentiation, development, and tumorigenesis [4, 5]. DNA methylation is probably the best studied epigenetic modification of DNA, but our understanding of DNA methylation is still in its infancy. In vertebrates, DNA methylation occurs by adding a methyl group to the fifth carbon of the cytosine residue, mainly in the context of neighboring cytosine and guanine nucleotides in the genome (5-CG-3 dinucleotides or CpG sites) mediated by DNA methyl-transferases (DNMTs) [6, 7]. DNA methylation has been shown to play an important functional role in the cell, including involvement in DNA replication and gene transcription, with substantial downstream association with development, aging, and cancer [1, 8, 9, 10, 2, 3].
CpG sites are underrepresented in the human genome relative to their expected frequency as a result of being a mutation hotspot, where the deamination of methylated cytosines often changes CpG sites into TpG sites [5, 11]. Although CpG sites are mainly methylated across the mammalian genome [12], there are distinct, mostly unmethylated CG-rich regions termed CpG islands (CGIs) that have a G+C content greater than [5, 11, 13]. CGIs account for of the genome and are often located in promoters and exonic regions in mammalian genomes [14, 15]. Methylation patterns in CGIs that are in promoter regions, where most previous studies have focused attention, have recently been shown to differ from methylation patterns elsewhere, indicating a specific biological role for these promoter CGIs [12]. CGIs have been shown to co-localize with DNA regulatory elements such as transcription factor binding sites (TFBSs) [16, 17, 18, 19, 20, 21, 22, 23] and DNA binding insulator proteins, such as CTCF, which protect downstream DNA from upstream methylation activities [24]. Across the genome, DNA methylation levels have been shown to be associated with gene regions, active chromatin marks [25, 26, 27], cis-acting DNA regulatory elements, and proximal sequence elements [14, 28], giving hints about the processes that regulate methylation and how methylation may in turn impact cellular phenotypes.
The non-uniform distribution of CpG sites across the human genome and the important role of methylation in cellular processes imply that characterizing genome-wide DNA methylation patterns is necessary to better understand the regulatory mechanisms of this epigenetic phenomenon [29]. Recent advances in methylation-specific microarray and sequencing technologies have enabled the assay of DNA methylation patterns genome-wide and at single base-pair resolution [29]. The current gold standard to quantify single site DNA methylation levels across an individual’s genome is whole genome bisulfite sequencing (WGBS), which quantifies DNA methylation levels at million (out of million total) CpG sites in the human genome [30, 31, 32]. However, WGBS is prohibitively expensive for most current studies, is subject to conversion bias, and is difficult to perform in particular genomic regions [29]. Other sequencing methods include methylated DNA immunoprecipitation (MeDIP) sequencing, which is experimentally difficult and expensive, and reduced representation bisulfite sequencing (RRBS), which assays CpG sites in small regions of the genome [29]. As an alternative, methylation microarrays, and the Illumina HumanMethylation 450K Beadchip in particular, measure bisulphite treated DNA methylation levels at preselected CpG sites genome-wide [33]; however, these arrays assay less than of CpG sites, and this percentage is biased to gene regions and CGIs. Quantitative methods are needed to predict methylation status at unassayed sites and genomic regions.
In this study, we examined measurements of methylation levels in individuals using the Illumina 450K Beadchip [34]. Within these methylation profiles, we examined the patterns and correlation structure of the CpG sites, with attention to characterizing methylation patterns in CGI regions. Using features that included neighboring CpG site methylation status, genomic location, local genomic features, and co-localized regulatory elements, we developed a random forest classifier to predict single CpG site methylation levels. Using this model, we were able to identify DNA regulatory elements that may interact with DNA methylation at specific CpG sites, providing hypotheses for experimental studies on mechanisms by which methylation is regulated or leads to biological changes or disease phenotypes.
Related work in DNA methylation prediction
Methylation status is a delicate epigenomic feature to characterize, and even more challenging to predict, because assayed DNA methylation marks are (a) an average across the sampled cells, (b) cell type specific, (c) environmentally unstable, and (d) not well-correlated within a genomic locus [2, 35, 36]. It is not clear whether either predicted or measured methylation status at specific CpG sites generalize well across platforms, cell types, individuals, or genomic regions [37]. A number of methods to predict methylation status have been developed (Table S1). Most of these methods assume that methylation status is encoded as a binary variable, e.g., a CpG site is either methylated or unmethylated in an individual [38, 39, 28, 40, 41, 42, 43, 44]. These methods have often limited predictions to specific regions of the genome, such as CGIs [39, 41, 40, 42, 45, 44]. More broadly, all of these methods make predictions of average methylation status for windows of the genome instead of individual CpG sites. Our model is an attempt to develop a general method for predicting methylation levels at individual CpG sites by removing the simplifying assumptions of current methods without sacrificing prediction accuracy.
The relative success of these methods depends heavily on the prediction objectives. All of the studies that achieved prediction accuracy [39, 42, 45, 44] predicted average methylation status within CGIs or DNA fragments within CGIs. Most of the CpG sites in CGIs are unmethylated across the genome [12] – for example, of CpG sites in CGIs in cells from human brain were found to be methylated using a WGBS approach [46] – so it is not surprising that classifiers limited to these regions perform well. Studies not limiting prediction to CGIs uniformly achieved lower accuracies, ranging from to . Many of these methods predicted binary methylation status; one study used categorical methylation status [45]. Another study predicted average methylation levels as a continuous variable [47], and the predictions achieved a maximum correlation coefficient of and a root mean square error (RMSE) of ; however, the study was limited to DNA fragments instead of a genome-wide analysis.
Across these methods, features that are used for DNA methylation prediction include: DNA composition (proximal DNA sequence patterns), predicted DNA structure (e.g., co-localized introns), repeat elements, TFBSs, evolutionary conservation (e.g., PhastCons [48]), number of SNPs, GC content, Alu elements, histone modification marks, and functional annotations of nearby genes. Several studies only using DNA composition features achieved prediction accuracies ranging from to [38, 28, 41, 43, 47]. Bock et al. used features including DNA composition, DNA structure, repeat elements, TFBSs, evolutionary conservation, and number of SNPs; Zheng et al. included features including DNA composition, DNA structure, TFBSs, histone modification marks, and functional annotations of nearby genes. Two studies did not use any DNA composition features [42, 45]. The relative contribution of each feature to prediction quality is not quantified well across these studies because of the different methods and prediction objectives.
The majority of these methods are based on support vector machine (SVM) classifiers [38, 39, 28, 40, 42, 45, 47, 44]. General non-additive interactions between features are not encoded when using linear kernels, as most of these SVM-based classifiers used. If a more sophisticated kernel is used, such as a radial basis function kernel (RBF), within the SVM-based approach, the contribution of each feature to the prediction quality is not readily available. Three studies included alternative classification frameworks: one found that a decision tree classifier achieved better performance than an SVM-based classifier [45]. Another study found that a naive Bayes classifier achieved the best prediction performance [41]. A third study used a word composition-based encoding method [43]. In our study, we choose to use a random forest classifier because it encodes non-additive interactions between features and because the relative contribution of each feature to prediction quality is quantifiable.
Our method for predicting DNA methylation levels at CpG sites genome-wide differs from these current state-of-the-art classifiers in that it: (a) uses a genome-wide approach, (b) makes predictions at single CpG site resolution, (c) is based on a random forest classifier, (d) predicts methylation levels instead of methylation status, (e) incorporates a diverse set of predictive features, including regulatory marks from the ENCODE project, and (f) allows the quantification of the contribution of each feature to prediction. We find that these differences substantially improve the performance of the classifier and also provide testable biological insights into how methylation regulates, or is regulated by, specific genomic and epigenomic processes.
Results
Characterizing methylation patterns
DNA methylation profiles were measured in whole blood samples from unrelated individuals by Illumina HumanMethylation 450K Beadchips at single CpG site resolution for CpG sites [49]. Single CpG site methylation levels are quantified by , the ratio of the methylated probe intensity and the sum of the methylated and unmethylated probe intensities, which ranges from 0 (unmethylated) to 1 (methylated). Within the single-site values across individuals, we controlled for probe chip position, sample age, and sample sex. After these data were preprocessed (see Materials and Methods), CpG sites remained across the autosomal chromosomes.
First we examined the distribution of DNA methylation levels, , at CpG sites on autosomal chromosomes across all individuals (Figure 1A). The majority of CpG sites were either hypermethylated or hypomethylated, with of sites with and of sites with . Using a cutoff of , across the methylation profiles and individuals, of these CpG sites have a methylated status (). Across the individuals, we observed distinct patterns of DNA methylation levels in different genomic regions (Figure 1B). Using CGIs labeled in the UCSC genome browser [50], we defined CGI shores as regions kb away from CGIs in both directions and CGI shelves as regions kb away from CGIs in both directions [34]. We found that CpG sites in CGIs were hypomethylated ( of sites with ) and sites in non-CGIs were hypermethylated ( of sites with ), while CpG sites in CGI shore regions had variable methylation levels following a U-shape distribution ( of sites with and of sites with ), and CpG sites in CGI shelf regions were hypermethylated ( of sites with ). These distinct patterns reflect highly context-specific DNA methylation levels genome-wide.
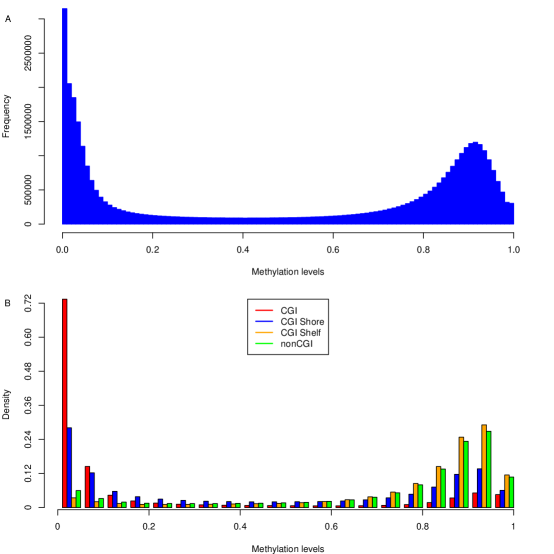
DNA methylation levels at nearby CpG sites have previously been found to be correlated (indicating possible co-methylation), particularly when CpG sites are within kb from each other [35, 36]; these patterns are in contrast with the correlation among nearby genotypes due to linkage disequilibrium (LD) that often extends to large genomic regions from a few kilobases to Mb [51]. We quantified the correlation of methylation levels () between neighboring pairs of CpG sites using the absolute value Pearson’s correlation across individuals. We found that correlation of methylation levels between neighboring (or adjacent on the array) CpG sites decreased rapidly to approximately within bp, in contrast to sharp decays noted within kb in previous studies with sparser CpG coverage (Figure 2A) [35, 36]. We found the rate of decay in correlation to be highly dependent on genomic context; for example, for neighboring CpG sites in the same CGI shore and shelf region, correlation decreases continuously until it is well below what is expected (Figure 2A). Because of the over-representation of CpG sites near CGIs on the array, an increase in correlation can be observed as neighboring sites extend past the CGI shelf regions, where there is lower correlation with CGI methylation levels than we observe in the background.
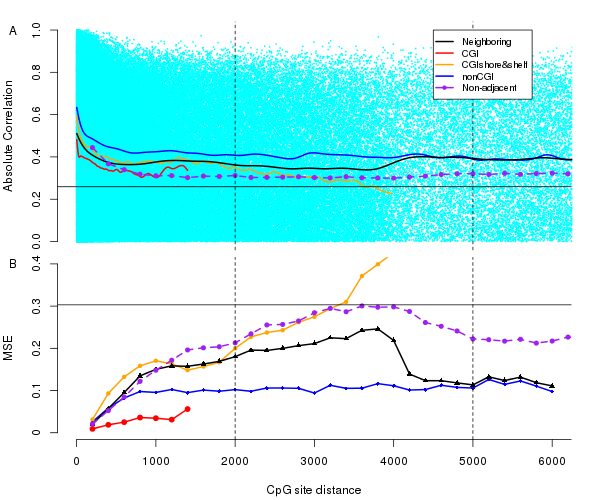
To make this decay more precise, we contrasted the observed decay to the level of background correlation (), which is the average absolute value correlation between the methylation levels of pairs of randomly selected CpG sites across chromosomes (Figure 2A, Figure 3). We found substantial differences in correlation between neighboring CpG sites versus arbitrary pairs of CpG sites at identical distances, presumably because of the dense CpG tiling on the 450K array within CGI regions. Interestingly, the slope of the correlation decay plateaus after the CpG sites are approximately bp apart (both for neighbors and for arbitrary pairs of a specified distance), but the distribution of correlation between pairs of CpG sites is not substantially different from the distribution of background correlation even within Kb (Figure S1A). While this certainly suggests that there are may be patterns of methylation that extend to large genomic regions, the pattern of extreme decay within approximately bp across the genome indicates that, in general, methylation may be biologically manipulated within very small genomic regions. Thus, neighboring CpG sites may only be useful for prediction when the sites are sampled at sufficiently high densities across the genome.

We repeated these experiments using mean squared error (MSE) between CpG site levels to quantify patterns of decay of methylation within each individual, instead of across individuals as is measured with the correlation analyses (see Materials and Methods; Figure 2B, Figure 3). In general, the MSE trends echo the local patterns seen in the correlation analysis and also appear to be region specific. In CGI regions, the MSE of neighboring sites was low and increased slowly with genomic distance. In contrast, MSE in CGI shore and shelf regions increased rapidly to an MSE higher than background MSE (), indicating that the edges of a single shore and shelf region are less predictive of each other than any two CpG sites at random. The individual-specific MSE between neighboring sites (Figure S1B) shows a much higher deviation from background distribution of MSE at kb relative to correlation, indicating that the biological manipulation of methylation in larger genomic regions may be individual specific, such as being driven by genetic variants or environmental effects.
As we observed that methylation patterns at neighboring CpG sites depended heavily on genomic content, we further investigated methylation patterns within CGIs, CGI shores, and CGI shelves. Methylation levels at CGIs and CGI shelves were fairly constant genome-wide and across individuals – CGIs are hypomethylated and CGI shelves are hypermethylated – but CGI shores exhibit a reproducible but drastic pattern of change (Figure 4A). CpG sites in CGI shores have a monotone increasing pattern of methylation status from CGIs towards CGI shelves, and this pattern is symmetric in the CGI shores upstream and downstream of CGIs. If we examine the MSE between pairs of CpG sites’ methylation status in these regions, we find that MSE within the CGI and within the CGI shelves is low, consistent with the variance we observed within DNA methylation profiles in these regions (Figure 4B). Additionally, we find that the MSE between the CpG sites in the shelves appears to increase as the sites are further away from the CGI on the shelf, suggesting a circular dependency in methylation status between the ends of the shelf sequences. It is interesting that the CpG sites in the shore regions appear substantially more predictive of CpG sites in the shelf regions than those in the CGI regions, although this may indicate a less precise delineation of the shore and shelf regions relative to the CGI and CGI shore delineation.

To quantify the amount of variation in DNA methylation explained by genomic context, we considered the correlation between genomic context and principle components (PCs) of methylation levels across all individuals (Figure 5). We found that many of the features derived from the CpG site’s genomic context appear to be correlated with the first principal component (PC1). Methylation statuses of upstream and downstream neighboring CpG sites and a co-localized DNAse I hypersensitive (DHS) site are the most highly correlated features, both with Pearson’s correlation around (Figures 5). Ten genomic features all have correlation with PC1, including co-localized active TFBSs Elf1 (ETS-related transcription factor 1), MAZ (Myc-associated zinc finger protein), Mxi1 (MAX-interacting protein 1) and Runx3 (Runt-related transcription factor 3), suggesting that they may be useful in predicting DNA methylation status (Figure S2). That said, the features themselves are well correlated; for example, active TFBS are highly enriched within DHS sites (correlation ) [52, 53].

Binary methylation status prediction
These observations about patterns of DNA methylation suggest that correlation in DNA methylation is local and dependent on genomic context. Thus, prediction of DNA methylation status based only on methylation levels at neighboring CpG sites may not perform well, especially in sparsely assayed regions of the genome. Using prediction features including neighboring CpG site methylation levels and a number of features characterizing genomic context, we built a classifier to predict DNA methylation status, where status indicates no methylation (0) or complete methylation (1) at a CpG site. There were sites with neighboring CpG sites at arbitrary distances used in these analysis per individual.
The features that we used for DNA methylation status prediction fall into four different classes (Table S4):
-
•
neighbors: one upstream and one downstream neighboring (CpG sites assayed on the array and adjacent in the genome) CpG sites’ genomic distances, binary methylation status, and values,
-
•
genomic position: binary values indicating co-localization with DNA sequence annotations, including promoters, gene body, intergenic region, CGIs, CGI shores and shelves, and SNPs (in site probes);
- •
-
•
CREs: binary values indicating co-localization with cis-regulatory elements (CREs), including DHS sites (assayed in the GM12878 cell line, the closest match to whole blood) and specific TFBSs (assayed in the GM12878 cell line) [55].
We used a random forest (RF), which is an ensemble classifier that builds a collection of decision trees and combines the predictions across all of the trees to create a single prediction. The output from the random forest is the proportion of trees in the fitted forest that classify the test sample as a 1. We threshold this output, , to using a cutoff of to find the predicted methylation status. We quantified generalization error for each feature set using a modified version of repeated random subsampling, where the training and test sets are within the same individual (see Materials and Methods). We used prediction accuracy, specificity, sensitivity, and area under the Receiver Operating Characteristic (ROC) curve (AUC) to evaluate our predictions (see Materials and Methods).
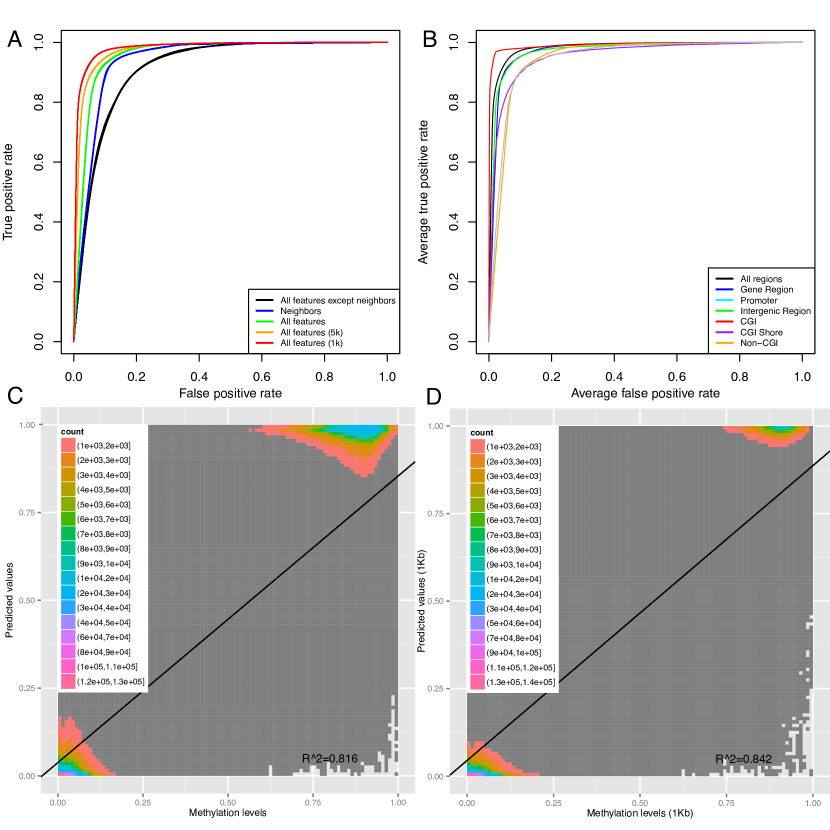
Using all features and not restricting neighboring site distance, we achieved an accuracy of and an AUC of . We considered the role of each subset of features (Table 1). For example, if we only include genomic position features, the classifier had an accuracy of and AUC of . When we included all classes of features except for neighbors, the classifier achieved an accuracy of and an AUC of , supporting substantial improvement in prediction from considering the methylation status of neighboring CpG sites (t-test ). However, we also found that the additional features improve prediction substantially over just using the neighbors features, which has an accuracy of and an AUC of (t-test ).
Feature set Features Distance Accuracy (%) AUC Specificity (%) Sensitivity (%) MCC Gene_pos 9 Arbitrary 78.6 0.84 72.6 83.5 0.57 Gene_pos + seq_property 13 Arbitrary 79.4 0.86 71.8 85.6 0.58 Gene_pos + seq_property + CREs 93 Arbitrary 85.7 0.92 78.2 91.8 0.71 Neighbor CpG methylation status and distance 4 Arbitrary 90.7 0.94 87.1 93.7 0.81 5 kb 91.7 0.96 93.7 89.1 0.83 1 kb 94.0 0.97 96.6 88.4 0.86 All features 97 Arbitrary 91.6 0.96 87.9 94.6 0.83 5 kb 92.5 0.97 92.8 92.1 0.85 1 kb 94.3 0.98 96.0 90.8 0.87
Because the correlation between neighboring CpG sites’ methylation levels decays rapidly with distance, we considered restricting the window size for neighboring CpG sites to kb, kb, and arbitrary distances on the same chromosome: predictions at CpG sites where one or both of the neighboring CpG sites were greater than this distance were excluded. There were sites () with both upstream and downstream neighboring CpG sites within kb and sites () with both neighboring sites within kb. We found that when we restricted prediction to kb and kb windows, the classifier using only the neighbors features had accuracies of and , and AUCs of and , respectively (Table 1). This result is consistent with the high correlation of neighboring CpG sites within kb. When we used all of the prediction features and restricted neighboring CpG sites to kb, the classifier achieved accuracy and an AUC of . Interestingly, while prediction accuracy, AUC, and specificity all improved when restricting neighboring sites to shorter genomic windows, sensitivity, or , was increasingly worse, indicating that the statistical gain in restricting site distance is in eliminating type I errors (false positives) rather than in predicting a higher proportion of methylated sites correctly (true positives; Table 1).
To determine how predictive methylation profiles were across individuals, we quantified the generalization error of our classifier genome-wide across individuals. In particular, we trained our classifier on 10,000 sites from one individual, and predicted CpG sites from the other individuals for all feature sets. The classifier performance was highly consistent across genomic regions and individuals regardless of the subset of CpG sites in the training set (Figure 6A and Figure S3). We found that the AUC increased when restricting the distance of neighboring CpG sites, repeating earlier trends (t-test between arbitrary distances and kb: ).
To test the sensitivity of our classifier to the number of CpG sites in the training set, we investigated the prediction performance for different training set sizes. We found that training sets with greater than CpG sites had fairly similar performance (Figure S4). Throughout these experiments, we used a training set size of , in order to strike a balance between large numbers of training samples and computational tractability.
We compared the prediction performance of our random forest classifier with an SVM classifier with a radial basis function (RBF) kernel. We validated by using repeated random resampling, with the same training and test sets for both classifiers. SVM classifiers had an accuracy of including all features and neighbors at an arbitrary distance; the accuracy was when neighboring sites were restricted to kb window and when restricting to kb window (Table S5). We found that the random forest classifier had better prediction accuracy than the SVM classifier without restricting neighboring CpG site distance (; Table S5). When we restricted neighboring CpG sites to within kb, random forest and SVM classifiers had similar prediction performance.
Predicting genome-wide methylation levels
CpG methylation levels in a DNA sample represent the average methylation status across the cells in that sample and will vary continuously between 0 and 1 (Figure S5). Since the Illumina 450K array enables precise methylation levels at CpG site resolution in each sample, we used our classifier to predict methylation levels at single CpG site resolution. We compared the prediction probability () from our random forest classifier (without thresholding) with methylation levels () from the array, and validated this approach using repeated random subsampling to quantify generalization accuracy (see Materials and Methods). Using all features used in methylation status prediction, but modifying the neighbors neighboring CpG site methylation status values to be continuous methylation levels , we trained our random forest classifier and evaluated the correlation coefficient () and root-mean squared error (RMSE) between experimental and predicted methylation values (Table 2; Figure 6C and 6D). We found that the experimental and predicted methylation values had an , which increased to and when restricting neighboring CpG sites to within kb and kb, respectively. The RMSE between experimental and predicted methylation values for the unrestricted experiment was , decreasing to and for the kb and kb restrictions. The correlation coefficient and the RMSE indicate good recapitulation of experimental values using predicted methylation values.
| Distance | R | RMSE |
|---|---|---|
| Arbitrary | 0.9036 | 0.1936 |
| 5 kb | 0.9198 | 0.1702 |
| 1 kb | 0.9356 | 0.1466 |
Region specific methylation prediction
Studies of DNA methylation have focused on methylation within CGIs at promoter regions, restricting predictions to CGI regions [39, 40, 42, 45, 43, 47, 44]; we and others have shown DNA methylation has different patterns in different genomic regions [12]. Here we investigated regional DNA methylation prediction for our genome-wide CpG site methods, restricted to CpGs within gene coding regions and CGIs (Table S6).
For this experiment, prediction was performed on CpG sites with neighboring sites within kb distance because of the limited size of CGIs. We found, within CGI regions, predictions of methylation status using our method had an accuracy of and an AUC of . Methylation level prediction within CGIs achieved a correlation coefficient of and a RMSE of . As with the related work on prediction within CGI regions, we believe the improvement in accuracy is due to the limited variability in methylation patterns in these regions; indeed, of CpG sites in CGI regions have a (Table S6).
Conversely, prediction of CpG methylation status within CGI shores had an accuracy of . This lower accuracy is consistent with observations of robust and drastic change in methylation status across these regions [58, 59]. Prediction performance within various gene regions was fairly consistent, with accuracy for predictions of CpG sites in promoter regions, accuracy for predictions within gene body regions (exons and introns), and accuracy within intergenic regions (Figure 6B). This pattern may in part reflect the biased density of CpG sites on the Illumina 450K array.
Feature importance for methylation prediction
We evaluated the contributions of each feature to the overall prediction accuracy, as quantified by the Gini index. The Gini index measures the decrease in node impurity, or the relative entropy of the observed positive and negative examples before and after splitting the training samples on a single feature, of a given feature over all trees in the trained random forest. We computed the Gini index for each of the features from the fitted RF for predicting methylation status. We found that upstream and downstream neighboring CpG site methylation status are the most important features (Table S2, Figure 7A). When we restrict the neighboring CpG sites to be within kb or kb, the Gini score of the neighboring site status features increased in relation to the other features, echoing our observation that the non-neighbor feature sets are less useful when a CpG site’s neighbors are nearby, and thus more informative. In contrast, the Gini score of the genomic distance to the neighboring CpG site feature decreased when the neighboring site distance was restricted, suggesting that neighboring genomic distance an important feature to consider when some neighbors may be more distant and correspondingly less predictive. We found that DHS sites are strongly predictive of an unmethylated CpG site; the DHS site feature has the third most significant Gini index across these experiments. This observation is consistent with a previous study showing that CpG sites in DHS sites tend to be unmethylated [60]. CGI status is also an important feature, which is unsurprising given that most CpG sites in CGIs are unmethylated. GC content, which also ranked highly based on Gini index, may have a substantial contribution to prediction as a proxy for other important features, such as CGI status and CpG density.
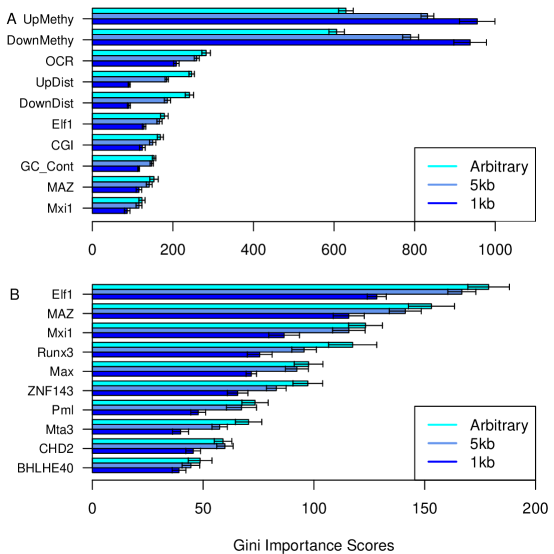
Several TFs were among the most highly ranked features across experiments (Figure 7B), some of which are known to be associated with DNA methylation, including Elf1, Runx3, MAZ, Mxi1, and Max. Indeed, the ETS-related transcription factor (Elf1) has been shown to be overrepresented in methylated regions, associating DNA methylation with hemapotopoiesis in hematopoietic stem cells [61]. Runx3 (Runt-related transcription factor 3), a strong tumor suppressor associated with diverse tumor types, has been suggested to be associated with cancer development through regulating global DNA methylation levels [62, 63, 64, 65, 66, 67]. Runx3 expression is associated with aberrant DNA methylation in adenocarcinoma cells [66], primary bladder tumor cells [64], and breast cancer cells [65]. For another tumor suppressor transcription factor00, Mxi1 (MAX-interacting protein 1), expression levels (specifically, lack of expression) have been reported to be associated with promoter methylation levels and neuroblastic tumorigenesis [68]. It has been suggested that suppression of MAZ (Myc-associated zinc finger protein) may be associated with DNA methyltransferase I, the key factor for de novo DNA methylation [69, 70]. Mxi1 and MAX (Myc-associated factor X) both interact with c-Myc (myelocytomatosis oncogene), a well characterized oncogene, which has been shown to be methylation sensitive, meaning that the TF motifs contain CpG sites and, thus, TF binding is sensitive to methylation status at those sites [71]. This suggests a potential regulatory relationship between MAX, Mxi1, and DNA methylation that may extend to downstream cancer tumor development.
We found that the feature rankings based on Gini scores differed only slightly across experiments (Figure 7A and 7B), indicating the robustness of the Gini index to quantify contribution to prediction accuracy. We found that the correlation between a binary feature and PC1 is proportional to the Gini index of that feature (Figure 5 and Table S2). The variation in the Gini index rankings for TFBSs varied more than we expected based on the other features (Figure S6). TFBSs that co-occur with CpG sites more often tend to be more important for prediction, according to the Gini index score. We found that the Gini index of a binary feature has a log linear relationship with the number of co-occurrences of that binary feature with CpG sites in the data set: the more often a CpG site in the training set co-occurred with a TFBS, the higher the Gini index rank of that CpG site. There were several outliers to this trend, including upstream and downstream CpG site methylation status, status of promoter, gene body, and non CGI regions, and three TFBSs (Pol3 (RNA polymerase III), Rxr- (Retinoid X receptor alpha) and C-fos (a proto-oncogene)). These features were less important than we would predict using the fitted linear regression model of log Gini importance. This trend limits the strong conclusions that associate specific TFBSs with DNA methylation biochemically from a high Gini index rank for that TFBS; it may be that there are general relationships between TFBS and CpG sites that we are learning, but a relatively high TFBS frequency in these data will artificially inflate the rank of that TFBS in comparison to the others (Figure S6). Most CpG sites within TFBSs have low average methylation levels (Table S3). Several TFBSs have disproportionately high average methylation values: for example ZNF274 (Zinc-finger protein 274) and JunD (Jun D proto-oncogene); however, both of these outliers also have a low co-occurrence frequency with CpG sites in these data, suggesting that this finding may be an artifact.
Discussion
We characterized genome-wide and region-specific patterns of DNA methylation. These region-specific patterns raise additional questions, including how these observations may resolve or at least suggest causal relationships between methylation and other genomic and epigenomic processes. With single nucleotide polymorphism (SNP) associations with complex traits, it is likely that the genotype drives associated processes rather than the other way around; the causal relationship is established by inductive logic, since it is biologically difficult to perform site-specific mutation. The dynamic nature of CpG site methylation means that no such causal relationship can be established inductively; however, experiments can be designed to establish the impact of changing the methylation status of a CpG site [72, 73]. Conditional analyses, such as those developed for DNA, may prove to be illuminating for epigenomics [74], but the current data are still murky. For example, does a TFBS containing a CpG site prevent methylation when a transcription factor is actively bound, or does a methylated CpG site in a TFBS prevent a TF from binding to that site?
We built a random forest predictor of DNA methylation levels at CpG site resolution. In our comparison between random forest classifiers and SVM classifiers, we found that improvements of the random forest classifier include i) better prediction for more sparsely sampled genomic regions, and ii) biological interpretability that comes from the ability to readily extract information about the importance of each feature in prediction. The accuracy results for predictions based on this model are promising, and suggest the possibility of imputing CpG site methylation levels genome-wide in the future. For example, if we assay a set of individuals in an EWAS study on the Illumina 450K array, we may be able to impute the missing genome-wide CpG sites from WGBS assays. However, we are still far from the prediction accuracies currently expected for SNP imputation for downstream use in GWAS studies. Our cross-sample analysis illustrates that including methylation profiles from other individuals as references, as is done for DNA imputation [75], may improve accuracies substantially. However, because of biological, batch, and environmental effects on DNA methylation, it is possible that precise imputation will require a much larger reference panel relative to DNA imputation. As in GWAS studies, all of these imputation methods will fail to predict rare or unexpected variants [76], which may hold a substantial proportion of association signal for both GWAS and EWAS [77, 78]. This work raises the additional question, then, of how best to sample CpG sites across the genome given the methylation patterns and the possibility of imputation; for example, it may be sufficient to assay a single CpG site within a CGI and impute the others, given the high correlation between methylation values in CpG sites within the same CGI.
We identified genomic and epigenomic features that were most predictive of methylation status for co-located CpG sites. The biological functions of CGI shore and shelf regions, and in particular the impact of methylation in these regions, are mostly unknown; however, it has been shown there is substantial DNA methylation variation in CGI shore regions relative to other regions in the genome, and these alterations may contribute to cancer development and tissue differentiation [58, 59]. We hope to better characterize the role of CGI shore and shelf regions with respect to enrichment of particular regulatory elements in the future to understand the cellular role of these regions and the specific, curious pattern of methylation found within them.
One particularly important driver of methylation that we do not study carefully here is methylation quantitative trait loci (meQTLs), or genetic drivers of methylation [35, 79, 80]. There is substantial work on the enrichment of meQTLs within SNPs and genetic loci that appear to regulate gene transcription levels (eQTLs), DHS site status (dsQTLs), and others [35, 60, 79, 81, 82, 83]. The characterizations described here lead us to consider identifying QTLs associated with deviations from CRE-specific methylation patterns instead of single CpG sites, as has been done with methylation in CGI shore regions and associations with cancer [59].
Conclusion
We investigated genome-wide methylation in 100 individuals profiled using the Illumina 450K array. We identified patterns of correlation in DNA methylation at CpG sites specific to CpG islands, CGI shores, and non-CGIs, quantifying the variability within CGI shore regions and a pattern of correlation across the shelf regions by which correlation increases with distance. We built a random forest classifier to predict methylation as a binary status and as a continuous level at single CpG site accuracy, using as features neighboring CpG site information, genomic position, DNA sequence properties, and cis-regulatory element co-location information. Our method outperformed state-of-the art methylation classifiers, including our own version of an SVM-based classifier. Our approach quantifies features that are most predictive of CpG status: we found that neighboring CpG site methylation levels, location in a CpG island, and co-localized DHS sites and specific transcription factor binding sites were most predictive of DNA methylation levels. We identify several TFBSs, including Elf1, MAZ, Mxi1, and Runx3, that are highly predictive of methylation levels in whole blood. These predictive features may play a mechanistic role in methylation, either in regulating the methylation of CpG sites or as a downstream partner in modifying the cellular phenotype.
Materials and methods
DNA methylation data
Illumina HumanMethylation450K array data were obtained for 100 unrelated individuals from the TwinsUK cohort [84] All participants in the study provided written informed consent in accordance with local ethics research committees. The 100 individuals were adult unselected volunteers and included 97 female and 3 male individuals (age range 27–78). Whole blood was collected and DNA was extracted using standard protocols.
Illumina HumanMethylation450K array (Illumina 450K) measured DNA methylation values for more than CpG sites per individual at single-nucleotide resolution. The genomic coverage includes of reference sequence genes, with an average of CpG sites per gene region distributed across the promoter, 5’UTR, first exon, gene body, and 3’UTR, and of CpG islands [85, 34].
Methylation values for each CpG site are quantified by the term , which is the fraction of methylated bead signal over the sum of methylated and unmethylated bead signal:
| (1) |
where Methy represents the signal intensity of the methylated probe and Unmethy represents the signal intensity of the unmethylated probe. The quantity ranges from (unmethylated) to (fully methylated).
Data quality control was implemented using R (http://www.r-project.org/) (version 2.15.3). We removed CpG sites for whom the probes mapped to multiple places in the human genome reference sequence. CpG sites with missing values or detection p-values were excluded. Methylation data from the X and Y chromosomes were excluded, leaving CpG sites from individuals in downstream analyses. The data were controlled for array number, sample position on the array, age, and sex by taking the residual from a fitted linear regression model. The sum of residuals and intercepts of each site was scaled to by truncating all sites with values larger than to and all sites with values smaller than to . Data quality was assessed to identify sample outliers and batch effects using principal component analysis (PCA) [86], no obvious outliers were identified.
Correlation and PCA
The statistical analyses were implemented using R and Bioconductor (http://www.bioconductor.org/) (version 2.15.3). Methylation correlations between CpG sites were assessed by the absolute value of Pearson’s correlation coefficient and mean square error (MSE):
| (2) |
where and represent the methylation values of the two CpG sites being compared, represents the total number of CpG sites being compared. For neighboring CpG sites, pairs of CpG sites assayed on the array that were adjacent in the genome were sampled; the genomic distance between the pairs of CpG sites were within the range bp to bp, where . The correlation and MSE of a bp window was not computed, as there were too few CpG sites. The non-adjacent pair correlation or MSE values are the average absolute value correlation or MSE of pairs of CpG sites that were not immediate neighbors with their genomic distances in the same range as for the adjacent CpG sites.
We performed PCA on methylation values of CpG sites by computing the eigenvalues of the covariance matrix of a subsample of CpG sites using the R function svd. Among the CpG sites that have complete feature information, sites (every tenth CpG site) were sampled along the genome across all autosomal chromosomes. Pearson’s correlation was calculated between each feature and first ten PCs. PCA analysis was performed by plotting the principal component biplot (scatterplot of first two PCs). The prediction performances were assessed by Receiver Operating Characteristic (ROC) curves and residual sum of squares (RSS).
Random forest classifier
We used the randomForest package in R for the implementation of the random forest classifier [87] (version 4.6-7). Most of the parameters were kept as default, but ntree was set to to balance efficiency and accuracy in our high-dimensional data. We found the parameter settings for the random forest classifier (including the number of trees) to be robust to different settings, so we did not estimate parameters in our classifier. The Gini index, which calculates the total decrease of node impurity (e.g., the relative entropy of the class proportions before and after the split) of a feature over all trees, was used to quantify the importance of each feature:
| (3) |
where represents the class and is the proportion of sites belonging to class in node .
We compared the performance of the random forest with the support vector machine (SVM) an alternative classifier frequently used in related work [38, 39, 28, 40, 42, 45, 36]. We built an SVM classifier with a Radial Basis Function (RBF) nonlinear kernel, which generally yields more accurate results than the linear kernel that was used in most of the related classifiers [88, 89]. We used the SVM implemented in the e1071 package in R [90]. The parameters of the SVM were optimized by 10-fold cross-validation using grid search. The penalty constant ranged from and the parameter in the kernel function ranged from . The parameter combination that had the best performance was used in comparisons with our random forest classifier; specifically, we set and
Features for prediction
A comprehensive list of features were used in prediction (Table S4). The neighbors features were obtained from data from the Methylation 450K Array; The position features, including gene coding region category, location in CGIs, and SNPs, were obtained from the Methylation 450K Array Annotation file; DNA recombination rate data was downloaded from HapMap (phaseII_B37, update date Jan192011) [54]; GC content data were downloaded from the raw data used to encode the gc5Base track on hg19 (update date Apr242009) from the UCSC Genome Browser (http://hgdownload.cse.ucsc.edu/goldenPath/hg19/gc5Base/) [91], integrated haplotype scores (iHS scores) were downloaded from the HGDP selection browser iHS data of smoothedAmericas (update date Feb122009) (http://hgdp.uchicago.edu/data/iHS/) [56], and GERP constraint scores were downloaded from SidowLab GERP++ tracks on hg19 (http://mendel.stanford.edu/SidowLab/downloads/gerp/) [57]; CREs features: DNAse I hypersensitive sites data were obtained from the DNase-seq data for the GM12878 cell line produced by Crawford Lab at Duke University (UCSC Accession: wgEncodeEH000534, submitted date Mar202009) and specific transcription factor binding sites ChIP-seq data were from the narrow peak files from GM12878 cell line that were available before June 2012 from the ENCODE website [55].
Neighboring CpG site methylation status was encoded as “methylated” when the site has a and “unmethylated” when . For continuous features, the feature value is the value of that feature at the genomic location of the CpG site, and for binary features, the feature status indicates whether the CpG site is within that genomic feature or not. DHS sites were encoded as binary variables indicating a CpG site within a DHS site; TFBSs were included as binary variables indicating the presence of a co-localized ChIP-Seq peak; iHS scores, GERP constraint scores and recombination rates were measured in terms of genomic regions; For GC content, we computed the proportion of G and C within a sequence window of bp, as this feature was shown to be an important predictor in previous study [40]. Among all 99 features, 97 of them (excluding upstream and downstream neighboring CpG sites’ values) were used for methylation status predictions, and all excluding upstream and downstream neighboring CpG sites’ methylation status were used for methylation level predictions. When limiting prediction to specific regions, e.g., CGI, we excluded those features indicating co-location with that region type.
Prediction evaluation
Our methylation predictions were at single CpG site resolution. For regional specific methylation prediction, we grouped the CpG sites into either promoter, gene body, intergenic region classes or CGI, CGI shore & shelf, non-CGI classes according to Methylation 450K array annotation file, which was downloaded from the UCSC genome browser[50].
The classifier performance was assessed by a version of repeated random subsampling (RRS) validation. Within a single individual, ten times we pulled random CpG sites from across the genome into the training set, and we tested on all other held-out sites. The prediction performance for a single classifier was calculated by averaging the prediction performance statistics across each of the trained classifiers. We checked the performance with smaller training set of sizes , , , and sites in the same evaluation setup. In cross-sample analyses, we set the size of the training set to randomly chosen CpG sites to balance computational performance and accuracy. We then evaluated the consistency of methylation pattern in different individuals by training the classifier using randomly chosen CpG sites in one individual, and then using the trained classifier to predict all of the CpG sites in the remaining individuals.
We quantified the accuracy of the results using the specificity (SP), sensitivity (SE), accuracy (ACC), and the Matthew’s Correlation Coefficient (MCC). These values were calculated as follows:
| (4) |
| (5) |
| (6) |
| (7) |
where TP, TN, FP, FN represent the number of true positives, true negatives, false positives, and false negatives respectively for a particular threshold. Receiver Operating Characteristic (ROC) curves were plotted and we chose a cutoff of . The area under the ROC curve (AUC) was calculated; the AUC reflects the overall prediction performance considering both type I (FPs) and type II errors (FNs) [38, 92]. We used the ROCR package in R.
To estimate continuous methylation levels (), we used the classifier output of prediction probability directly as an estimate of a specific . Prediction accuracy in this regression setting was evaluated using the correlation coefficient and root mean squared error (RMSE).
| (8) |
| (9) |
where are the experimental and predicted values, respectively, , are the means of the experimental and predicted methylation levels, respectively, , are the empirical standard deviations of the experimental and predicted values, respectively.
Author’s contributions
Conceived the experiments: JTB, BEE. Designed the experiments: WZ, BEE. Performed the experiments: WZ. Analyzed the data: WZ, BEE. Wrote the paper: WZ, JTB, BEE. Responsible for quality control and pre-processing: WZ, JTB, BEE. Contributed valuable data: TDS, PD, JTB.
Acknowledgements
The authors acknowledge the TwinsUK consortium for providing all methylation data on 100 individuals, Dr. Casey D Brown for providing critical insights, and Dr. Susan Murphy for helpful discussions. BEE was funded through NIH NIGRI R00 HG006265.
References
- [1] Barrero MJ, Boué S, Izpisúa Belmonte JC: Epigenetic mechanisms that regulate cell identity. Cell stem cell 2010, 7(5):565–70, [http://www.ncbi.nlm.nih.gov/pubmed/21040898].
- [2] Scarano MI, Strazzullo M, Matarazzo MR, D’Esposito M: DNA methylation 40 years later: Its role in human health and disease. Journal of Cellular Physiology 2005, 204:21–35, [http://www.ncbi.nlm.nih.gov/pubmed/15648089].
- [3] Cedar H, Bergman Y: Programming of DNA Methylation Patterns. Annual Review of Biochemistry 2012, 81(February):97–117, [http://www.ncbi.nlm.nih.gov/pubmed/22404632].
- [4] Kiefer JC: Epigenetics in development. Developmental dynamics : an official publication of the American Association of Anatomists 2007, 236(4):1144–56, [http://www.ncbi.nlm.nih.gov/pubmed/17304537].
- [5] Tost J: DNA methylation: an introduction to the biology and the disease-associated changes of a promising biomarker. Molecular biotechnology 2010, 44:71–81, [http://www.ncbi.nlm.nih.gov/pubmed/19842073].
- [6] Cedar H: DNA methylation and gene activity. Cell 1988, 1964(5):93–124, [http://ukpmc.ac.uk/abstract/MED/3280142].
- [7] Jaenisch R, Bird A: Epigenetic regulation of gene expression: how the genome integrates intrinsic and environmental signals. Nature genetics 2003, 33 Suppl(march):245–54, [http://www.ncbi.nlm.nih.gov/pubmed/12610534].
- [8] Wolffe aP: Epigenetics: Regulation Through Repression. Science 1999, 286(5439):481–486, [http://www.sciencemag.org/cgi/doi/10.1126/science.286.5439.481].
- [9] Rivenbark AG, Stolzenburg S, Beltran AS, Yuan X, Rots MG, Strahl BD, Blancafort P: Epigenetic reprogramming of cancer cells via targeted DNA methylation. Epigenetics official journal of the DNA Methylation Society 2012, 7(4), [http://www.ncbi.nlm.nih.gov/pubmed/22419067].
- [10] Das PM, Singal R: DNA methylation and cancer. Journal of Clinical Oncology 2004, 22(22):4632–42, [http://www.ncbi.nlm.nih.gov/pubmed/15542813].
- [11] Lienert F, Wirbelauer C, Som I, Dean A, Mohn F, Schübeler D: Identification of genetic elements that autonomously determine DNA methylation states. Nature genetics 2011, 43(11):1091–7, [http://www.ncbi.nlm.nih.gov/pubmed/21964573].
- [12] Jones Pa: Functions of DNA methylation: islands, start sites, gene bodies and beyond. Nature reviews. Genetics 2012, 13(7):484–92, [http://www.ncbi.nlm.nih.gov/pubmed/22641018].
- [13] Law Ja, Jacobsen SE: Establishing, maintaining and modifying DNA methylation patterns in plants and animals. Nature reviews. Genetics 2010, 11(3):204–20, [http://www.pubmedcentral.nih.gov/articlerender.fcgi?artid=3034103“&tool=pmcentrez“&rendertype=abstract].
- [14] Shen L, Kondo Y, Guo Y, Zhang J, Zhang L, Ahmed S, Shu J, Chen X, Waterland Ra, Issa JPJ: Genome-wide profiling of DNA methylation reveals a class of normally methylated CpG island promoters. PLoS genetics 2007, 3(10):2023–36, [http://www.pubmedcentral.nih.gov/articlerender.fcgi?artid=2041996“&tool=pmcentrez“&rendertype=abstract].
- [15] Larsen F, Gundersen G, Lopez R, Prydz H: CpG islands as gene markers in the human genome. Genomics 1992, 13(4):1095–107, [http://www.ncbi.nlm.nih.gov/pubmed/1505946].
- [16] Brandeis M, Frank D, Keshet I, Siegfried Z, Mendelsohn M, Nemes A, Temper V, Razin A, Cedar H: Sp1 elements protect a CpG island from de novo methylation. Nature 1994, 371(6496):435–8, [http://www.ncbi.nlm.nih.gov/pubmed/8090226].
- [17] Macleod D, Charlton J, Mullins J, Bird aP: Sp1 sites in the mouse aprt gene promoter are required to prevent methylation of the CpG island. Genes & Development 1994, 8(19):2282–2292, [http://www.genesdev.org/cgi/doi/10.1101/gad.8.19.2282].
- [18] Dickson J, Gowher H, Strogantsev R, Gaszner M, Hair A, Felsenfeld G, West AG: VEZF1 elements mediate protection from DNA methylation. PLoS genetics 2010, 6:e1000804, [http://www.pubmedcentral.nih.gov/articlerender.fcgi?artid=2795164“&tool=pmcentrez“&rendertype=abstract].
- [19] Teschendorff AE, Menon U, Gentry-Maharaj A, Ramus SJ, Gayther Sa, Apostolidou S, Jones A, Lechner M, Beck S, Jacobs IJ, Widschwendter M: An epigenetic signature in peripheral blood predicts active ovarian cancer. PloS one 2009, 4(12):e8274, [http://www.pubmedcentral.nih.gov/articlerender.fcgi?artid=2793425“&tool=pmcentrez“&rendertype=abstract].
- [20] Deaton AM, Bird A: CpG islands and the regulation of transcription. Genes & development 2011, 25(10):1010–22, [http://www.pubmedcentral.nih.gov/articlerender.fcgi?artid=3093116“&tool=pmcentrez“&rendertype=abstract].
- [21] Choy MK, Movassagh M, Goh HG, Bennett MR, Down Ta, Foo RSY: Genome-wide conserved consensus transcription factor binding motifs are hyper-methylated. BMC genomics 2010, 11:519, [http://www.pubmedcentral.nih.gov/articlerender.fcgi?artid=2997012“&tool=pmcentrez“&rendertype=abstract].
- [22] Gebhard C, Benner C, Ehrich M, Schwarzfischer L, Schilling E, Klug M, Dietmaier W, Thiede C, Holler E, Andreesen R, Rehli M: General transcription factor binding at CpG islands in normal cells correlates with resistance to de novo DNA methylation in cancer cells. Cancer research 2010, 70(4):1398–407, [http://www.ncbi.nlm.nih.gov/pubmed/20145141].
- [23] Stirzaker C, Song JZ, Davidson B, Clark SJ: Transcriptional gene silencing promotes DNA hypermethylation through a sequential change in chromatin modifications in cancer cells. Cancer research 2004, 64(11):3871–7, [http://www.ncbi.nlm.nih.gov/pubmed/15172996].
- [24] Valenzuela L, Kamakaka RT: Chromatin insulators. Annual review of genetics 2006, 40:107–38, [http://www.ncbi.nlm.nih.gov/pubmed/16953792].
- [25] Weber M, Hellmann I, Stadler MB, Ramos L, Pääbo S, Rebhan M, Schübeler D: Distribution, silencing potential and evolutionary impact of promoter DNA methylation in the human genome. Nature genetics 2007, 39(4):457–66, [http://www.ncbi.nlm.nih.gov/pubmed/17334365].
- [26] Meissner A, Mikkelsen TS, Gu H, Wernig M, Hanna J, Sivachenko A, Zhang X, Bernstein BE, Nusbaum C, Jaffe DB, Gnirke A, Jaenisch R, Lander ES: Genome-scale DNA methylation maps of pluripotent and differentiated cells. Nature 2008, 454(7205):766–70, [http://www.pubmedcentral.nih.gov/articlerender.fcgi?artid=2896277“&tool=pmcentrez“&rendertype=abstract].
- [27] Hawkins RD, Hon GC, Lee LK, Ngo Q, Lister R, Pelizzola M, Edsall LE, Kuan S, Luu Y, Klugman S, Antosiewicz-Bourget J, Ye Z, Espinoza C, Agarwahl S, Shen L, Ruotti V, Wang W, Stewart R, Thomson Ja, Ecker JR, Ren B: Distinct epigenomic landscapes of pluripotent and lineage-committed human cells. Cell stem cell 2010, 6(5):479–91, [http://www.pubmedcentral.nih.gov/articlerender.fcgi?artid=2867844“&tool=pmcentrez“&rendertype=abstract].
- [28] Das R, Dimitrova N, Xuan Z, Rollins Ra, Haghighi F, Edwards JR, Ju J, Bestor TH, Zhang MQ: Computational prediction of methylation status in human genomic sequences. Proceedings of the National Academy of Sciences of the United States of America 2006, 103(28):10713–6, [http://www.pubmedcentral.nih.gov/articlerender.fcgi?artid=1502297“&tool=pmcentrez“&rendertype=abstract].
- [29] Laird PW: Principles and challenges of genomewide DNA methylation analysis. Nature reviews. Genetics 2010, 11(3):191–203, [http://www.ncbi.nlm.nih.gov/pubmed/20125086].
- [30] Laurent L, Wong E, Li G, Huynh T, Tsirigos A, Ong CT, Low HM, Wing K, Sung K: Dynamic changes in the human methylome during differentiation. Genome Research 2010, 20:320–331.
- [31] Hon G, Antosiewicz-bourget J, Malley RO, Castanon R: Hotspots of aberrant epigenomic reprogramming in human induced pluripotent stem cells. Nature 2011, 471(7336):68–73.
- [32] Lister R, Pelizzola M, Dowen RH, Hawkins RD, Hon G, Tonti-Filippini J, Nery JR, Lee L, Ye Z, Ngo QM, Edsall L, Antosiewicz-Bourget J, Stewart R, Ruotti V, Millar aH, Thomson Ja, Ren B, Ecker JR: Human DNA methylomes at base resolution show widespread epigenomic differences. Nature 2009, 462(7271):315–22, [http://www.pubmedcentral.nih.gov/articlerender.fcgi?artid=2857523“&tool=pmcentrez“&rendertype=abstract].
- [33] Sandoval J, Heyn H, Moran S, Serra-Musach J, Pujana MA, Bibikova M, Esteller M: Validation of a DNA methylation microarray for 450,000 CpG sites in the human genome. Epigenetics : official journal of the DNA Methylation Society 2011, 6(6):692–702, [http://www.ncbi.nlm.nih.gov/pubmed/21593595].
- [34] Bibikova M, Barnes B, Tsan C, Ho V, Klotzle B, Le JM, Delano D, Zhang L, Schroth GP, Gunderson KL, Fan JB, Shen R: High density DNA methylation array with single CpG site resolution. Genomics 2011, 98(4):288–95, [http://www.ncbi.nlm.nih.gov/pubmed/21839163].
- [35] Bell JT, Pai Aa, Pickrell JK, Gaffney DJ, Pique-Regi R, Degner JF, Gilad Y, Pritchard JK: DNA methylation patterns associate with genetic and gene expression variation in HapMap cell lines. Genome biology 2011, 12:R10, [http://www.pubmedcentral.nih.gov/articlerender.fcgi?artid=3091299“&tool=pmcentrez“&rendertype=abstract].
- [36] Eckhardt F, Lewin J, Cortese R, Rakyan VK, Attwood J, Burger M, Burton J, Cox TV, Davies R, Down Ta, Haefliger C, Horton R, Howe K, Jackson DK, Kunde J, Koenig C, Liddle J, Niblett D, Otto T, Pettett R, Seemann S, Thompson C, West T, Rogers J, Olek A, Berlin K, Beck S: DNA methylation profiling of human chromosomes 6, 20 and 22. Nature genetics 2006, 38(12):1378–85, [http://www.pubmedcentral.nih.gov/articlerender.fcgi?artid=3082778“&tool=pmcentrez“&rendertype=abstract].
- [37] Fernandez AF, Assenov Y, Martin-Subero JI, Balint B, Siebert R, Taniguchi H, Yamamoto H, Hidalgo M, Tan AC, Galm O, Ferrer I, Sanchez-Cespedes M, Villanueva A, Carmona J, Sanchez-Mut JV, Berdasco M, Moreno V, Capella G, Monk D, Ballestar E, Ropero S, Martinez R, Sanchez-Carbayo M, Prosper F, Agirre X, Fraga MF, Graña O, Perez-Jurado L, Mora J, Puig S, Prat J, Badimon L, Puca AA, Meltzer SJ, Lengauer T, Bridgewater J, Bock C, Esteller M: A DNA methylation fingerprint of 1628 human samples. Genome Research 2011, 22(2):407–419, [http://www.ncbi.nlm.nih.gov/pubmed/21613409].
- [38] Bhasin M, Zhang H, Reinherz EL, Reche Pa: Prediction of methylated CpGs in DNA sequences using a support vector machine. FEBS letters 2005, 579(20):4302–8, [http://www.ncbi.nlm.nih.gov/pubmed/16051225].
- [39] Bock C, Paulsen M, Tierling S, Mikeska T, Lengauer T, Walter J: CpG island methylation in human lymphocytes is highly correlated with DNA sequence, repeats, and predicted DNA structure. PLoS genetics 2006, 2(3):e26, [http://www.pubmedcentral.nih.gov/articlerender.fcgi?artid=1386721“&tool=pmcentrez“&rendertype=abstract].
- [40] Fang F, Fan S, Zhang X, Zhang MQ: Predicting methylation status of CpG islands in the human brain. Bioinformatics (Oxford, England) 2006, 22(18):2204–9, [http://www.ncbi.nlm.nih.gov/pubmed/16837523].
- [41] Kim S, Li M, Paik H, Nephew K, Shi H, Kramer R, Xu D, Huang TH: Predicting DNA methylation susceptibility using CpG flanking sequences. Pacific Symposium On Biocomputing 2008, 326:315–326, [http://www.ncbi.nlm.nih.gov/pubmed/18229696].
- [42] Fan S, Zhang MQ, Zhang X: Histone methylation marks play important roles in predicting the methylation status of CpG islands. Biochemical and Biophysical Research Communications 2008, 374(3):559–564, [http://www.pubmedcentral.nih.gov/articlerender.fcgi?artid=2974564“&tool=pmcentrez“&rendertype=abstract].
- [43] Lu L: Predicting DNA methylation status using word composition. Journal of Biomedical Science and Engineering 2010, 03(07):672–676, [http://www.scirp.org/journal/PaperDownload.aspx?DOI=10.4236/jbise.2010.37091].
- [44] Zheng H, Wu H, Li J, Jiang SW: CpGIMethPred: computational model for predicting methylation status of CpG islands in human genome. BMC medical genomics 2013, 6 Suppl 1(Suppl 1):S13, [http://www.pubmedcentral.nih.gov/articlerender.fcgi?artid=3552668“&tool=pmcentrez“&rendertype=abstract].
- [45] Previti C, Harari O, Zwir I, del Val C: Profile analysis and prediction of tissue-specific CpG island methylation classes. BMC bioinformatics 2009, 10:116, [http://www.pubmedcentral.nih.gov/articlerender.fcgi?artid=2683815“&tool=pmcentrez“&rendertype=abstract].
- [46] Maunakea AK, Nagarajan RP, Bilenky M, Ballinger TJ, D’Souza C, Fouse SD, Johnson BE, Hong C, Nielsen C, Zhao Y, Turecki G, Delaney A, Varhol R, Thiessen N, Shchors K, Heine VM, Rowitch DH, Xing X, Fiore C, Schillebeeckx M, Jones SJM, Haussler D, Marra MA, Hirst M, Wang T, Costello JF: Conserved role of intragenic DNA methylation in regulating alternative promoters. Nature 2010, 466(7303):253–257, [http://www.nature.com/doifinder/10.1038/nature09165].
- [47] Zhou X, Li Z, Dai Z, Zou X: Prediction of methylation CpGs and their methylation degrees in human DNA sequences. Computers in biology and medicine 2012, 42(4):408–13, [http://www.ncbi.nlm.nih.gov/pubmed/22209047].
- [48] Siepel A, Bejerano G, Pedersen JS, Hinrichs AS, Hou M, Rosenbloom K, Clawson H, Spieth J, Hillier LW, Richards S, Weinstock GM, Wilson RK, Gibbs RA, Kent WJ, Miller W, Haussler D: Evolutionarily conserved elements in vertebrate, insect, worm, and yeast genomes. Genome Research 2005, 15(8):1034–1050, [http://www.ncbi.nlm.nih.gov/pubmed/16024819].
- [49] Heyn H, Carmona FJ, Gomez A, Ferreira HJ, Bell JT, Sayols S, Ward K, Stefansson OA, Moran S, Sandoval J, Eyfjord JE, Spector TD, Esteller M: DNA methylation profiling in breast cancer discordant identical twins identifies DOK7 as novel epigenetic biomarker. Carcinogenesis 2013, 34:102–8, [http://www.pubmedcentral.nih.gov/articlerender.fcgi?artid=3534196“&tool=pmcentrez“&rendertype=abstract].
- [50] Kent WJ, Sugnet CW, Furey TS, Roskin KM, Pringle TH, Zahler aM, Haussler aD: The Human Genome Browser at UCSC. Genome Research 2002, 12(6):996–1006, [http://www.genome.org/cgi/doi/10.1101/gr.229102].
- [51] Durbin RM, Altshuler DL, Abecasis GR, Bentley DR, Chakravarti A, Clark AG, Collins FS, De La Vega FM, Donnelly P, Egholm M, Flicek P, Gabriel SB, Gibbs RA, Knoppers BM, Lander ES, Lehrach H, Mardis ER, McVean GA, Nickerson DA, Peltonen L, Schafer AJ, Sherry ST, Wang JJ, Wilson RK, Deiros D, Metzker M, Muzny D, Reid J, Wheeler D, Li J, Jian M, Li G, Li R, Liang H, Tian G, Wang B, Wang W, Yang H, Zhang X, Zheng HH, Ambrogio L, Bloom T, Cibulskis K, Fennell TJ, Jaffe DB, Shefler E, Sougnez CL, Gormley N, Humphray S, Kingsbury Z, Koko-Gonzales P, Stone J, McKernan KJ, Costa GL, Ichikawa JK, Lee CCC, Sudbrak R, Borodina TA, Dahl A, Davydov AN, Marquardt P, Mertes F, Nietfeld W, Rosenstiel P, Schreiber S, Soldatov AV, Timmermann B, Tolzmann M, Affourtit J, Ashworth D, Attiya S, Bachorski M, Buglione E, Burke A, Caprio A, Celone C, Clark S, Conners D, Desany B, Gu L, Guccione L, Kao K, Kebbel A, Knowlton J, Labrecque M, McDade L, Mealmaker C, Minderman M, Nawrocki A, Niazi F, Pareja K, Ramenani R, Riches D, Song W, Turcotte C, Wang S, Dooling D, Fulton L, Fulton R, Weinstock G, Burton J, Carter DM, Churcher C, Coffey AA, Cox A, Palotie A, Quail M, Skelly T, Stalker J, Swerdlow HP, Turner D, De Witte A, Giles S, Bainbridge M, Challis D, Sabo A, Yu F, Yu J, Fang X, Guo X, Li YY, Luo R, Tai S, Wu H, Zheng X, Zhou Y, Marth GT, Garrison EP, Huang W, Indap A, Kural D, Lee WP, Fung Leong W, Quinlan AR, Stewart C, Stromberg MP, Ward AN, Wu J, Mills RE, Shi X, Daly MJ, DePristo MA, Ball AD, Banks E, Browning BL, Garimella KV, Grossman SR, Handsaker RE, Hanna M, Hartl C, Kernytsky AM, Korn JM, Li H, Maguire JR, McCarroll SA, McKenna A, Nemesh JC, Philippakis AA, Poplin RE, Price A, Rivas MA, Sabeti PC, Schaffner SF, Shlyakhter IA, Cooper DN, Ball EV, Mort M, Phillips AD, Stenson PD, Sebat J, Makarov V, Ye KK, Yoon SC, Bustamante CD, Boyko A, Degenhardt J, Gravel S, Gutenkunst RN, Kaganovich M, Keinan A, Lacroute P, Ma X, Reynolds A, Clarke L, Cunningham F, Herrero J, Keenen S, Kulesha E, Leinonen R, McLaren WM, Radhakrishnan R, Smith RE, Zalunin V, Zheng-Bradley X, Korbel JO, Stütz AM, Bauer M, Keira Cheetham R, Cox T, Eberle M, James T, Kahn S, Murray L, Fu Y, Hyland FCL, Manning JM, McLaughlin SF, Peckham HE, Sakarya O, Sun YA, Tsung EF, Batzer MA, Konkel MK, Walker JA, Albrecht MW, Amstislavskiy VS, Herwig R, Parkhomchuk DV, Agarwala R, Khouri HM, Morgulis AO, Paschall JE, Phan LD, Rotmistrovsky KE, Sanders RD, Shumway MF, Xiao C, Auton A, Iqbal Z, Lunter G, Marchini JL, Moutsianas L, Myers S, Tumian A, Knight J, Winer R, Craig DW, Beckstrom-Sternberg SM, Christoforides A, Kurdoglu AA, Pearson JV, Sinari SA, Tembe WD, Haussler D, Hinrichs AS, Katzman SJ, Kern A, Kuhn RM, Przeworski M, Hernandez RD, Howie B, Kelley JL, Cord Melton S, Anderson P, Blackwell T, Chen W, Cookson WO, Ding J, Min Kang H, Lathrop M, Liang L, Moffatt MF, Scheet P, Sidore C, Snyder MM, Zhan X, Zöllner S, Awadalla P, Casals F, Idaghdour Y, Keebler J, Stone EA, Zilversmit M, Jorde L, Xing J, Eichler EE, Aksay G, Alkan C, Hajirasouliha I, Hormozdiari F, Kidd JM, Cenk Sahinalp S, Sudmant PH, Chen K, Chinwalla A, Ding L, Koboldt DC, McLellan MD, Wallis JW, Wendl MC, Zhang Q, Albers CA, Ayub Q, Balasubramaniam S, Barrett JC, Chen Y, Conrad DF, Danecek P, Dermitzakis ET, Hu M, Huang N, Hurles ME, Jin H, Jostins L, Keane TM, Quang Le S, Lindsay S, Long Q, MacArthur DG, Montgomery SB, Parts L, Tyler-Smith C, Walter K, Zhang Y, Gerstein MB, Abyzov A, Balasubramanian S, Bjornson R, Du J, Grubert F, Habegger L, Haraksingh R, Jee J, Khurana E, Lam HYK, Leng J, Jasmine Mu X, Urban AE, Zhang Z, Coafra C, Dinh H, Kovar C, Lee S, Nazareth L, Wilkinson J, Scott C, Gharani N, Kaye JS, Kent A, Li T, McGuire AL, Ossorio PN, Rotimi CN, Su Y, Toji LH, Brooks LD, Felsenfeld AL, McEwen JE, Abdallah A, Juenger CR, Clemm NC, Duncanson A, Green ED, Guyer MS, Peterson JL: A map of human genome variation from population-scale sequencing. Nature 2010, 467(7319):1061–1073, [http://dx.doi.org/10.1038/nature09534http://www.ncbi.nlm.nih.gov/pmc/articles/PMC3042601/].
- [52] Keene MA, Corces V, Lowenhaupt K, Elgin SC: DNase I hypersensitive sites in Drosophila chromatin occur at the 5’ ends of regions of transcription. Proceedings of the National Academy of Sciences of the United States of America 1981, 78:143–146, [http://www.pubmedcentral.nih.gov/articlerender.fcgi?artid=319007“&tool=pmcentrez“&rendertype=abstract].
- [53] Bernat JA, Crawford GE, Ogurtsov AY, Collins FS, Ginsburg D, Kondrashov AS: Distant conserved sequences flanking endothelial-specific promoters contain tissue-specific DNase-hypersensitive sites and over-represented motifs. Human Molecular Genetics 2006, 15(13):2098–2105, [http://www.ncbi.nlm.nih.gov/pubmed/16723375].
- [54] Tanaka T: [International HapMap project]. Nihon rinsho. Japanese journal of clinical medicine 2005, 63 Suppl 1:29–34, [http://www.pubmedcentral.nih.gov/articlerender.fcgi?artid=3277631“&tool=pmcentrez“&rendertype=abstract].
- [55] Good PJ, Guyer MS, Kamholz S, Liefer L, Wetterstrand K, Kampa D, Sekinger EA, Cheng J, Hirsch H, Ghosh S, Zhu Z, Patel S, Yang A, Tammana H, Bekiranov S, Harrison R, Church G, Kim TH, Qu C, Calcar SV, Luna R, Glass CK, Antonarakis SE, Birney E, Brent M, Pachter L, Reymond A, Dermitzakis ET, Dewey C, Keefe D, Lagarde J, Ashurst J, Hubbard T, Castelo R, Sidow A, Batzoglou S, Trinklein ND, Aldred SF, Anton E, Schroeder DI, Nguyen L, Schmutz J, Grimwood J, Dickson M, Cooper GM, Stone EA, Asimenos G, Karnani N, Taylor CM, Kim HK, Stamatoyannopoulos JA, Sabo P, Hawrylycz M, Humbert R, Yu M, Navas PA, Mcarthur M, Koch CM, Andrews RM, Clelland GK, Wilcox S, Fowler JC, Groth P, Dovey OM, Ellis PD, Wraight VL, Dhami P, Fiegler H, Langford CF, Carter NP, Euskirchen G, Nagalakshmi U, Rinn J, Popescu G, Bertone P, Rozowsky J, Emanuelsson O, Royce T, Gerstein M, Lian Z, Lian J, Nakayama Y, Stolc V, Tongprasit W, Columbia B, Agency C, Sciences G, Marra M, Shin H, Chang J: The ENCODE (ENCyclopedia Of DNA Elements) Project. Science (New York, N.Y.) 2004, 306(5696):636–40, [http://www.ncbi.nlm.nih.gov/pubmed/15499007].
- [56] Voight BF, Kudaravalli S, Wen X, Pritchard JK: A map of recent positive selection in the human genome. PLoS biology 2006, 4(3):e72, [http://www.pubmedcentral.nih.gov/articlerender.fcgi?artid=1382018“&tool=pmcentrez“&rendertype=abstract].
- [57] Davydov EV, Goode DL, Sirota M, Cooper GM, Sidow A, Batzoglou S: Identifying a high fraction of the human genome to be under selective constraint using GERP++. PLoS computational biology 2010, 6(12):e1001025, [http://www.pubmedcentral.nih.gov/articlerender.fcgi?artid=2996323“&tool=pmcentrez“&rendertype=abstract].
- [58] Irzarry: Genome-wide methylation analysis of human colon cancer reveals similar hypo- and hypermethylation at conserved tissue-specific CpG island shores. Nature genetics 2009, 41(2):178–186.
- [59] Doi A, Park IH, Wen B, Murakami P, Aryee MJ, Irizarry R, Herb B, Ladd-Acosta C, Rho J, Loewer S, Miller J, Schlaeger T, Daley GQ, Feinberg AP: Differential methylation of tissue- and cancer-specific CpG island shores distinguishes human induced pluripotent stem cells, embryonic stem cells and fibroblasts. Nature genetics 2009, 41(12):1350–3, [http://www.pubmedcentral.nih.gov/articlerender.fcgi?artid=2958040“&tool=pmcentrez“&rendertype=abstract].
- [60] Tsumagari K, Baribault C, Terragni J, Varley KE, Gertz J, Pradhan S, Badoo M, Crain CM, Song L, Crawford GE, Myers RM, Lacey M, Ehrlich M: Early de novo DNA methylation and prolonged demethylation in the muscle lineage. Epigenetics : official journal of the DNA Methylation Society 2013, 8(3):317–332, [http://www.ncbi.nlm.nih.gov/pubmed/23417056].
- [61] Hogart A, Lichtenberg J, Ajay SS, Anderson S, Intramural NIH, Margulies EH, Bodine DM: Genome-wide DNA methylation profiles in hematopoietic stem and progenitor cells reveal overrepresentation of ETS transcription factor binding sites. Genome Research 2012, 22(8):1407–1418.
- [62] Chuang LSH, Ito Y: RUNX3 is multifunctional in carcinogenesis of multiple solid tumors. Oncogene 2010, 29(18):2605–2615, [http://www.ncbi.nlm.nih.gov/pubmed/20348954].
- [63] Li QL, Ito K, Sakakura C, Fukamachi H, Inoue KI, Chi XZ, Lee KY, Nomura S, Lee CW, Han SB, Kim HM, Kim WJ, Yamamoto H, Yamashita N, Yano T, Ikeda T, Itohara S, Inazawa J, Abe T, Hagiwara A, Yamagishi H, Ooe A, Kaneda A, Sugimura T, Ushijima T, Bae SC, Ito Y: Causal relationship between the loss of RUNX3 expression and gastric cancer. Cell 2002, 109:113–124, [http://www.ncbi.nlm.nih.gov/pubmed/11955451].
- [64] Kim WJ, Kim EJ, Jeong P, Quan C, Kim J, Li QL, Yang JO, Ito Y, Bae SC: RUNX3 inactivation by point mutations and aberrant DNA methylation in bladder tumors. Cancer Research 2005, 65(20):9347–9354, [http://www.ncbi.nlm.nih.gov/pubmed/16230397].
- [65] Lau QC, Raja E, Salto-Tellez M, Liu Q, Ito K, Inoue M, Putti TC, Loh M, Ko TK, Huang C, Bhalla KN, Zhu T, Ito Y, Sukumar S: RUNX3 is frequently inactivated by dual mechanisms of protein mislocalization and promoter hypermethylation in breast cancer. Cancer Research 2006, 66(13):6512–6520, [http://www.ncbi.nlm.nih.gov/pubmed/16818622].
- [66] Sato K, Tomizawa Y, Iijima H, Saito R, Ishizuka T, Nakajima T, Mori M: Epigenetic inactivation of the RUNX3 gene in lung cancer. Oncology Reports 2006, 15:129–135.
- [67] Weisenberger D, D Siegmund K, Campan M, Young J, Long T, Faasse M, Kang G, Widschwendter M, Weener D, Buchanan D, Koh H, Simms L, Barker M, Leggett B, Levine J, Kim M, French A, Thibodeau S, Jass J, Haile R, Laird P: CpG island methylator phenotype underlies sporadic microsatellite instability and is tightly associated with BRAF mutation in colorectal cancer. Nature Genetics 2006, 38(7):787–793, [http://discovery.ucl.ac.uk/8351/].
- [68] Lázcoz P, Muñoz J, Nistal M, Pestaña A, Encío IJ, Castresana JS: Loss of heterozygosity and microsatellite instability on chromosome arm 10q in neuroblastoma. Cancer Genetics and Cytogenetics 2007, 174:1–8, [http://www.ncbi.nlm.nih.gov/pubmed/17350460].
- [69] Song J, Ugai H, Kanazawa I, Sun K, Yokoyama KK: Independent repression of a GC-rich housekeeping gene by Sp1 and MAZ involves the same cis-elements. The Journal of biological chemistry 2001, 276(23):19897–904, [http://www.ncbi.nlm.nih.gov/pubmed/11259406].
- [70] Song J, Ugai H, Nakata-Tsutsui H, Kishikawa S, Suzuki E, Murata T, Yokoyama KK: Transcriptional regulation by zinc-finger proteins Sp1 and MAZ involves interactions with the same cis-elements. International Journal of Molecular Medicine 2003, 11(5):547–553, [http://www.ncbi.nlm.nih.gov/pubmed/12684688].
- [71] Baron B: Chapter 1. Breaking the Silence : The Interplay Between Transcription Factors and DNA Methylation. In Methylation - From DNA, RNA and Histones to Disseases and Treatment, InTech 2012:3–26.
- [72] Toyota M, Suzuki H: Epigenetic drivers of genetic alterations. Advances in Genetics 2010, 70(10):309–323, [http://www.ncbi.nlm.nih.gov/pubmed/20920753].
- [73] Esteller M, Toyota M, Sanchez-Cespedes M, Capella G, Peinado MA, Watkins DN, Issa JP, Sidransky D, Baylin SB, Herman JG: Inactivation of the DNA repair gene O6-methylguanine-DNA methyltransferase by promoter hypermethylation is associated with G to A mutations in K-ras in colorectal tumorigenesis. Cancer Research 2000, 60(9):2368–2371, [http://www.ncbi.nlm.nih.gov/entrez/query.fcgi?cmd=Retrieve“&db=PubMed“&dopt=Citation“&list“˙uids=10811111].
- [74] Yang J, Ferreira T, Morris AP, Medland SE, Madden PAF, Heath AC, Martin NG, Montgomery GW, Weedon MN, Loos RJ, Frayling TM, McCarthy MI, Hirschhorn JN, Goddard ME, Visscher PM: Conditional and joint multiple-SNP analysis of GWAS summary statistics identifies additional variants influencing complex traits. Nature Genetics 2012, 44(4):369–375, [http://www.nature.com/doifinder/10.1038/ng.2213].
- [75] Howie BN, Donnelly P, Marchini J: A flexible and accurate genotype imputation method for the next generation of genome-wide association studies. PLoS Genetics 2009, 5(6).
- [76] Howie B, Fuchsberger C, Stephens M, Marchini J, Abecasis GR: Fast and accurate genotype imputation in genome-wide association studies through pre-phasing. Nature Genetics 2012, 44(8):955–959, [http://www.nature.com/doifinder/10.1038/ng.2354].
- [77] Zhu Q, Ge D, Maia JM, Zhu M, Petrovski S, Dickson SP, Heinzen EL, Shianna KV, Goldstein DB: A genome-wide comparison of the functional properties of rare and common genetic variants in humans. The American Journal of Human Genetics 2011, 88(4):458–468, [http://www.pubmedcentral.nih.gov/articlerender.fcgi?artid=3071924“&tool=pmcentrez“&rendertype=abstract].
- [78] McClellan J, King MC: Genetic heterogeneity in human disease. Cell 2010, 141(2):210–217, [http://www.ncbi.nlm.nih.gov/pubmed/20403315].
- [79] Gibbs JR, Van Der Brug MP, Hernandez DG, Traynor BJ, Nalls MA, Lai SL, Arepalli S, Dillman A, Rafferty IP, Troncoso J, Johnson R, Zielke HR, Ferrucci L, Longo DL, Cookson MR, Singleton AB: Abundant Quantitative Trait Loci Exist for DNA Methylation and Gene Expression in Human Brain. PLoS Genetics 2010, 6(5):13, [http://www.pubmedcentral.nih.gov/articlerender.fcgi?artid=2869317“&tool=pmcentrez“&rendertype=abstract].
- [80] Zhang D, Cheng L, Badner JA, Chen C, Chen Q, Luo W, Craig DW, Redman M, Gershon ES, Liu C: Genetic control of individual differences in gene-specific methylation in human brain. The American Journal of Human Genetics 2010, 86(3):411–419, [http://www.pubmedcentral.nih.gov/articlerender.fcgi?artid=2833385“&tool=pmcentrez“&rendertype=abstract].
- [81] Degner JF, Pai Aa, Pique-Regi R, Veyrieras JB, Gaffney DJ, Pickrell JK, De Leon S, Michelini K, Lewellen N, Crawford GE, Stephens M, Gilad Y, Pritchard JK: DNase I sensitivity QTLs are a major determinant of human expression variation. Nature 2012, 482(7385):390–4, [http://www.ncbi.nlm.nih.gov/pubmed/22307276].
- [82] Pai AA, Cain CE, Mizrahi-Man O, De Leon S, Lewellen N, Veyrieras JB, Degner JF, Gaffney DJ, Pickrell JK, Stephens M, Pritchard JK, Gilad Y: The contribution of RNA decay quantitative trait loci to inter-individual variation in steady-state gene expression levels. PLoS genetics 2012, 8(10):e1003000, [http://dx.plos.org/10.1371/journal.pgen.1003000].
- [83] Gaffney DJ, Veyrieras JB, Degner JF, Pique-Regi R, Pai AA, Crawford GE, Stephens M, Gilad Y, Pritchard JK: Dissecting the regulatory architecture of gene expression QTLs. Genome biology 2012, 13:R7, [http://europepmc.org/articles/PMC3334587].
- [84] Moayyeri A, Hammond CJ, Valdes AM, Spector TD: Cohort Profile: TwinsUK and Healthy Ageing Twin Study. International Journal of Epidemiology 2012, [http://www.ncbi.nlm.nih.gov/pubmed/22253318].
- [85] Rechache NS, Wang Y, Stevenson HS, Killian JK, Edelman DC, Merino M, Zhang L, Nilubol N, Stratakis Ca, Meltzer PS, Kebebew E: DNA methylation profiling identifies global methylation differences and markers of adrenocortical tumors. The Journal of clinical endocrinology and metabolism 2012, 97(6):E1004–13, [http://www.ncbi.nlm.nih.gov/pubmed/22472567].
- [86] Gabriel KR, Odoroff CL: Biplots in biomedical research. Statistics in Medicine 1990, 9(5):469–485, [http://www.ncbi.nlm.nih.gov/pubmed/2349401].
- [87] Liaw A, Wiener M: Classification and Regression by randomForest. R News 2002, 2(3):18–22, [http://cran.r-project.org/doc/Rnews/].
- [88] Hsu Cw, Chang Cc, Lin Cj: A Practical Guide to Support Vector Classification. Tech. rep., National Taiwan University 2010, [http://citeseerx.ist.psu.edu/viewdoc/download?doi=10.1.1.6.3096“&rep=rep1“&type=pdf].
- [89] Arora M, Kanjilal U, Varshney D: Efficient and Intelligent Information Retrieval using Support Vector machine ( SVM ). International Journal of Soft Computing and Engineering 2012, 1(6):39–43.
- [90] Meyer D, Dimitriadou E, Hornik K, Weingessel A, Leisch F: e1071: Misc Functions of the Department of Statistics (e1071), TU Wien 2012, [http://cran.r-project.org/package=e1071].
- [91] Meyer LR, Zweig AS, Hinrichs AS, Karolchik D, Kuhn RM, Wong M, Sloan CA, Rosenbloom KR, Roe G, Rhead B, Raney BJ, Pohl A, Malladi VS, Li CH, Lee BT, Learned K, Kirkup V, Hsu F, Heitner S, Harte RA, Haeussler M, Guruvadoo L, Goldman M, Giardine BM, Fujita PA, Dreszer TR, Diekhans M, Cline MS, Clawson H, Barber GP, Haussler D, Kent WJ: The UCSC Genome Browser database: extensions and updates 2013. Nucleic acids research 2013, 41(Database issue):D64–9, [http://www.pubmedcentral.nih.gov/articlerender.fcgi?artid=3531082“&tool=pmcentrez“&rendertype=abstract].
- [92] Fogarty J, Baker RS, Hudson SE: Case studies in the use of ROC curve analysis for sensor-based estimates in human computer interaction. In GI 05 Proceedings of Graphics Interface 2005, ACM International Conference Proceeding Series. Edited by Inkpen K, Van De Panne M, Canadian Human-Computer Communications Society, Canadian Human-Computer Communications Society 2005:129–136, [http://www.cs.cmu.edu/afs/cs.cmu.edu/misc/mosaic/common/omega/Web/People/jfogarty/publications/gi2005.pdf].