Synchrotron radiation from a runaway electron distribution in
tokamaks
A. Stahl1,
M. Landreman2, G. Papp1,3, E. Hollmann4,
T. Fülöp1
1 Department of Applied Physics,
Nuclear Engineering, Chalmers University of Technology and
Euratom-VR Association, SE-412 96 Göteborg, Sweden
2 Plasma Science
and Fusion Center, MIT, Cambridge, MA, 02139, USA
3 Department of Nuclear Techniques, Budapest University of Technology and Economics, Association EURATOM, H-1111 Budapest, Hungary
4
Center for Energy research, University of California, San Diego, La Jolla, CA, 92093-0417, USA
Abstract
The synchrotron radiation emitted by runaway electrons in a fusion plasma provides information regarding the particle momenta and pitch-angles of the runaway electron population through the strong dependence of the synchrotron spectrum on these parameters. Information about the runaway density and its spatial distribution, as well as the time evolution of the above quantities, can also be deduced. In this paper we present the synchrotron radiation spectra for typical avalanching runaway electron distributions. Spectra obtained for a distribution of electrons are compared to the emission of mono-energetic electrons with a prescribed pitch-angle. We also examine the effects of magnetic field curvature and analyse the sensitivity of the resulting spectrum to perturbations to the runaway distribution. The implications for the deduced runaway electron parameters are discussed. We compare our calculations to experimental data from DIII-D and estimate the maximum observed runaway energy.
I Introduction
Understanding the process of runaway beam formation and loss in tokamaks is of great importance, due to the potentially severe damage these electrons may cause in disruptions. In present tokamaks, runaway electrons have energies between a few hundred keV to tens of MeV, and in a next-step device like ITER, they are projected to reach a maximum energy of up to 100 MeV pappRMP . Runaway electrons emit synchrotron radiation winske ; finken ; jaspers ; yu , the spectrum of which depends on the velocity-space distribution of the radiating particles. Therefore, the spectrum can be used to obtain information about the departure of the velocity distribution from isotropy and about the energy of the particles. The emitted radiation can also be an energy loss mechanism andersson , although in tokamaks this loss is not appreciable unless the electrons have very large energies, above 70 MeV finken .
Many theoretical studies of the synchrotron radiation of the energetic population have been done before, either using approximate electron distribution functions or assuming straight magnetic field lines robinson ; moghaddam ; kato . In several studies, the synchrotron emission from a single particle is used as an approximation for the entire runaway distribution jaspers ; yu , using a specific momentum and pitch-angle for the electrons, often identified as the maximum momentum and pitch-angle of the electrons in the runaway beam. In the present work we use an electron distribution function typical of avalanching runaway electron populations in tokamak disruptions. As we will show, taking into account the whole distribution is important, since synchrotron radiation diagnostics based on single particle emission can give misleading results. Furthermore, we will illustrate that synchrotron radiation can be used to detect signs of modification of the electron distribution, which can occur due to for instance wave-particle interaction.
The structure of the paper is as follows. In Sec. II we give several expressions for the radiated synchrotron power including the effect of field-curvature. We also discuss the applicability of these expressions in different contexts. Section III is devoted to the analysis of the synchrotron radiation spectrum from an avalanching runaway electron distribution. We will describe the parametric dependences on magnetic field, density, temperature, effective charge and electric field. In Sec. IV we discuss the potential use of synchrotron radiation as a diagnostic. We also present a comparison between the synchrotron spectrum calculated for the avalanching runaway electron distribution and an experimentally measured synchrotron spectrum from DIII-D. Our conclusions will be summarized in Sec. V.
II Synchrotron emission formulas
The power radiated by an electron with Lorentz factor at wavelength in the case of straight magnetic field lines is bekefi
| (1) |
where is the electron charge, is the speed of light, is the vacuum permittivity, , , is the electron rest mass, is the magnetic field, ∥ denotes the component along the magnetic field and is the modified Bessel function of the second kind. The radiation is emitted in a narrow beam in the parallel direction due to relativistic effects bekefi . In a tokamak, the effects of magnetic field line curvature and curvature drift have to be taken into account. This has been done in Ref. pankratov , where the following expression was obtained
| (2) |
where ,
| (3) |
| (4) |
is the tokamak major radius, is the Bessel function and its derivative. The integrands in Eq. (2) are highly oscillatory and the calculation of synchrotron spectra can become computationally heavy. This motivates examining more approximate formulas which are less complex, especially when considering possible diagnostic applications. In equations (21) and (26) of Ref. pankratov , two limits of Eq. (2) are given. These two limits are obtained by first expanding in , which can be translated to a condition for the wavelength . Then, to obtain the first of the two expressions, Eq. (2) is also expanded in the smallness of the argument of the Bessel functions, leading to the condition . The resulting approximative formula is
| (5) |
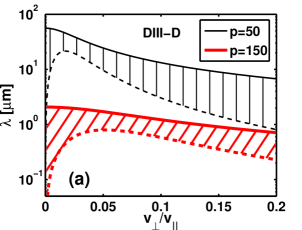
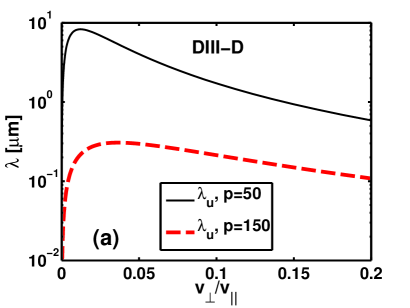
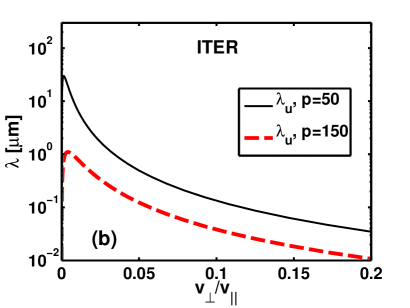
where is the modified Bessel function. was the expression used to calculate the synchrotron radiation of an avalanching population of positrons in Ref. fuloppapp and in fitting of the synchrotron spectrum in the optical range in DIII-D in Ref. yu . The two conditions required for validity of Eq. (5) can be summarized as , which leads to a rather narrow validity range for . Figure 1(a) and (b) show the range of wavelengths for which is valid () for different runaway momenta in DIII-D-size and ITER-size tokamaks, respectively. Note that the wavelength should be much smaller than the solid line(s) in the figure for to be valid. It is clear that for wavelengths in the 0.1-1 m range (as in the measurements described in Ref. yu ), the approximative formula is only valid for particles with large normalized momenta , and not necessarily for all values of .
To obtain the second limit of Eq. (2) (equation (26) in Ref. pankratov ),
| (6) |
has to be fulfilled. Equation (2) then simplifies to
| (7) |
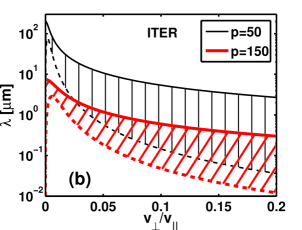
The condition in Eq. (6) is more strict than the one stemming from ; it is only necessary to fulfill Eq. (6) for Eq. (7) to be valid. Figure 2 (a) and (b) show the upper bound for the wavelength given by Eq. (6). We conclude that for the visible part of the spectrum, could be a suitable approximative formula for runaway electron beams with and . In the opposite case, when and are large then either the full expression , or in some cases , can be used.
In general, the difference between the emitted power given by (valid in the cylindrical limit) and (including field line curvature) is not very large if we consider only emission by a single particle. Single particle synchrotron spectra calculated by and , as well as the approximate formulas and are shown in Fig. 3(a) and (b) for particles with normalized momentum (corresponding to a particle energy of roughly 25 MeV) and in two different tokamaks. For such particles, the peak emission is for wavelengths of a few m (the near infrared part of the spectrum). Figure 3(a) shows that for medium-sized tokamaks (such as DIII-D), is closely approximated by . This is not surprising, as is valid in most of the wavelength range considered (especially for shorter wavelengths), whereas is only valid for longer wavelengths for these parameters. For large tokamaks (such as ITER), is best approximated by , as the effects of field curvature become small for such large major radii. Figure 3(b) shows that is not a good approximation in this case, which is expected, since is not valid in this region.
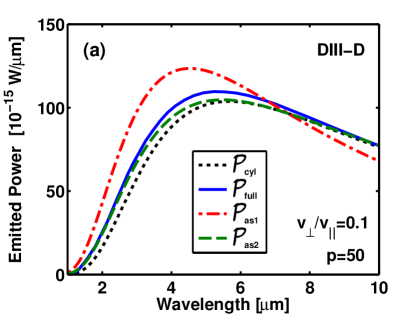
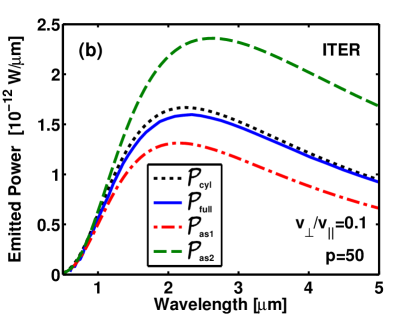
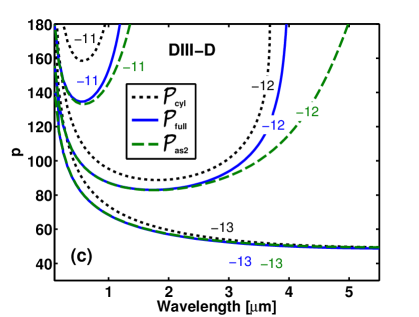
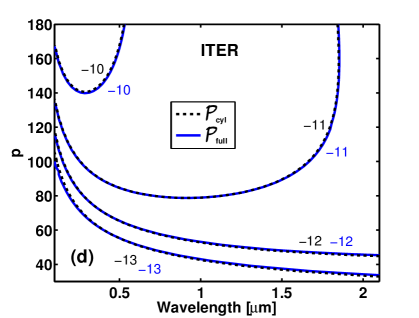
Figure 3(c) and (d) investigate the energy dependence of the above conclusions. The quantity plotted is . Figure 3(c) confirms that is a good approximation to in DIII-D for a wide range of runaway energies. For the highest energies, agreement is still very good for short wavelengths, but less so for longer wavelengths. This agrees with Fig. 2(a), which indicates that is no longer valid for high energies and long wavelengths. Figure 3(c) also shows that for a tokamak this size, the difference between and increases with , and using is not recommended if quantitative agreement is sought. In an ITER-like device, however, Fig. 3(d) indicates that approximates very well over the whole energy range considered. Formally, reduces to when and (where this latter relation is equivalent to ).
III Spectrum from runaway electron distributions
In Refs. jaspers ; yu the synchrotron spectrum is calculated by multiplying the single particle spectrum by the number of runaways with a specific pitch-angle and momentum. In this section we investigate how the synchrotron spectrum changes if we take into account the whole runaway electron distribution instead of the single particle approximation considered above. We calculate the synchrotron emission integrated over a runaway electron distribution using
| (8) |
where is the runaway distribution function, is one of the single particle emission formulas discussed in the previous section, is the cosine of the pitch-angle and is the runaway electron density. The runaway region of momentum space is defined by a separatrix such that all particles with are considered runaways smith . Here, is the parallel electric field normalized to the critical field , with the collision time for relativistic electrons, the classical electron radius, the electron density and the Coulomb logarithm. As we normalize to , is the average emission per runaway. The alternative choice of normalizing by the runaway current was also considered, and it was found that all results presented below are essentially unchanged aside from an overall scale factor, since the speed of all runaways is nearly .
In large tokamak disruptions, secondary runaway generation is expected to dominate over primary generation, in which case the runaway distribution will grow approximately exponentially in time: . In this case of exponential growth, the electron distribution can be approximated by fulop2006 :
| (9) |
where , is the effective ion charge and , and the momentum space coordinates are related to and through and . Derivation of Eq. (9) assumes strong anisotropy () and high electric field (). In addition to the lower boundary of the runaway region, an upper cut-off of the distribution will be introduced. This cut-off is physically motivated by the finite life-time of the accelerating electric field and the presence of loss mechanisms such as radiation and radial transport.
As it was shown in the previous section, the inclusion of field curvature effects via the use of rather than had little effect on the synchrotron emission of a single particle in an ITER-sized device. The effect is larger in smaller devices. When the complete runaway distribution is taken into account, these conclusions still hold. Figure 4 shows synchrotron spectra calculated using Eq. (8) together with the distribution in Eq. (9) and the emission formulas , , and . The calculation was performed for both a DIII-D-size and an ITER-size device, as the field curvature is what separates the different formulas. The parameters used in the calculation in Fig. 4 are maximum normalized momentum (corresponding to a maximum runaway energy of roughly 50 MeV), parallel electric field V/m, effective charge , background electron density m-3 and background plasma temperature eV. The relatively low temperature is what is expected after a thermal quench in a disruption. In DIII-D, the post thermal-quench temperature is estimated to be as low as eV hollmann .
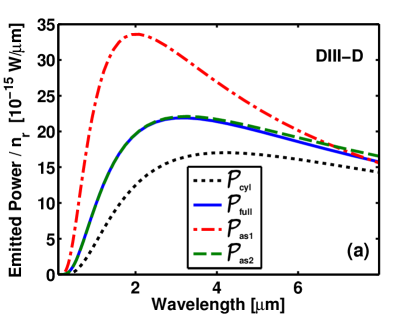
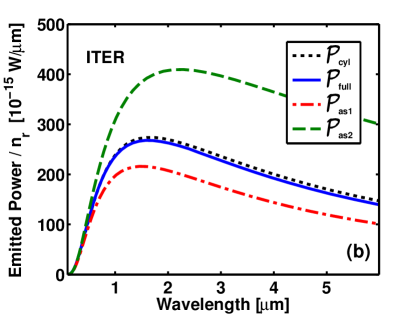
Figure 4(a) shows that in DIII-D, is well approximated by , especially in the short wavelength slope region of the spectrum. In ITER, is a good approximation, as shown in Fig. 4(b). This is expected since the field curvature is much smaller here. These results are consistent with the conclusion regarding single particles in Fig. 3. For simplicity, throughout the remainder of this paper we will use when calculating synchrotron spectra (except for the comparison with DIII-D data in Sec. B). Synchrotron spectra calculated by and are qualitatively similar for both small and large machines, and are also often quantitatively similar for large machines.
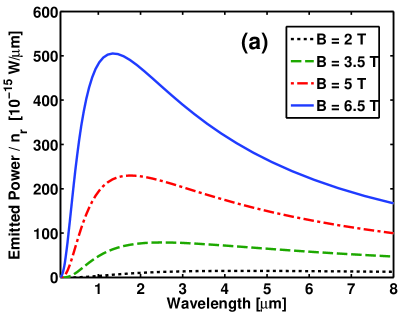
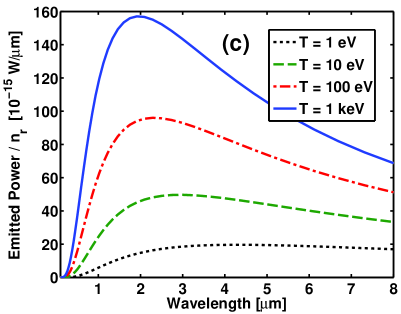
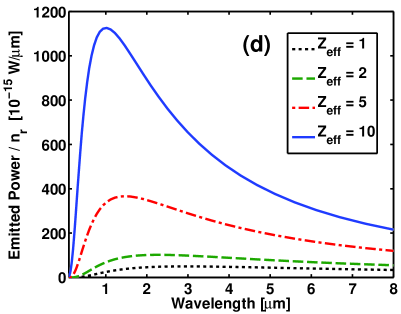
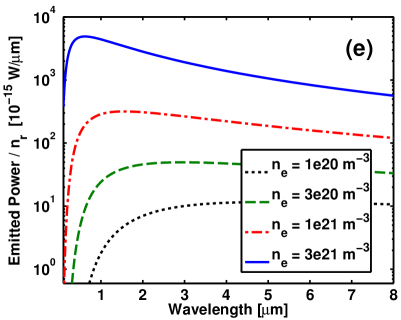
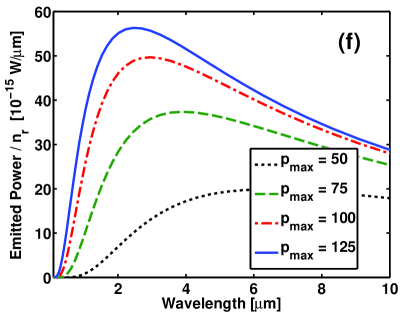
The single particle synchrotron emission formulas are independent of the plasma temperature, effective charge, density and the strength of the electric field. These quantities do however affect the shape of the runaway distribution, which in turn affects the synchrotron emission. Figure 5 shows scans in these parameters, the magnetic field and maximum momentum of the distribution. The baseline scenario corresponds to the parameters used in Fig. 4 together with T. Since is used, there is no dependence on .
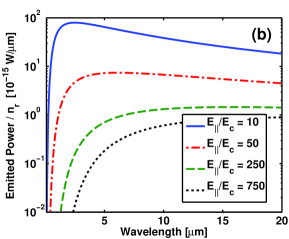
Figure 5 shows that the average synchrotron emission increases with , , , and , but decreases with increasing electric field strength. The dependence on and is particularly strong, and we note that the average emission can vary over several orders of magnitude. This variation is completely missing from the single particle approximation used in Section II. If, as a disruption mitigation technique, a large amount of material is injected into the plasma (for instance in the form of a massive gas injection), the increase in density would lead to increased synchrotron emission from the runaways (if the mitigation is unsuccessful). This could give the impression of an increase in the number of runaways even though this is not necessarily the case. The figure also shows that the wavelength of peak emission shifts appreciably with varying parameter values. Generally, an increased average emission is accompanied by a shift of the peak emission towards shorter wavelengths. The total synchrotron emission of a single particle scales roughly as jaspers . Thus, the most strongly emitting particles are highly energetic with large pitch-angle. These particles emit at shorter wavelengths, so the shift of the wavelength of peak emission with increased total emission is expected.
In light of the particle energy dependence of the emitted synchrotron power, the decrease in emission with increasing electric field strength may seem a little surprising, as a stronger accelerating field leads to more highly energetic particles. The explanation can be found in the shape of the runaway beam. Figure 6 shows the runaway distribution, Eq. (9), in ()-space for three of the parameter sets in the electric field scan in Fig. 5(b). The figure shows that the distribution, in addition to being extended in , becomes more narrow in as the electric field strength increases. This leads to lower average-per-particle emission by virtue of the pitch-angle dependence of , despite the presence of a greater number of highly energetic particles.

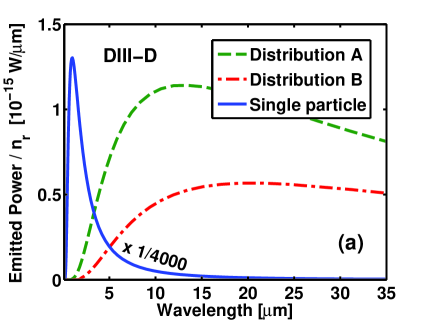
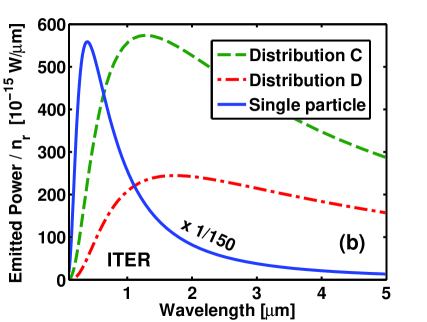
Figure 7 shows a comparison of the average synchrotron spectrum calculated for the runaway distribution Eq. (9) and for a single particle. The figure clearly shows that using the single-particle emission overestimates the synchrotron emission per particle by several orders of magnitude. (Note that the values for the emitted power per particle were divided by a large number to fit in the same scale.) The overestimation is caused by the fact that the single-particle approximation assumes that all particles emit as much synchrotron radiation as the most strongly emitting particle in the actual distribution, as discussed in Section I. Furthermore, the wavelength of peak emission is shifted towards shorter wavelengths when using this approximation. Using the single-particle approximation can thus give misleading results regarding both the spectrum shape and the total emission strength.
IV Synchrotron radiation as a runaway electron diagnostic
The interest in the synchrotron emission of runaways is primarily motivated by its potential as a runaway diagnostic. In principle, the distribution can be determined by acquiring an experimental synchrotron spectrum and comparing it to calculations using Eq. (8) for a range of , provided all other relevant parameters are known. There are however several problems with this approach. First, the complete synchrotron spectrum is not known. Detectors are only sensitive in a limited wavelength range, which is likely to also contain contaminating radiation from other sources in the plasma. Second, the relevant plasma parameters are not always well known, especially during disruptions. This can lead to significant uncertainty in the computed synchrotron spectrum, as the parameter scans in Fig. 5 indicated. Using a single particle approximation for the runaway distribution seemingly avoids the second issue, but as we have seen, it also ignores factors that can influence the emission by orders of magnitude.
A Spectrum slope and maximum runaway energy
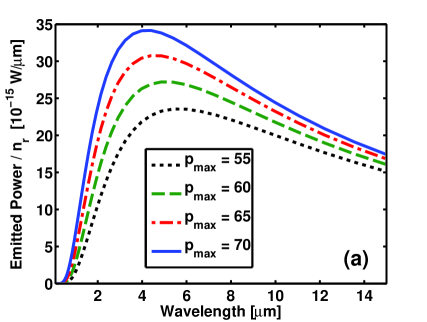
Simple measurements of the synchrotron power for different wavelengths on the steep slope of the spectrum have been used to estimate the runaway energy jaspers , using the single particle emission formulas and assuming mono-energetic runaways with well-defined pitch-angle. In this case there is a monotonic relationship between the slope and the particle energy (as the wavelength of peak emission decreases monotonically with increasing ). The slope can be obtained through a relative measurement of the synchrotron power at two wavelengths, . However, as the runaway distribution is sensitive to the plasma parameters, when taking it into account there is in general no such simple relationship between the slope of the spectrum and the maximum runaway energy in the distribution. If all other parameters are fixed the relation still holds, as is shown in Fig. 8(a). This follows naturally from the relation for single particles, as when is increased, more particles that emit at short wavelengths are included, and the average emission correspondingly shifts towards shorter wavelengths, affecting the slope. But if the plasma parameters are uncertain, the slope can be misleading. Figure 8(b) shows multiple spectra with the same slope for m and m. Using only a measurement of in the above range, they cannot be distinguished, despite the appreciable difference in average emission. This type of two-point slope measurement can be performed using physical wavelength filters placed in front of the detector jaspers , in which case measurements are constrained to specific and that cannot be easily changed. The of the different spectra in Fig. 8(b) range from 50 to 90, with only modest variation of the plasma parameters , and (all of which are hard to estimate during disruptions). Thus, if the plasma properties are uncertain, there is no clear correlation between and of the distribution. Another weakness of using the slope is the difficulty in asserting that both measurement points are actually located on the approximately linear part of the spectrum. As the plasma parameters change, the peak of the spectrum may shift (as discussed in connection with Fig. 5). Choosing and that are suitable for a wide range of different conditions (as when using physical filters) is not easy. Instead of using the slope directly, one should calculate the emission for an assumed beam-like distribution function (e.g. similar to Eq. (9)), and iteratively find the , which fits the synchrotron spectrum best.

B Synchrotron emission in DIII-D


It is interesting to investigate how a synchrotron spectrum calculated for an avalanching distribution compares with an experimentally measured synchrotron spectrum from DIII-D. In the specific experimental scenario we consider (shot number 146704 and time t=2290 ms hollmann2013 ), the loop voltage is , the density and the plasma current , measured near the end of a runaway plateau phase. The runaway density can be estimated from the current using , where is the area of the runaway beam. The runaway beam radius in this case was around 20 cm. The temperature is assumed to be and . For synchrotron emission by mono-energetic runaway electrons the conversion to the measured brightness can be done using Eq. (2) in Ref. yu :
| (10) |
where is the major radius (of the runaway beam) and is the tangent of the particle pitch-angle. Taking into account the runaway distribution, we calculate the brightness as
| (11) |
where and , and the integration limits for the pitch-angle are , . Since we consider the visible part of the spectrum, all below produce identical results, as only the highest energy particles emit in this range. Equation (10) is strictly valid for yu . As we are interested in the complete distribution with both small and small , we use instead the effective viewing aperture . Here, cm is the lens aperture of the detector and m is the distance between the detector and the runaway beam. Introducing into Eq. (11), we find
| (12) |
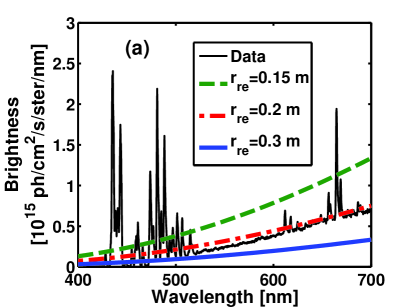
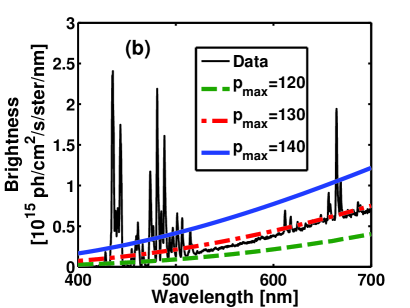
Figure 9 shows a comparison of spectra calculated using Eq. (12) together with and Eq.(9), and the experimentally measured spectra for different runaway beam radii (the beam is assumed to have circular cross-section), , loop voltages and densities. The good agreement for and leads us to estimate the maximum runaway electron energy to be around 65 MeV. This is much larger than the mean energy of several MeV estimated from other diagnostics hollmann2013 .

For comparison, we also fit the experimental data with synchrotron spectra from a mono-energetic runaway population (using Eq. 10), for different particle energies and pitch-angles. As in Ref. yu we assume that 1% of the runaway population (calculated with ) has the specific energy considered. The results are shown in Fig. 10. This fitting procedure gives a lower estimate for the maximum runaway energy, at about 40-50 MeV, depending on pitch-angle.
C Effect of wave-particle interaction
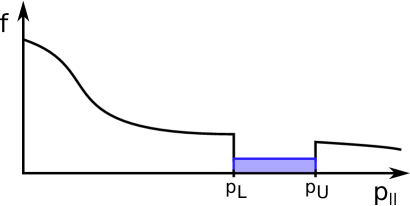
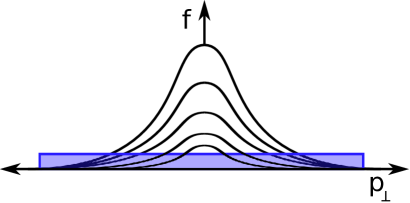
Another instance where the synchrotron spectrum from a complete runaway distribution is useful is in investigations of mechanisms that affect the shape of the distribution itself. One such mechanism is resonant wave-particle interactions, and here we consider their effect on the synchrotron spectrum through a modification of part of the distribution given in Eq. (9). A runaway distribution is normally strongly peaked around the parallel direction (), i.e. it has a high degree of anisotropy in momentum space (see for instance Fig. 6). Wave-particle interaction tends to drive the distribution towards isotropy through pitch-angle scattering of electrons with resonant momenta pokol . A simple way to simulate the decrease in anisotropy is to introduce a flat profile in part of momentum space, as indicated in Fig. 11.
The usual integral for the total emitted power, Eq. (8), is split up into three regions in momentum-space. The first and third parts remain unmodified, with the usual distribution function . In the second (middle) part, the distribution function is assumed to be flat. We denote the lower and upper boundaries of this region and , respectively. The momentum space volume of the shaded block in the figure should be the same as that of the part of the distribution it replaces, which gives us a condition from which to calculate the appropriate height of the block. The integration of the normal distribution is taken over the entire -range (). As the distribution decreases exponentially with decreasing , the contribution from particles with low is very small. When the modifications are introduced, however, the contribution could be substantial, and we need to restrict the extent of the block for the modified part of the distribution in (). The introduction of can be seen as a compensation for the fact that in reality the pitch-angle scattered particles are not evenly distributed in . Letting be a constant distribution where represents the height of the block, and equating the momentum space volume of the block with that of the part of the distribution it replaces, we have
| (13) |
We may solve this for , and obtain
| (14) |
as the block height that conserves the total number of particles. We emphasize that the above modification represents a “worst case scenario” in terms of the effect on the spectrum. In a more realistic case, the modifications would be less severe.
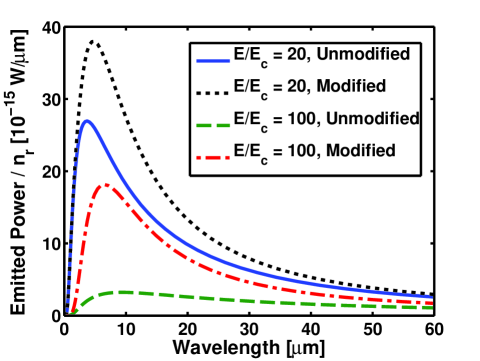
The analytical avalanche distribution (Eq. 9) was modified according to the above, with and since this is a typical range where wave-particle interactions manifest pokol . The maximum pitch-angle in the modified region was set to (), which is qualitatively consistent with experimental estimates of the maximum runaway pitch-angle jaspers ; yu . In Fig. 12, modified distribution-integrated synchrotron spectra are shown and compared to those of unmodified distributions. From the figure it is clear that there is an appreciable increase in the average emission of the runaways as a result of the modifications to the distribution. Again, this increase is related to the pitch-angle dependence of . The isotropization broadens the distribution in pitch-angle which leads to a higher average emission. Due to the difference in the synchrotron spectrum, the onset of a particle-wave resonance should be detectable. However, as we have seen before, there are also other changes in plasma parameters that could have a similar effect on the synchrotron emission.
Our goal in this exercise is not to explore the parameter space of artificially modified distributions - the modifications introduced above are too crude to lead to quantitative conclusions - but rather to illustrate the sensitivity of the synchrotron spectrum to the details of the runaway distribution. The analysis here shows that the spectrum from a distribution modified by particle-wave interaction can imply runaway parameters distinctly different from those that are actually present, especially if only a limited part of the spectrum is considered. Failure to include such effects can thus lead to incorrect conclusions regarding the runaway beam properties.
V Conclusions
The synchrotron emission spectrum can be an important diagnostic of the runaway electron population. In some previous work, synchrotron spectra have been interpreted under the assumption that all runaways have the same energy and pitch-angle. In practice, however, runaway electrons have a wide distribution of energies and pitch-angles. When taking into account the full distribution, the most suitable approximative emission formula may not be the one that has been used in previous work (). Instead, depending on the major radius of the device and the actual runaway electron distribution, either (for large devices) or (for medium-sized devices) are more suitable. Although the single particle synchrotron emission formulas do not depend on the plasma temperature, effective charge, density or electric field strength, the total synchrotron emission is sensitive to these parameters, as they determine the shape of the runaway distribution.
We have shown that the single-particle emission overestimates the synchrotron emission per particle by orders of magnitude, and the wavelength of the peak emission is shifted to shorter wavelenths compared to the spectrum from an avalanching runaway electron distribution. We have also illustrated that using the slope of the spectrum for estimating the runaway energy can be misleading, and in general one should calculate the emission from an assumed approximative distribution and iteratively find the maximum runaway energy to fit the synchrotron spectrum. Finally, through a comparison with an experimental synchrotron spectrum from DIII-D, we have estimated the maximum runaway electron energy in that particular experimental scenario to be around 65 MeV.
Acknowledgments
The authors are grateful to Y. Kazakov for fruitful discussions. This work was funded by the European Communities under Association Contract between EURATOM, HAS and Vetenskapsrådet. The views and opinions expressed herein do not necessarily reflect those of the European Commission. M.L. was supported by the United States Department of Energy’s Fusion Energy Postdoctoral Research Program administered by the Oak Ridge Institute for Science and Education. E.H. was supported in part by the United States Department of Energy under DE-FG02-07ER54917.
References
- [1] G. Papp, M. Drevlak, T. Fülöp, and G. I. Pokol, Plasma Phys. and Control. Fusion 53, 095004 (2011).
- [2] D. Winske, Th. Peter, and D. A. Boyd, Phys. Fluids 26, 3497 (1983).
- [3] K. H. Finken, J. G. Watkins, D. Rusbult, W. J. Corbett, K. H Dippel, D. M. Goebel, and R. A. Moyer, Nucl. Fusion 30, 859 (1990).
- [4] R. Jaspers, N. J. Lopes Cardozo, A. J. H. Donn, H. L. M. Widdershoven, and K. H. Finken, Rev. Sci. Instrum. 72, 466 (2001).
- [5] J. H. Yu, E. M. Hollmann, N. Commaux, N. W. Eidietis, D. A. Humphreys, A. N. James, T. C. Jernigan, and R. A. Moyer, Phys. Plasmas 20, 042113 (2013).
- [6] F. Andersson, P. Helander, and L.-G. Eriksson, Phys. Plasmas 8, 5221 (2001).
- [7] P. A. Robinson, Plasma Phys. Control. Fusion 27, 1037 (1985).
- [8] E. Moghaddam-Taaheri and L. Vlahos, Phys. Fluids 31, 99 (1987).
- [9] K. Kato and I. H. Hutchinson, Phys. Fluids 30, 3809 (1987).
- [10] G. Bekefi, Radiation Processes in Plasmas, Wiley (1966).
- [11] I. M. Pankratov, Plasma Phys. Reports 25, 145 (1999).
- [12] T. Fülöp and G. Papp, Phys. Rev. Lett. 108, 225003 (2012).
- [13] H. Smith, P. Helander, L.-G. Eriksson, and T. Fülöp, Phys. Plasmas 12, 122505 (2005).
- [14] T. Fülöp, G. Pokol, P. Helander, and M. Lisak, Phys. Plasmas 13, 062506 (2006).
- [15] E.M. Hollmann, P.B. Parks, D.A. Humphreys, N.H. Brooks, N. Commaux, N. Eidietis, T.E. Evans, R. Isler, A.N. James, T.C. Jernigan, J. Muñoz, E.J. Strait, C. Tsui, J. Wesley, and J.H. Yu, Nucl. Fusion 51, 103026 (2011).
- [16] E.M. Hollmann, M.E. Austin, J.A. Boedo, N.H. Brooks, N. Commaux, N.W. Eidietis, D.A. Humphreys, V.A. Izzo, A.N. James, T.C. Jernigan, A. Loarte, J. Martin-Solis, R.A. Moyer, J.M. Muñoz-Burgos, P.B. Parks, D.L. Rudakov, E.J. Strait, C. Tsui, M.A. Van Zeeland, J.C. Wesley, and J.H. Yu, Nucl. Fusion 53, 083004 (2013).
- [17] G. Pokol, T. Fülöp, and M. Lisak, Plasma Phys. and Control. Fusion 50, 045003 (2008).