A plausible (overlooked) super-luminous supernova in the SDSS Stripe 82 data
Abstract
We present the discovery of a plausible super-luminous supernova (SLSN), found in the archival data of Sloan Digital Sky Survey (SDSS) Stripe 82, called PSN 000123+000504. The supernova peaked at mag in the second half of September 2005, but was missed by the real-time supernova hunt. The observed part of the light curve (17 epochs) showed that the rise to the maximum took over 30 days, while the decline time lasted at least 70 days (observed frame), closely resembling other SLSNe of SN2007bi type. Spectrum of the host galaxy reveals a redshift of and the distance modulus of mag. Combining this information with the SDSS photometry, we found the host galaxy to be an LMC-like irregular dwarf galaxy with the absolute magnitude of mag and the oxygen abundance of . Our SLSN follows the relation for the most energetic/super-luminous SNe exploding in low-metallicity environments, but we found no clear evidence for SLSNe to explode in low-luminosity (dwarf) galaxies only. The available information on the PSN 000123+000504 light curve suggests the magnetar-powered model as a likely scenario of this event. This SLSN is a new addition to a quickly growing family of super-luminous SNe.
Subject headings:
supernova: general - supernova: individual (PSN 000123+000504)1. Introduction
There is a growing number of supernovae (SNe) whose brightness greatly exceeds that of “classic” SNe (e.g. Quimby et al., 2011), hence not fitting into any of the standard SNe classes. It is widely assumed, albeit somewhat arbitrarily, that an SN becomes an SLSN if its absolute magnitude exceeds mag in any filter, what corresponds to the peak luminosity of erg/s. During the last few years most of SLSN events have been discovered by several untargeted surveys, for example the Catalina Real-Time Transient Survey (Drake et al., 2009) and the Palomar Transient Factory (Law et al., 2009; Rau et al., 2009). It was found that these over-luminous SNe tend to prefer low-metallicity, low-mass dwarf galaxies (Prieto et al., 2008; Stanek et al., 2006; Neill et al., 2011).
The SLSNe are associated with deaths of the most massive stars, which means that they have impact on the chemical evolution and re-ionization of the Universe. The SLSNe explosions are probably induced by various physical mechanisms than other, more common types of SNe, which makes these transients more interesting. However, still little is known about the nature of SLSNe, because of insufficient size and low heterogeneity of the available sample (for a recent review, see Gal-Yam, 2012). The SLSNe family has been divided into three classes: SLSN-I (hydrogen-poor), SLSN-II (hydrogen-rich), and SLSN-R (radioactively powered). SLSN-R type seems to be the best understood one as these SNe are powered by large amounts of radioactive 56Ni produced during the explosions of massive stars. The mechanism of the most commonly observed SLSN-II class can be explained by an explosion within a thick hydrogen envelope, but the proper energy source is still unknown. The final group, SLSN-I explosions, is probably a result of pair-instability mechanism, but these SNe are not powered by radioactivity. Recently a different statement was presented by Inserra et al. (2013). These authors claim that type SLSN-I can be classified as SLSN-Ic, because their spectral features are similar to typical Ic explosions, i.e. the blue continuum with broad absorption lines of intermediate mass elements such as C, O, Si, and Mg, with no clear evidence of H and He. Moreover, the energy deposited by newborn magnetars was favored as the power source for these events instead of the pair-instability mechanism. A semi-analytical diffusion model with energy input from the spin-down of a magnetar reproduces the extensive light curve data well. The ejecta velocities and temperatures required by the model predictions are in a reasonable agreement with those determined from the photometric and spectroscopic observations. There are therefore some discrepancies in views on the real nature of the SLSNe, which is caused by a very small number of known examples of such explosions.
In this paper, we present the discovery of another object belonging to the class of SLSNe found in the SDSS Stripe 82 multi-band data. To date there are 30 known SLSNe, therefore each new event observed is a valuable addition to the class. With its peak brightness of mag (without including the -correction and host galaxy extinction) and the optical light curve shape, it closely resembles SLSNe. The subsequent sections include a detailed description of our findings.
2. The Supernova
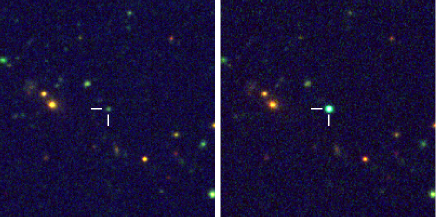
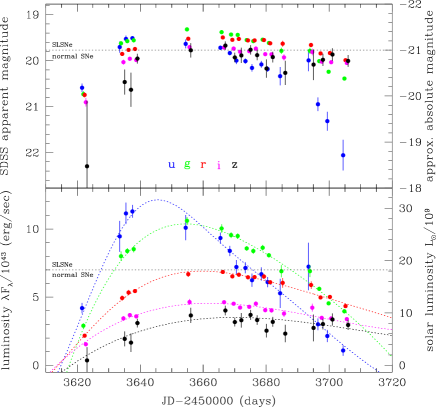
The Sloan Digital Sky Survey (SDSS) repeatedly observed several selected areas of the sky. One of them, called Stripe 82, covering 270 deg2 of the sky, was specifically targeted for multiple photometric observations (Ivezić et al. 2007) in the hunt for type Ia supernovae explosions. There were about 500 SNe found in near-real-time data analysis, many of them followed-up spectroscopically (Frieman et al. 2008; Sako et al. 2008). The Stripe 82 covers the area of , . We used the catalog of Bramich et al. (2008) that provided not only the photometric and astrometric time-series for almost 4 million objects, but also numerous high-level data products, useful for an effective querying of the catalog. We aimed at transients which lasted between 40 and 150 days and had mean luminosities brighter than 20.5 mag in and bands. In addition, we only looked for objects with a significant excess in blue at the peak. We found about 200 potentially interesting objects, most of them turning out to be previously found, known SNe (Frieman et al. 2008, Sako et al. 2008). From the remainder we selected one transient with well covered light curve, exhibiting long rise and long decline, as a possible SLSN. The transient was also located on top of a faint galaxy-like object (according to the SDSS Data Release 9; DR9111http://skyserver.sdss3.org/public/en/tools/chart/navi.asp), which ruled out the possibility for a cataclysmic variable transient. The coordinates of the SN are =(00:01:23.36,+00:05:04.02) and the finding chart is presented in Figure 1. We dubbed the supernova with PSN 000123+000504 aka “Vernal Equinox Supernova 2005” because of its position very close to the beginning of the equatorial coordinate system. The observed light curve of the SN is shown in Figure 2. It is also available in tabular form for the observed magnitudes (Table 1), absolute magnitudes (Table 2), and luminosity (Table 3).
It is not clear why the object was not found by a regular search for SNe during the Stripe 82 observations, which were designed for real-time supernova hunt. Most probably, the host galaxy was not recognized as a galaxy due to its compactness and blue color, suggesting a galactic progenitor of some sort of a cataclysmic variable. Only after producing the final SDSS images of this region (in SDSS DR9) the object was classified as a galaxy.
While we do not have the spectrum for the SN during explosion, we can only rely on post-explosion observations. In the next section we present the evidence for the SN host galaxy redshift of which corresponds to the distance modulus of mag and the luminosity distance of 1428 Mpc, assuming a standard CDM cosmological model with . The Milky Way extinctions in the direction of the SN are mag (Schlegel et al. 1998).
The absolute magnitude of the SN observed at magnitude is described by the equation:
| (1) |
where is the distance modulus, is the luminosity distance in Mpc, a function of redshift and cosmological model , and are the extinctions in our own Milky Way galaxy and in the SN host galaxy, respectively, and is the single filter K-correction (see e.g., Kim et al. 1996).
There are two unknowns in Equation 1. First of all, we do not know the value of , that is the internal host extinction at the SN location. However, because it can only make the SN brighter (the larger the value the brighter the SN), it does not affect our interpretation of the SN as super-luminous one. The second unknown is the K-correction, as for its calculation we would need a spectrum near the peak. On the other hand, the K-correction at such a low redshift is not going to change the absolute magnitudes by more than a few tenths of magnitude in either direction.
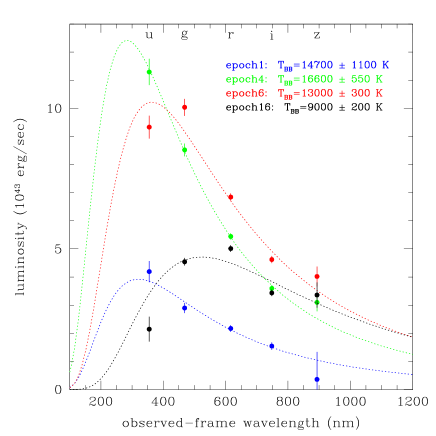
We converted the absolute magnitudes to luminosity (bottom panel of Figure 2, Figure 3, and Table 3). Integrating the five-band SDSS light curves over the duration of the transient, we estimated that the total emitted energy exceeded ergs. The bottom panel of Figure 2 shows the luminosity light curves. The first obvious finding is that the -band (near UV) light curve peaks first (at epoch 4 of the light curve), followed by optical light curves (at epochs 5–6), while the infrared light curves peak as the last ones, at more later epochs. This obviously reflects the changes in the spectrum of the object that are characteristic for an object with high early temperatures and low temperatures at late times – clear signs of an explosion or eruption. For each epoch we constructed five-point spectral energy distribution (SED) from the photometric data and investigated the evolution of the SED shape with time. In Figure 3, we present the supernova SED at selected epochs 1, 4, 6, and 16, corresponding to , , , and days from the -band peak at (24 September 2005). We fitted a black-body (BB) spectrum at each epoch and obtained the best-fitting BB temperatures (). The BB fits to the early time (pre-peak) SEDs returned satisfying , pointing to a rather featureless spectra with high temperatures K. The situation changes when we fit the BB spectrum to the late time (post-peak) SEDs. The fits are statistically unacceptable with . This is easily explained if we assume that our object is to an SN. Filippenko (1997) describes a normal SN Type II-P as having a featureless blue BB spectrum K at early times and a significant line evolution at late times with temperature reaching K few weeks later (adiabatic expansion and cooling of the ejecta) – a picture perfectly fitting into our findings (if ignoring the high luminosity).
3. The Host of PSN 000123+000504
The SN was found to be a transient in the Stripe 82 data, i.e. with no prior historical observations, forming a baseline. However, there is a faint galaxy-like object present in the SDSS images (Ahn et al., 2012) at the location of PSN 000123+000504. Its brightness in the SDSS DR9 is mag in the AB magnitude system.

We obtained a 30 min KECK/LRIS spectra of the host galaxy on MJD=56215.353347 and 56215.353455 (15 October 2012). While the spectrum has a rather low overall signal-to-noise (S/N) ratio, we were able to identify (amongst other) the following major emission lines: H at 4861Å, [OIII] at 4959Å and 5007Å, H at 6863Å, and [NII] at 6884Å, at a redshift (Figure 4).
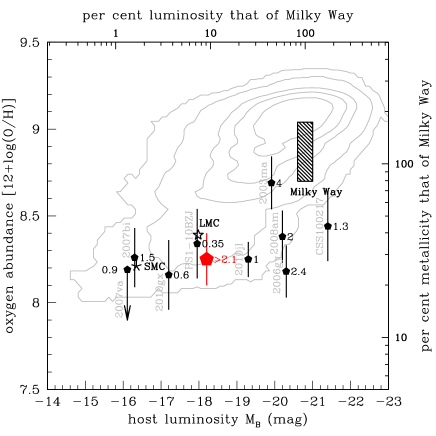
The red part of the spectrum was then also used to estimate the host’s oxygen abundance (). We measured the emission lines H with S/N , [OIII] at 4959Å with S/N , [OIII] at 5007Å with S/N , H with S/N , and [NII] at 6884Å with S/N to measure the and metallicity indices. Using equations from Pettini & Pagel (2004) we found with a formal error of 0.15 for index, and with a formal error of 0.08 for index. We added in quadrature the uncertainty for the Pettini & Pagel (2004) relations ( and 0.13, respectively) to obtain for index and for index (Figure 5). Both values are consistent with each other and indicate that the SN host galaxy has 30% Milky Way’s metallicity (adopting 8.8 from Delahaye et al. 2010).
After converting the host magnitudes to luminosity, we fit the galaxy/AGN models of Assef et al. (2010) to the five photometric data points. The only well-fitting spectrum is that of an irregular galaxy. This supports our claim that the host galaxy is a dwarf, irregular, metal-poor galaxy. The absolute brightness of the galaxy in was obtained as mag and the galaxy was placed on the absolute magnitude–metallicity plane, as shown in Figure 5.
4. Discussion
In this paper, we presented the discovery of an overlooked supernova in the SDSS Stripe 82 archival data, which we classified as an SLSN one based on its peak optical magnitude brighter than . The SN was found in a search for long transient events with a significant blue excess at peak in a variability database for SDSS Stripe 82. While we do not have the spectrum for the SN during explosion, we present the evidence for the SN host galaxy redshift of using the KECK/LRIS spectrum. We also constructed the five-point SED from the photometric data and investigated its evolution as a function of time. We fitted the BB spectrum at each epoch and obtained a best-fitting BB temperature, greater than 15000K, in early time SEDs. The temperature evolution with a decline in late epochs to 5000K also constitutes a strong piece of evidence in favor of classifying this object as a SLSN (Miller et al., 2009; Modjaz et al., 2009).
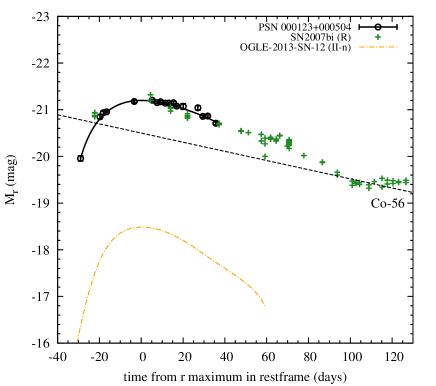
In Figure 6, we present the -band light curves of our SN. For comparison we also show the light curve of a likely Type II-n SN from the OGLE database (Elias-Rosa et al. 2013; Wyrzykowski et al. 2012; see also Kozłowski et al. 2013 for OGLE SNe overview), which is a few magnitudes fainter, but presents a similar shape of the light curve. Overall, the shape of the light curve of PSN 000123+000504 resembles very much that of objects found previously and classified as SLSNe. The rise of the light curve is very slow - it lasts about 30 days in the restframe from the faintest detected data point to the maximum. Then, the decline is also very slow, in a rough agreement with a radioactive decay of Co-56, at least in its early post-peak phase. Such behavior was in the past associated with supernovae of SLSN-R type (Gal-Yam, 2012), however, the suggested pair-instability origin of those SLSNe was recently questioned by Inserra et al. (2013).They suggest that SNe similar to SN2007bi are just a subtype of SLSN-I and are well described by a magnetar scenario.
There is a growing evidence for a correlation of the most energetic explosions preferring to occur in the low-metallicity (% that of Milky Way) dwarf () galaxies (Stanek et al. 2006; Kozłowski et al. 2010; Stoll et al. 2011; Gal-Yam 2012). While we find the former to be true for SLSN (Fig. 5), we are unable to confirm the latter part of the statement. In Fig. 5, we see that luminous SNe occupy all types of host galaxies with mag (galaxies with 1 to 200 per cent MW luminosity). Hence, there is no clear evidence for SLSNe to prefer dwarf galaxies, but this claim is based on a statistically small sample of 10 hosts.
We examined the properties of the faint host galaxy. With an oxygen abundance , the host galaxy of PSN 000123+000504 has 30% of the Milky Way’s metallicity and the absolute magnitude comparable to that of the Large Magellanic Cloud (LMC). The place of the SN host galaxy on the absolute magnitude-metallicity plane (Fig. 5) is among other hosts with detected SLSNe. The presence of SLSN usually indicates that the host is undergoing an episode of active star formation. The extreme luminosity of SLSNe is the key for their discovery over a range of redshifts, what helps the investigation of star formation in galaxies at high redshifts. Furthermore, the plausible high masses of their progenitors (in excess of 150 M⊙) present an opportunity to model the initial mass function in e.g., low-mass galaxies. The low host masses of observed SLSNe would indicate that these objects were produced at the early stages of galactic evolution, which creates a modeling problem to obtain progenitors in such galaxies with consistent metallicity (see Young et al., 2010 for a comparison).
Based on our single detection we can roughly estimate the SLSNe rate from the SDSS data. The Stripe 82 survey covers about 270 square degrees which corresponds to a volume of within redshift , a distance to which we are able to detect our SLSN. The brightest part of the SN light curve in range to mag can be seen during about 100 days (in -band with a detection limit of 21.5 mag). During the 8 year survey only one SLSN has been detected. Hence, we find that the SLSNe rate is of order of (with the assumption of 10 per cent efficiency in SN detection for Stripe 82 data, which is low mostly due to non-uniform SDSS cadence). This result is consistent with the rates presented previously by Gal-Yam (2012).
5. Summary
We presented a new example of the SLSNe class, which was found in the archival data of the SDSS Stripe 82. The redshift of the host, , determined with the Keck/LRIS spectrum, indicates that the brightness of this SN in the maximum exceeded mag. The light curve resemblance to SN2007bi and other similar SLSNe discovered so far indicates the PSN 000123+000504 may belong to the SLSN-R class (Gal-Yam et al. 2009; Young et al. 2010) or to magnetars (Inserra et al. 2013).This study also shows the potential of archival multi-color time-series databases in successful detection of interesting and rare cases of transients.
| HJD’ (days) | ||||||||||
|---|---|---|---|---|---|---|---|---|---|---|
| 3622.32727 | 20.588 | 0.093 | 20.728 | 0.065 | 20.745 | 0.055 | 20.904 | 0.086 | 22.295 | 1.424 |
| 3634.27689 | 19.705 | 0.122 | 19.625 | 0.047 | 19.854 | 0.043 | 20.033 | 0.053 | 20.465 | 0.270 |
| 3636.28243 | 19.527 | 0.073 | 19.575 | 0.028 | 19.766 | 0.036 | 19.960 | 0.042 | 20.632 | 0.372 |
| 3638.31822 | 19.513 | 0.044 | 19.557 | 0.029 | 19.746 | 0.022 | 19.987 | 0.033 | 19.956 | 0.106 |
| 3655.25412 | 19.634 | 0.095 | 19.320 | 0.028 | 19.523 | 0.032 | 19.709 | 0.051 | 19.774 | 0.154 |
| 3666.24223 | 19.720 | 0.047 | 19.380 | 0.032 | 19.497 | 0.020 | 19.714 | 0.027 | 19.673 | 0.091 |
| 3669.23771 | 19.835 | 0.047 | 19.433 | 0.024 | 19.549 | 0.021 | 19.737 | 0.026 | 19.930 | 0.104 |
| 3671.32237 | 19.999 | 0.074 | 19.442 | 0.024 | 19.529 | 0.025 | 19.808 | 0.035 | 19.887 | 0.162 |
| 3674.22166 | 20.009 | 0.058 | 19.550 | 0.020 | 19.561 | 0.024 | 19.795 | 0.031 | 19.764 | 0.102 |
| 3676.31101 | 20.157 | 0.081 | 19.575 | 0.026 | 19.559 | 0.021 | 19.738 | 0.040 | 19.881 | 0.108 |
| 3679.28270 | 20.081 | 0.074 | 19.545 | 0.025 | 19.551 | 0.027 | 19.858 | 0.037 | 20.172 | 0.196 |
| 3681.27407 | 20.181 | 0.064 | 19.617 | 0.022 | 19.625 | 0.019 | 19.863 | 0.028 | 19.924 | 0.116 |
| 3685.23284 | 20.338 | 0.200 | 19.786 | 0.067 | 19.632 | 0.063 | 19.929 | 0.066 | 20.266 | 0.265 |
| 3694.24599 | 19.996 | 0.233 | 19.786 | 0.067 | 19.661 | 0.047 | 19.810 | 0.072 | 20.087 | 0.332 |
| 3697.22983 | 20.948 | 0.146 | 20.011 | 0.027 | 19.844 | 0.027 | 20.022 | 0.030 | 19.981 | 0.131 |
| 3700.22852 | 21.316 | 0.205 | 20.241 | 0.032 | 19.836 | 0.025 | 20.036 | 0.034 | 19.867 | 0.136 |
| 3705.21473 | 22.056 | 0.333 | 20.389 | 0.030 | 19.990 | 0.030 | 20.052 | 0.034 | 20.007 | 0.127 |
Note. — , the magnitudes were corrected for the Milky Way’s extinction and put on the AB magnitude system.
| HJD’ (days) | ||||||||||
|---|---|---|---|---|---|---|---|---|---|---|
| 3622.32727 | -20.182 | 0.093 | -20.042 | 0.065 | -20.025 | 0.055 | -19.866 | 0.086 | -18.475 | 1.424 |
| 3634.27689 | -21.065 | 0.122 | -21.145 | 0.047 | -20.917 | 0.043 | -20.738 | 0.053 | -20.306 | 0.270 |
| 3636.28243 | -21.243 | 0.073 | -21.195 | 0.028 | -21.004 | 0.036 | -20.810 | 0.042 | -20.138 | 0.372 |
| 3638.31822 | -21.257 | 0.044 | -21.213 | 0.029 | -21.024 | 0.022 | -20.783 | 0.033 | -20.814 | 0.106 |
| 3655.25412 | -21.136 | 0.095 | -21.450 | 0.028 | -21.247 | 0.032 | -21.061 | 0.051 | -20.996 | 0.154 |
| 3666.24223 | -21.050 | 0.047 | -21.390 | 0.032 | -21.273 | 0.020 | -21.056 | 0.027 | -21.097 | 0.091 |
| 3669.23771 | -20.935 | 0.047 | -21.337 | 0.024 | -21.221 | 0.021 | -21.033 | 0.026 | -20.840 | 0.104 |
| 3671.32237 | -20.771 | 0.074 | -21.328 | 0.024 | -21.241 | 0.025 | -20.962 | 0.035 | -20.883 | 0.162 |
| 3674.22166 | -20.761 | 0.058 | -21.220 | 0.020 | -21.209 | 0.024 | -20.975 | 0.031 | -21.006 | 0.102 |
| 3676.31101 | -20.614 | 0.081 | -21.195 | 0.026 | -21.211 | 0.021 | -21.033 | 0.040 | -20.889 | 0.108 |
| 3679.28270 | -20.689 | 0.074 | -21.225 | 0.025 | -21.219 | 0.027 | -20.912 | 0.037 | -20.598 | 0.196 |
| 3681.27407 | -20.589 | 0.064 | -21.153 | 0.022 | -21.146 | 0.019 | -20.907 | 0.028 | -20.846 | 0.116 |
| 3685.23284 | -20.432 | 0.200 | -20.984 | 0.067 | -21.138 | 0.063 | -20.841 | 0.066 | -20.504 | 0.265 |
| 3694.24599 | -20.774 | 0.233 | -20.984 | 0.067 | -21.109 | 0.047 | -20.960 | 0.072 | -20.683 | 0.332 |
| 3697.22983 | -19.822 | 0.146 | -20.759 | 0.027 | -20.926 | 0.027 | -20.748 | 0.030 | -20.789 | 0.131 |
| 3700.22852 | -19.454 | 0.205 | -20.529 | 0.032 | -20.934 | 0.025 | -20.734 | 0.034 | -20.903 | 0.136 |
| 3705.21473 | -18.714 | 0.333 | -20.381 | 0.030 | -20.780 | 0.030 | -20.718 | 0.034 | -20.763 | 0.127 |
Note. — , the magnitudes were corrected for the Milky Way’s extinction and put on the AB magnitude system, while using the distance modulus mag.
| HJD’ (days) | sum | |||||||||||
|---|---|---|---|---|---|---|---|---|---|---|---|---|
| 3622.32727 | 4.193 | 0.376 | 2.898 | 0.180 | 2.170 | 0.114 | 1.544 | 0.128 | 0.359 | 0.974 | 11.164 | 1.073 |
| 3634.27689 | 9.458 | 1.127 | 8.008 | 0.351 | 4.931 | 0.197 | 3.445 | 0.174 | 1.939 | 0.548 | 27.781 | 1.327 |
| 3636.28243 | 11.140 | 0.776 | 8.385 | 0.218 | 5.344 | 0.180 | 3.684 | 0.145 | 1.661 | 0.678 | 30.214 | 1.078 |
| 3638.31822 | 11.293 | 0.467 | 8.521 | 0.227 | 5.443 | 0.110 | 3.593 | 0.112 | 3.098 | 0.317 | 31.948 | 0.628 |
| 3655.25412 | 10.095 | 0.922 | 10.600 | 0.274 | 6.683 | 0.199 | 4.642 | 0.224 | 3.661 | 0.559 | 35.681 | 1.152 |
| 3666.24223 | 9.333 | 0.409 | 10.037 | 0.300 | 6.845 | 0.127 | 4.622 | 0.118 | 4.020 | 0.353 | 34.857 | 0.641 |
| 3669.23771 | 8.389 | 0.374 | 9.554 | 0.216 | 6.528 | 0.129 | 4.522 | 0.111 | 3.171 | 0.320 | 32.164 | 0.563 |
| 3671.32237 | 7.214 | 0.508 | 9.480 | 0.208 | 6.648 | 0.156 | 4.235 | 0.139 | 3.301 | 0.530 | 30.878 | 0.791 |
| 3674.22166 | 7.148 | 0.393 | 8.576 | 0.161 | 6.455 | 0.144 | 4.287 | 0.125 | 3.697 | 0.363 | 30.163 | 0.590 |
| 3676.31101 | 6.242 | 0.483 | 8.387 | 0.201 | 6.465 | 0.125 | 4.521 | 0.168 | 3.319 | 0.347 | 28.934 | 0.661 |
| 3679.28270 | 6.690 | 0.474 | 8.622 | 0.200 | 6.515 | 0.164 | 4.046 | 0.140 | 2.539 | 0.501 | 28.412 | 0.749 |
| 3681.27407 | 6.100 | 0.368 | 8.069 | 0.163 | 6.088 | 0.110 | 4.027 | 0.107 | 3.189 | 0.359 | 27.473 | 0.560 |
| 3685.23284 | 5.280 | 1.070 | 6.901 | 0.440 | 6.046 | 0.360 | 3.791 | 0.238 | 2.328 | 0.642 | 24.346 | 1.391 |
| 3694.24599 | 7.238 | 1.729 | 6.904 | 0.439 | 5.888 | 0.261 | 4.228 | 0.290 | 2.744 | 0.980 | 27.002 | 2.072 |
| 3697.22983 | 3.011 | 0.434 | 5.612 | 0.140 | 4.974 | 0.126 | 3.480 | 0.099 | 3.028 | 0.390 | 20.105 | 0.621 |
| 3700.22852 | 2.146 | 0.445 | 4.542 | 0.137 | 5.012 | 0.119 | 3.435 | 0.108 | 3.360 | 0.449 | 18.495 | 0.666 |
| 3705.21473 | 1.085 | 0.389 | 3.960 | 0.111 | 4.347 | 0.123 | 3.385 | 0.106 | 2.954 | 0.366 | 15.731 | 0.569 |
Note. — , the luminosity is corrected for the Milky Way’s extinction.
References
- Ahn et al. (2012) Ahn, C. P., et al. 2012, ApJS, 203, 21A
- Assef et al. (2010) Assef, R. J., Kochanek, C. S., Brodwin, M., et al. 2010, ApJ, 713, 970
- Bramich et al. (2008) Bramich, D. M., et al. 2008, MNRAS, 386, 887
- Delahaye et al. (2010) Delahaye, F., Pinsonneault, M. H., Pinsonneault, L., & Zeippen, C. J. 2010, arXiv:1005.0423
- Drake et al. (2009) Drake, A. J., et al. 2009, ApJ, 696, 870
- Elias-Rosa et al. (2013) Elias-Rosa, N., et al. 2013, ATel, 4774, 1
- Filippenko (1997) Filippenko, A. V. 1997, ARA&A, 35, 309
- Frieman et al. (2008) Frieman, J. A., et al. 2008, AJ, 135, 338
- Gal-Yam et al. (2009) Gal-Yam, A. et al. 2009, Nature, 462, 624
- Gal-Yam (2012) Gal-Yam, A. 2012, Science, 337, 927
- Inserra et al. (2013) Inserra, C., et al. 2013, ArXiv, 1304.3320
- Ivezić et al. (2007) Ivezić, Ž., Smith, J. A., Miknaitis, G., et al. 2007, AJ, 134, 973
- Kim et al. (1996) Kim, A., Goobar, A., & Perlmutter, S. 1996, PASP, 108, 190
- Kozłowski et al. (2010) Kozłowski, S., Kochanek, C. S., Stern, D., et al. 2010, ApJ, 722, 1624
- Kozłowski et al. (2013) Kozłowski, S., Udalski, A., Wyrzykowski, Ł., et al. 2013, Acta Astron., 63, 1
- Law et al. (2009) Law, N. M., et al. 2009, PASP, 121, 1395
- Miller et al. (2009) Miller, A. A., et al. 2009, ApJ, 690, 1303
- Modjaz et al. (2009) Modjaz, M., et al. 2009, ApJ, 702, 226
- Neill et al. (2011) Neill, J. D. et al. 2011, ApJ, 727, 15
- Pastorello et al. (2010) Pastorello, A., et al. 2010, ApJ, 724, L16
- Pettini & Pagel (2004) Pettini, M., & Pagel, B. E. J. 2004, MNRAS, 348, L59
- Prieto et al. (2008) Prieto, J. L., Stanek, K. Z., & Beacom, J. F. 2008, ApJ, 673, 999
- Quimby et al. (2011) Quimby, R. M., et al. 2011, Nature, 474, 487
- Rau et al. (2009) Rau, A., et al. 2009, PASP, 121, 1334
- Sako et al. (2008) Sako, M., et al. 2008, AJ, 135, 248
- Schlegel et al. (1998) Schlegel, D. J., Finkbeiner, D. P., & Davis, M. 1998, ApJ, 500, 525
- Stanek et al. (2006) Stanek, K. Z., Gnedin, O. Y., Beacom, J. F., et al. 2006, Acta Astron., 56, 333
- Stoll et al. (2011) Stoll, R., Prieto, J. L., Stanek, K. Z., et al. 2011, ApJ, 730, 34
- Tremonti et al. (2004) Tremonti, C. A., Heckman, T. M., Kauffmann, G., et al. 2004, ApJ, 613, 898
- Young et al. (2010) Young, D. R., et al. 2010, A&A, 512, A70
- Wyrzykowski et al. (2012) Wyrzykowski, L., Udalski, A., & Kozlowski, S. 2012, ATel, 4495, 1