Dynamics of self-organized driven particles with competing range interaction
Abstract
Non-equilibrium self-organized patterns formed by particles interacting through competing range interaction are driven over a substrate by an external force. We show that, with increasing driving force, the pre-existed static patterns evolve into dynamic patterns either via disordered phase or depinned patterns, or via the formation of non-equilibrium stripes. Strikingly, the stripes are formed either in the direction of the driving force or in the transverse direction, depending on the pinning strength. The revealed dynamical patterns are summarized in a dynamical phase diagram.
pacs:
89.75.Kd,82.70.Dd,74.25.UvI Introduction
Most of the studies on self-assembly focused on equilibrium systems which form highly ordered arrays (crystals). Equilibrium systems with a competing repulsive and attractive interaction Seul1995 ; Reichhardt2003 ; Reichhardt2003a ; Nelissen2005 ; Vedmedenko2007 ; Zhao2012a demonstrate a variety of morphologies with an inhomogeneous distribution of particles, including stripes, clusters, bubbles, etc. However, most important are dynamic self-assembling systems, i.e., out-of-equilibrium systems that form their characteristic order when dissipating energy Whitesides2002 ; Ball1999 . Understanding and controlling such systems is required in order to maximize the value of self-assembly as a strategy for synthesis and fabrication and, e.g., for the understanding of the role of self-assembly in biology.
Interacting systems driven on a substracte include, e.g., colloids Reichhardt2002a ; Cao2003 ; Pertsinidis2008 ; Bohlein2012 , charge density waves Gruner1988 ; Balents1995 , Wigner crystals Reichhardt2001a , and vortex matter in superconductors Bhattacharya1993 ; Yaron1995 ; Duarte1996 ; Pardo1996 ; Pardo1998 ; Koshelev1994 ; Moon1996 ; Giamarchi1996 ; Balents1997 ; Olson1998 ; Rosenstein2010 ; Pogosov2010 . Thus, in a two-dimensional (2D) colloidal crystal driven across ordered substrates, kinks and antikinks were experimentally observed Bohlein2012 . For vortex matter driven on a random substrate, various dynamical regimes: pinned, plastic, and elastic flow were revealed in experiments Bhattacharya1993 ; Yaron1995 ; Duarte1996 ; Pardo1996 ; Pardo1998 and in theory Koshelev1994 ; Moon1996 ; Giamarchi1996 ; Balents1997 ; Olson1998 ; Rosenstein2010 ; Pogosov2010 . Using a periodic substrate, instead of random, results in rich dynamics including negative differential resistivity of either N-type Reichhardt1997 or N- and S-type Misko2006b ; Misko2007a . Furthermore, driven vortex matter on quasiperiodic substrates Misko2005 ; Misko2006 ; Villegas2006 ; Kemmler2006 ; Silhanek2006 revealed electron-like or hole-like “vortex conductivity” Misko2010 . In the above examples, the interaction between the fundamental units (i.e., colloids or vortices) was purely repulsive with a single length scale.
In case of competing interaction characterizied by two (or more) length scales, systems self-organize forming equilibrium, or at least metastable, patterns. The main question is, how the pre-existed static patterns will evolve being driven on a random or regular substrate? And, will they evolve in some other, dynamically-induced, non-equilibrium patterns which do not exist in equilibrium? These are still open important questions for the general case of competing interaction and for an arbitrary potential-energy profile of the substrate. Only a few studies have been performed for some special cases. For example, the dynamical reordering in the plastic regime Reichhardt2003a ; Reichhardt2003 ; Xu2011b ; OlsonReichhardt2011 was examined in a system with competing short and long-range interactions Reichhardt2003 ; Reichhardt2003a .
In the previous studies, the interaction at long distance was repulsive, since an attractive interaction leads to phase separation. However, as shown recently Zhao2012a , a competing interaction with a repulsive core and a fast decaying attractive tail can induce long-living metastable states. This model Zhao2012a is applicable to a number of diverse physical systems with fast decaying interaction, e.g., atoms and molecules (Lennard-Jones), colloids and ferrofluids. Also, it can model inter-vortex interaction in low- Brandt2011 ; Xu2011 ; Xu2011b and multi-band superconductors such as , where inhomogeneous vortex patterns, e.g., gossamers and stripes, were recently revealed experimentally Moshchalkov2009 ; Nishio2010 . Those unusual patterns result from a non-monotonic inter-vortex interaction as argued in Babaev2005 ; Babaev2010 ; Chaves2011 ; Komendova2011 ; Lin2011 ; Komendova2012 ; Silaev2012 . Furthermore, recent scanning Hall probe microscopy measurements Gutierrez2012 revealed stripe vortex patterns in which were not due to inhomogeneous pinning but rather suggestive of another source of ordering, e.g., an external driving bias that might orient the stripes. Therefore, studying the dynamics of systems with competing range interaction is both of fundamental interest and useful for the understanding of unusual experimental patterns.
II Model
We study the dynamics of particles with a non-monotonic interaction moving in 2D, by numerically integrating the Langevin equations using molecular-dynamics (MD) simulations. The overdamped equation of motion is Reichhardt2003 ; Reichhardt2003a ; Reichhardt2005 ; Zhao2012a ; Zhao2012 :
| (1) |
We follow the model introduced in Zhao2012a ; Zhao2012 and used in Reichhardt2012a , where the inter-particle interaction has a repulsive core and an attractive tail,
| (2) |
where is the first-order modified Bessel function and () is the unit of force (length). is the interaction of the particles with pinning sites:
| (3) |
Here is the number of pinning sites, is the maximum pinning force, is the pinning range is the Heaviside step function, and . is the thermal stochastic force, which obeys the following conditions:
| (4) |
and
| (5) |
The last term in Eq. (1) is the applied driving force. We consider a 2D square simulation box (where ) in the -plane and apply periodic boundary conditions pbc . For the interaction force given by Eq. (2), which decays exponentially for large , we use a cut-off cutoff . Thus, the interaction in our model is finite-range. The initial states are obtained by performing simulated annealing simulations of interacting particles without driving. Then, the driving force is turned on at zero temperature temp .
III Dynamical regimes
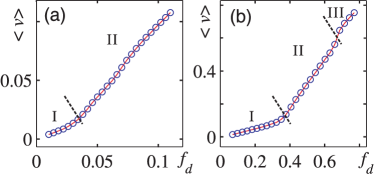
The dynamics of the system is determined by three main factors: the inter-particle, particle-pinning interactions, and the applied driving. To characterize the dynamical regimes, we calculate the average velocity versus for varying . In general, for very weak , most of the particles are pinned resulting in . In the opposite limit of large (), all the particles are depinned, and . The intermediate range of () exhibits rich dynamics. Depending on , curves acquire well-distinguished parts (Fig. 1) indicative of different dynamical regimes. In the Supplemental Material (Sec. VIII), examples of snapshots are presented illustrating various dynamical regimes and transitions (crossovers) between them.
Below we present our results for specific pinning regimes and the following interaction parameters: and , the particle density , where is the total number of particles in the simulation cell, and the density of random pinning . Note that static configurations for these parameters are labyrinths Zhao2012a .
III.1 Weak pinning
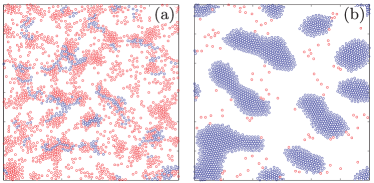
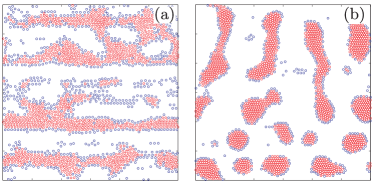
Very weak pinning with strength (), which is comparable to the elastic force due to the inter-particle interaction, is insufficient to destroy the static morphology. Therefore, for weak driving (), particles only flow inside the labyrinths (Fig. 2(a)) (these are unpinned partcles which are trapped by the pinned neighbors, i.e., “collectively pinned”) resulting in very small (Fig. 1(a)). For larger than some threshold (e.g., ), most of the particles depin, although . This collective depinning occurs as follows: parts of the labyrinths depin and form small clusters which repin again if driving is weak. For stronger driving, they merge with pinned parts and depin them, leaving only a few individually pinned particles (see Fig. 2(b)). As a result, the number of mobile particles increases with time, until most of them are depinned.
III.1.1 The optimal cluster size
Merging of small clusters is not the only mechanism of increasing the cluster size. Strikingly, they can also “grow” by collecting individual particles generated by “evaporating” small clusters.
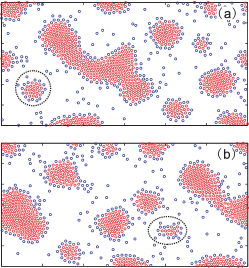
To understand this effect, we explore the analogy between a cluster moving on a pinning landscape and a droplet of water moving on a prewetted substrate Gennes1985 ; Bonn2009 . The size of the droplet increases if the substrate is over-wetted, and vice versa: the size of the droplet decreases if the substrate is dry. Therefore, there exists a critical wettability when the droplet keeps its size. Translating this to the language of our system, larger clusters have larger attraction to their tail particles. Therefore, the critical “wettability” of large clusters is smaller than that of small ones. Now, considering a small cluster following a large one, the substrate passed by the large cluster is always dry for the small cluster. Thus, the small cluster evaporates and leaves an over-wetted substrate for the large clusters.
Fig. 3 illustrates the evolution of a small cluster following a large cluster. The small cluster remains stable until the cluster in front of it becomes large enough (Fig. 3(a)). Then the small cluster gradually loses its particles (see Fig. 3(b)), and finally disappears. As a result, a steady state is formed when all the clusters are large and well separated.
III.2 Intermediate pinning
For the pinning force larger than the strength of the typical inter-particle interaction force (), the pre-existed patterns are destroyed. There are three dynamical regimes in case of intermediate pinning strength (Fig. 1(b)). In regime I, the pinning force is larger than the elastic force due to the inter-particle interaction, while the driving force is smaller. Therefore, part of the labyrinths can still exist, i.e., in the form of deformed small clusters.
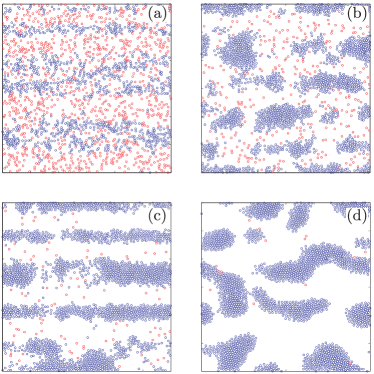
A stronger driving force can overcome the elastic force between particles and the pinning force, resulting in more mobile particles, which increases . Further increase of increases the density of mobile particles, until all the particles are depinned (regime II). In turn, this regime can be divided into three sub-regimes: (i) is just above the elastic force: the resulted dynamical patterns are disordered (Fig. 8(a)); (ii) stronger : the mobile particles form clusters (Fig. 8(b)) which elongate in the direction of driving (i.e., for , see Ref. Zhao2012a ) when the “head” and “tail” of a cluster move with different velocity because of the different “friction” due to the pinning (note that the motion in the medium, without pinning, is overdamped, while the additional “friction” is related to the pinning); (iii) even larger : the elongated clusters connect to each other, which restores a continuous particle flow (Fig. 8(c)).
Although the stripe formation has been found in many physical systems, e.g., driven vortices Xu2011 ; Xu2011b ; Zhao2012a ; Zhao2012 , 2D electrons Reichhardt2003 ; Reichhardt2003a ; Reichhardt2005 and systems with shoulder potential Malescio2003 , the stripe formation and orientation in our case is different. In those studies, the inter-particle interaction for long distance was repulsive, which prevented the stripes from merging and arranged them parallel. In contrast, here the weak attractive tail leads to the accumulation of single mobile particles but is not sufficient for merging the stripes locked by the random pinning. As a consequence, the stripes have varying width and inter-stripe distance, in contrast to the ones resulting from a purely repulsive tail Reichhardt2003 .
Finally, for , all the particles are depinned, the clusters or stripes are not oriented (Fig. 8(d)), and increases linearly versus (regime III) Reichhardt1997 ; Misko2006b ; Misko2007a .
III.3 Strong pinning: Formation of transverse stripes
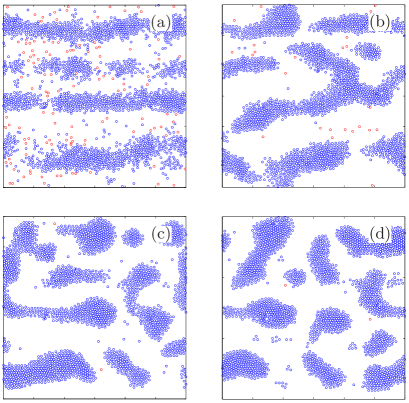
For sufficiently strong pinning (), even a small number of pinning sites destroy the pattern structure. As a result, for a broad range of , the dynamical patterns are disordered. Moving clusters are formed when is very close to the depinning threshold: .
For the so-called “fast sliding regime”, when , the random pinning has the same impact on the moving patterns as the thermal Langevin force Koshelev1994 . Strong pinning orients the sliding triangular lattice in the longitudinal direction (Fig. 5(a)), i.e., particles move in static channels which were found for moving elastic lattices with disorder Giamarchi1996 . Once these channels are formed, there are energy barriers for transverse motion, i.e., the motion along the longitudinal channels is locked. These transverse energy barriers can be overcome by a weak bias force, e.g., a weak external driving in the transverse direction.
We use the paradigm of static channels to explain a very unusual behavior revealed for : the formation of striking transversal stripes (see Fig. 5(b)). To understand this unusual behavior, recall that in the absence of pinning, particles try to form, due to the attraction force, circular clusters for this value of Zhao2012a . The aggregation due to the inter-particle attraction, in principle, overcomes the elongation of clusters due to the formation of static channels. However, the latter process is much faster than the former one, and as a result, for strong enough driving, the clusters turn out to be dynamically locked by the static channels. Merging clusters still tend to acquire circular shape, but due to the existing transverse barriers, they become “stretched” along the transverse direction, thus resulting in the observed transverse stripes (Fig. 5(b)).
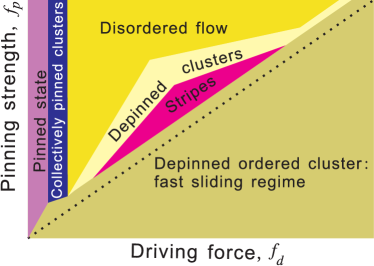
IV Phase diagram
The dynamical phase diagram in the plane of “pinning strength versus driving force ” is shown in Fig. 6. The pinned state is formed when the driving force is extremely small, i.e., insufficient to destroy the patterns. The depinned state corresponds to large driving forces. Note that due to collective depinning, assisted by the elastic force between the particles, the actual threshold is smaller than the maximum pinning force (dashed line). For weak pinning, there are two dynamical regimes: pinned clusters (labyrinths) with particle flow inside the labyrinth (Fig. 2(a)) and depinned clusters (Fig. 2(b)) or stripes. For intermediate pinning we distinguish: (i) “pinned clusters with chains-like flow”; (ii) “intermediate regime” including chains-like flow with a background of disordered pinned particles (Fig. 8(a)), reordered depinned clusters (Fig. 8(b)), and oriented stripes (Fig. 8(c)); and (iii) “depinned elastic flow” (Fig. 8(d)). With increasing , the driving range for the formation of depinned clusters and stripes becomes very narrow.
IV.1 Peak effect
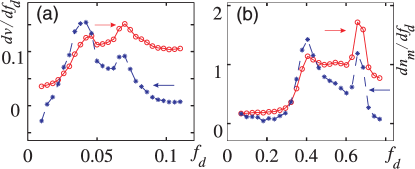
To analyze the curvature of the -curve (Fig. 1), we take the derivative and find that each curve displays two main peaks (Fig. 7). With increasing , there are two contributions to : the varying number of mobile particles and the increasing particle velocity. The nonlinear behavior of is due to the former contribution. The variation of the number of mobile particles, , is: As shown in Fig. 7, also has two peaks, which are related to the peaks in . The two-peak structure in (and ) is explained as follows. The first peak (): when increases, it depins more particles resulting in the growth of , then the number of pinned particles decreases. The second peak appears when reaches the depinning threshold.
The distinct dynamical patterns can also be characterized by other “dynamical order parameters” (for static patterns, see Ref. Zhao2012a ). The transitions (crossovers) between the dynamical patterns are observed as features in these order parameters, such as the velocity distribution and the surface-area-to-volume ratio. (Note that the transitions between the different dynamical phases are rather smooth, although the different phases are well-distinguished as peaks in the corresponding order parameters.)
IV.2 Velocity distribution
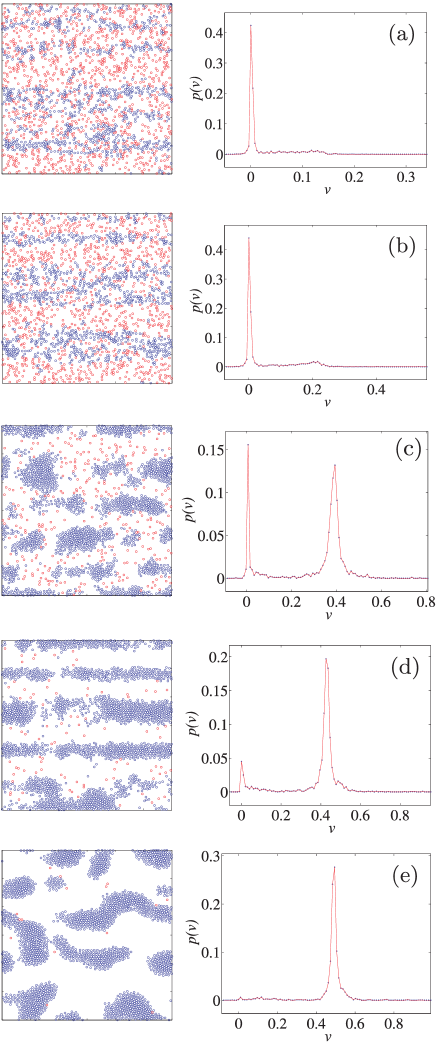
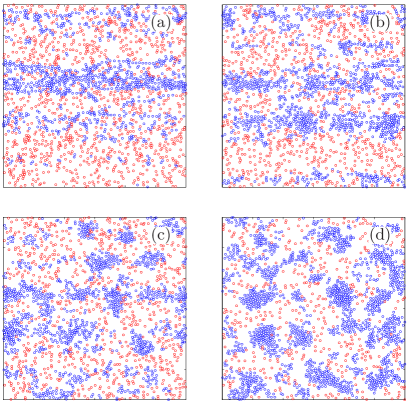
In Fig. 8, we plot the dynamical patterns and the corresponding velocity distributions for pinning strength . For driving force (see Fig. 8(a)), there is only one peak positioned at in the plot “probability versus velocity ”. This corresponds to the state when all particles are pinned.
The second peak, which starts to develop as a weak feature at applied driving , corresponds to the situation when the mobilized (depinned) particles start to form clusters (see Figs. 8(b)). Further increasing , clearly leads to the formation of clusters, which strengthens the second peak. Simultaneously, the first peak weakens (see Figs. 8(c)). The two-peak structure shown in Figs. 8(c) corresponds to moving clusters (second peak) and pinned ones (first peak).
Stripes are formed when the second peak is strong enough, i.e., enough mobilized (unpinned) particles are generated to form stripes (see Figs. 8(d)). Finally, when , all the particles are mobilized. As a result, the first peak disappears, and the second peak shifts towards higher values indicating that all the particles participate in the motion, with the same velocity.
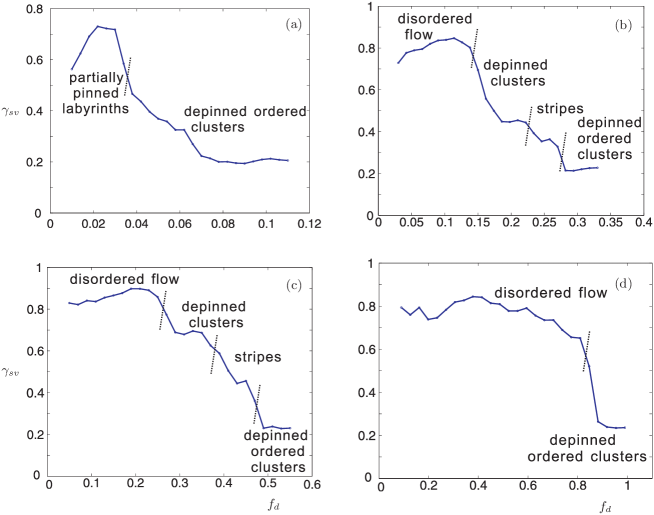
IV.3 Surface-area-to-volume ratio
In Fig. 9, we plot “surface-area-to-volume ratio versus driving force ”. (Note that the state with all the particles pinned is not considered in this section.) For weak pinning (), there are only two dynamical regimes as discussed in the main text (see Fig. 9(a)). As increases, first increases, since the applied driving destroys the preexisted static patterns, i.e., labyrinths or clusters. The fast decrease of the function corresponds to the onset of the collective depinning of clusters. The saturation region for indicates that the threshold of collective depinning in this case is much lower than the pinning force.
For intermediate pinning (), similarly to the weak pinning case, first increases when increasing (see Figs. 9(b) and (c)). Then rapidly decreases when mobilized particles start to clustering. Further increase of results, on the one hand, in depinning of additional individual particles (they are counted as “surface particles”). On the other hand, small clusters still can survive for these values of driving force (smaller clusters correspond to larger ). As a result of the competition of these two effects, a weak plateau (see Figs. 9(b) and (c)) appears in . The latter effect disappears when all small clusters merge into stripes, thus start to rapidly decrease again. A fast drop in appears when . The reason is that in this case, the particles form large clusters which have much lower than stripes.
For strong pinning case (), the dynamical pattern change directly from a disordered flow to depinned ordered clusters. Thus a fast decay of is observed when is close to .
Note that for all the values of pinning considered above, the function has a constant minimum value (), when , which indicates that they all share similar states (depinned ordered clusters).
V Conclusions
Analyzing the dynamics of patterns formed due to a short-range non-monotonic interaction, we found, depending on the strength of the pinning, a variety of dynamical regimes including: a disordered motion (when the pre-existed static patterns are destroyed), the motion of depinned clusters, and the formation of stripes. Strikingly, the stripes can be either longitudinal (i.e., formed in the direction of the driving force) or transverse (i.e., formed in the direction normal to the driving), depending on the pinning regime: weak or strong, correspondingly. We also found that, unlike in the previously studied static case, the motion on a random substrate dynamically selects the optimal cluster size. Clusters smaller than this size, lose their particles due to the effect of friction and finally “evaporate”, while large clusters collect these individual particles and grow untill only large enough clusters remain in the system. The mechanism of this dynamical size selection effect is similar to the critical wettability of a water droplet moving on either an over-wetted or a dry substrate. We found a pronounced double-peak structure in the variation of the -curve which is explained by: (i) increasing the number of depinned particles and the simultaneous decrease of the number of pinned particles which can be depinned, and (ii) approaching the depinning threshold for individual particles.
Our findings can be useful for the analysis of dynamical pattern formation in various systems with competing range interaction including colloids, vortices in superconductors, etc., as well as for the deeper understanding of wetting phenomena and microscopic friction. In particular, we believe that the dynamical patterns, predicted in our work, can be verified in experiments with driven colloids and with driven vortices in two-band superconductors such as MgB2.
VI Acknowledgment
This work was supported by the “Odysseus” Program of the Flemish Government and the Flemish Science Foundation (FWO-Vl).
VII Supplemental Material: Particle distributions
Here we show examples of snapshots illustrating various dynamical regimes and transitions (crossovers) between them, for and varying driving force . In particular, the crossower from disordered flow to clusters is shown in Fig. 10, and the crossower from stripes to clusters is presented in Fig. 11.
References
- (1) M. Seul and D. Andelman, Science 267, 476 (1995).
- (2) C. Reichhardt, C. J. Olson, I. Martin and A. R. Bishop, Europhys. Lett. 61, 221 (2003).
- (3) C. Reichhardt, C. J. O. Reichhardt, I. Martin and A. R. Bishop, Phys. Rev. Lett. 90, 026401 (2003).
- (4) K. Nelissen, B. Partoens and F. M. Peeters, Phys. Rev. E 71, 066204 (2005).
- (5) E. Y. Vedmedenko, Competing interactions and patterns in nanoworld (WILEY-VCH Verlag GmbH & Co. KGaA, 2007).
- (6) H. J. Zhao, V. R. Misko and F. M. Peeters, New Journal of Physics 14, 063032 (2012).
- (7) G. Whitesides and M. Boncheva, Proc. Natl. Acad. Sci. U. S. A. 99, 4769 (2002).
- (8) P. Ball, The Self-Made Tapestry: Pattern Formation in Nature (Oxford Univ. Press, Oxford, U.K., 1999).
- (9) C. Reichhardt and C. J. Olson, Phys. Rev. Lett. 89, 078301 (2002).
- (10) Y. Cao, J. Chen, Y. Wang, Z. Jiao and W. K. Chow, Phys. Rev. B 68, 134209 (2003).
- (11) A. Pertsinidis and X. S. Ling, Phys. Rev. Lett. 100, 028303 (2008).
- (12) T. Bohlein, J. Mikhael and C. Bechinger, Nature Materials 11, 126 (2012).
- (13) G. Grüner, Rev. Mod. Phys. 60, 1129 (1988).
- (14) L. Balents and M. P. A. Fisher, Phys. Rev. Lett. 75, 4270 (1995).
- (15) C. Reichhardt, C. J. Olson, N. Grønbech-Jensen and F. Nori, Phys. Rev. Lett. 86, 4354 (2001).
- (16) S. Bhattacharya and M. J. Higgins, Phys. Rev. Lett. 70, 2617 (1993).
- (17) U. Yaron, Nature 376, 753 (1995).
- (18) A. Duarte, Phys. Rev. B 53, 11336 (1996).
- (19) F. Pardo, Phys. Rev. Lett. 78, 4633 (1996).
- (20) F. Pardo, F. de la Cruz, P. L. Gammel, E. Bucher and D. J. Bishop, Nature 396, 348 (1998).
- (21) A. E. Koshelev and V. M. Vinokur, Phys. Rev. Lett. 73, 3580 (1994).
- (22) K. Moon, T. Scalettar and T. Gergely, Phys. Rev. Lett. 77, 2778 (1996).
- (23) T. Giamarchi and P. Le Doussal, Phys. Rev. Lett. 76, 3408 (1996).
- (24) L. Balents, M. C. Marchetti and L. Radzihovsky, Phys. Rev. Lett. 78, 751 (1997).
- (25) C. J. Olson, C. Reichhardt and F. Nori, Phys. Rev. Lett. 81, 3757 (1998).
- (26) B. Rosenstein and D. Li, Rev. Mod. Phys. 82, 109 (2010).
- (27) W. V. Pogosov, H. J. Zhao, V. R. Misko and F. M. Peeters, Phys. Rev. B 81, 024513 (2010).
- (28) C. Reichhardt, C. J. Olson and F. Nori, Phys. Rev. Lett. 78, 2648 (1997).
- (29) V. R. Misko, S. Savel’ev, A. L. Rakhmanov and F. Nori, Phys. Rev. Lett. 96, 127004 (2006).
- (30) V. R. Misko, S. Savel’ev, A. L. Rakhmanov and F. Nori, Phys. Rev. B 75, 024509 (2007).
- (31) V. Misko, S. Savel’ev and F. Nori, Phys. Rev. Lett. 95, 177007 (2005).
- (32) V. R. Misko, S. Savel’ev and F. Nori, Phys. Rev. B 74, 024522 (2006).
- (33) J. E. Villegas, M. I. Montero, C.-P. Li and I. K. Schuller, Phys. Rev. Lett. 97, 027002 (2006).
- (34) M. Kemmler, C. Gürlich, A. Sterck, H. Pöhler, M. Neuhaus, M. Siegel, R. Kleiner and D. Koelle, Phys. Rev. Lett. 97, 147003 (2006).
- (35) A. V. Silhanek, W. Gillijns, V. V. Moshchalkov, B. Y. Zhu, J. Moonens and L. H. A. Leunissen, Appl. Phys. Lett. 89, 152507 (2006).
- (36) V. R. Misko, D. Bothner, M. Kemmler, R. Kleiner, D. Koelle, F. M. Peeters and F. Nori, Phys. Rev. B 82, 184512 (2010).
- (37) X. B. Xu, H. Fangohr, Z. H. Wang, M. Gu, S. L. Liu, D. Q. Shi and S. X. Dou, Phys. Rev. B 84, 014515 (2011).
- (38) C. J. Olson Reichhardt, C. Reichhardt and A. R. Bishop, Phys. Rev. E 83, 041501 (2011).
- (39) E. Brandt and M. Das, J. Supercond. Novel Magn. 24, 57 (2011).
- (40) X. B. Xu, H. Fangohr, S. Y. Ding, F. Zhou, X. N. Xu, Z. H. Wang, M. Gu, D. Q. Shi and S. X. Dou, Phys. Rev. B 83, 014501 (2011).
- (41) V. Moshchalkov, M. Menghini, T. Nishio, Q. H. Chen, A. V. Silhanek, V. H. Dao, L. F. Chibotaru, N. D. Zhigadlo and J. Karpinski, Phys. Rev. Lett. 102, 117001 (2009).
- (42) T. Nishio, V. H. Dao, Q. Chen, L. F. Chibotaru, K. Kadowaki and V. V. Moshchalkov, Phys. Rev. B 81, 020506 (2010).
- (43) E. Babaev and M. Speight, Phys. Rev. B 72, 180502 (2005).
- (44) E. Babaev, J. Carlström and M. Speight, Phys. Rev. Lett. 105, 067003 (2010).
- (45) A. Chaves, L. Komendová, M. V. Milošević, J. S. Andrade, G. A. Farias and F. M. Peeters, Phys. Rev. B 83, 214523 (2011).
- (46) L. Komendová, M. V. Milošević, A. A. Shanenko and F. M. Peeters, Phys. Rev. B 84, 064522 (2011).
- (47) S.-Z. Lin and X. Hu, Phys. Rev. B 84, 214505 (2011).
- (48) L. Komendová, Y. Chen, A. A. Shanenko, M. V. Milošević and F. M. Peeters, Phys. Rev. Lett. 108, 207002 (2012).
- (49) M. Silaev and E. Babaev, Phys. Rev. B 85, 134514 (2012).
- (50) J. Gutierrez, B. Raes, A. V. Silhanek, L. J. Li, N. D. Zhigadlo, J. Karpinski, J. Tempere and V. V. Moshchalkov, Phys. Rev. B 85, 094511 (2012).
- (51) C. Reichhardt, C. J. O. Reichhardt and A. R. Bishop, Europhys. Lett. 72, 444 (2005).
- (52) H. J. Zhao, V. R. Misko and F. M. Peeters, Physica C: Superconductivity 479, 130 (2012).
- (53) C. Reichhardt, J. Drocco, C. O. Reichhardt and A. Bishop, Physica C: Superconductivity 479, 15 (2012).
- (54) To check the effect of boundaries, an enlarged simulation box was used, namely, we tried and which revealed no change in the resulted patterns.
- (55) Since both terms of the interaction force are represented by modified Bessel functions, which decay exponentially for large distances, the used cut-off procedure is safe: our trial simulations with a cut-off of did not reveal any impact on the results.
- (56) Nonzero temperature would result in broadening of the particle trajectories and ultimately in destruction of dynamical patterns.
- (57) P. G. de Gennes, Rev. Mod. Phys. 57, 827 (1985).
- (58) D. Bonn, J. Eggers, J. Indekeu, J. Meunier and E. Rolley, Rev. Mod. Phys. 81, 739 (2009).
- (59) G. Malescio and G. Pellicane, Nat. Mater. 2, 97 (2003).