Comparing the Usage of Global and Local Wikipedias
with Focus on Swedish Wikipedia
Abstract
This report summarizes the results of a short-term student research project focused on the usage of Swedish Wikipedia. It is trying to answer the following question: To what extent (and why) do people from non-English language communities use the English Wikipedia instead of the one in their local language? Article access time series and article edit time series from major Wikipedias including Swedish Wikipedia are analyzed with various tools.
I Introduction
Using Wikipedia can refer to accessing (reading) articles, editing articles, participating in discussions (which corresponds to reading and editing discussion pages), etc. These activities can be done by users inside the particular country under consideration, but also from people living outside the country and somehow associated with it (by nationality, interest, etc.). Here we want to study the relations between English Wikipedia and Swedish Wikipedia. To get a basis of reference and identify special properties of the Swedish Wikipedia and its users, we also study data from five additional local Wikipedias. A particular focus is placed on choosing language communities in different time zones, so that information can be gained from comparing daily and weekly cycles of activity.
We started with a literature review which included online material. The focus was on publications with content related to our main research question. The itemized literature overview can be found in Section IX. In particular, the Wikimedia Report Card has to be mentioned as a useful statistical tool. Although there are other projects with topics related with parts of our project, we could not extract many useful results for our study from their reports.
The outline of the report is as follows. Section II describes the data base and the lists of articles (Wikipedia pages) used for the study. Section III studies correlations between total access volumes per page and total edit volumes per page for Swedish and English articles. Section IV presents diurnal variations of access volume for Swedish and English articles, while more language versions are compared in Section V and edit volume variations are also considered in Section VI. Section VII looks at synchronous edits in Swedish and English articles, and Section VIII characterizes growth patterns of Wikipedia content and quality in different languages. The literature review can be found in Section IX.
II Wikipedia Data and Article Selection
The data used in this work are based on publicly available files collected by Domas Mituzas during a time frame from October 2008 till the February 2010 [D. Mituzas, wikidata/wikistats, http://dammit.it/wikistats (2010)]. The collection was processed by Lev Muchnik (Leonard N. Stern School of Business, New York University, New York, USA), focusing on the period from January 1, 2009 to October 21, 2009. The total number of article access events during time frames of one hour were counted, yielding access-rate time series for each article . An access is defined as the loading of an article page. We cannot distinguish between opening an article in a web-browser or downloading of the page by a web crawler. The edit time series contain time stamps for each edit event for each article. We also used the MediaWiki API, from which we got the edit time series for the whole period the article existed.
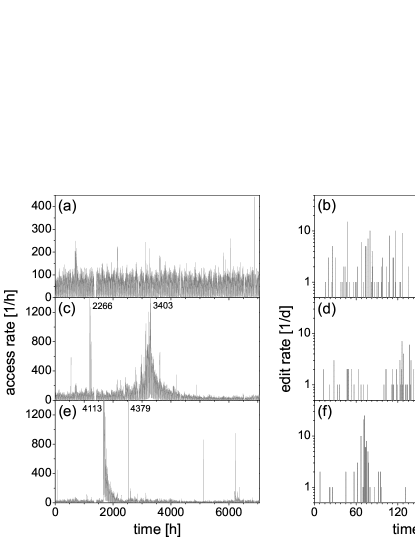
Figures 1(a,c,e) show three representative time series of hourly access-rate data . One can distinguish several types of variations: stationary fluctuations [Fig. 1(a)], an apparently ’endogenous’ burst [Fig. 1(c)] with significant precursory activity, and an ’exogenous’ burst [Fig. 1(e)] marking the dynamic response to a major event. In addition to random fluctuations and bursting activity, we observe daily and weakly activity patterns in the access rates for most Wikipedia articles. Periodic minima correspond to the night-time hours, although their positions depend on the time zone of the readers and thus on the language of the articles. Recurring weekly patterns are also present in many articles.
Figures 1(b,d,f) show the edit time series of the three representative articles. In this case, the total number of article edits is displayed for each day. In the report, we denote the number of edits per hour by . Note that the edit-rate shown in Fig. 1(f) peaks on the same day as the access rate of this article (see Fig. 1(e)), but there is no such relation for the other two articles.
For this study, we selected three groups of Wikipedia articles. Initially we chose the articles manually, but then, in order to get more statistical relevance, we did the procedure automatically by a computer program.
Group 1 contains only Swedish articles of local interest, which do not have a corresponding English article. To systematically identify such Swedish articles, we first compiled a list of all Swedish articles in our data base (from 2009), then sorted this list by the total number of accesses for each article during our observation period, and finally picked the 750 most-accessed articles without an Interwiki link to an English language version. We focused on the frequently accessed articles, since random fluctuations of normalized access and edit activity are weaker compared with rarely accessed articles and diurnal variations can be studied more reliably. For example, the error bar of is , so that the error bar of the normalized time series decreases with increasing average access rate .
Group 2 contains 750 Swedish articles of global interest, which have an Interwiki link to an English language version, together with the corresponding English articles from the main English Wikipedia. The English Wikipedia was chosen because it is the largest, and our main focus was on users possibly looking at the English version rather than the Swedish version. Again, we focused on the articles most frequently accessed in the Swedish version.
(a) 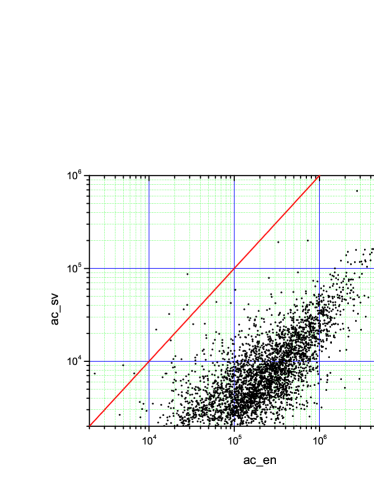 (b)
(b) 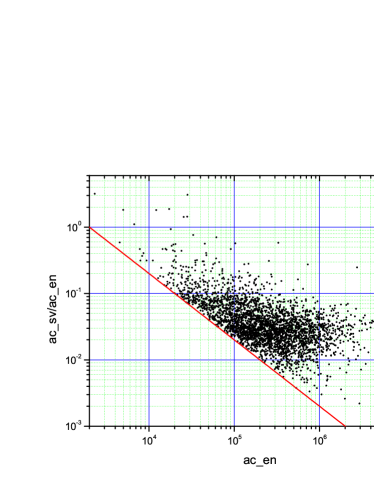 (c)
(c) 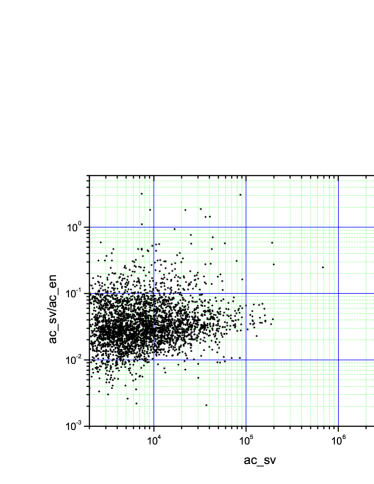
Group 3 is a subgroup of the second group and defined for international comparison. In addition to Swedish and English we chose five other languages and included the articles with corresponding versions in all seven Wikipedias. We chose the Finnish and the Dutch Wikipedia, since their total numbers of articles are similar to the Swedish Wikipedia, and they are also in Europe. They are thus expected to have similar characteristic features. The Hebrew Wikipedia is also similar to the Swedish regarding the total number of articles, but Israel is in a different time zone and switches to daylight-saving time on different days of the year compared with Europe and the US. The Korean and the Japanese Wikipedias are almost as large (considering the amount of articles) as the Swedish one, but located in a time zone with very large difference and no daylight-saving time. So we chose them in order to have a reference with different attributes. For each language we created a list of pages with Interwiki links to the original Swedish articles.
Hourly access rate time series and edit event time series were extracted for each article in each list. In order to identify possible differences between normal Wikipedia articles (original namespace 0) and other kinds of Wikipedia pages (media pages, discussion pages, etc., namespace ), we also compared the results for the full groups 1-3 with results for restricted groups 1’-3’, in which all pages with namespace were excluded.
(a) 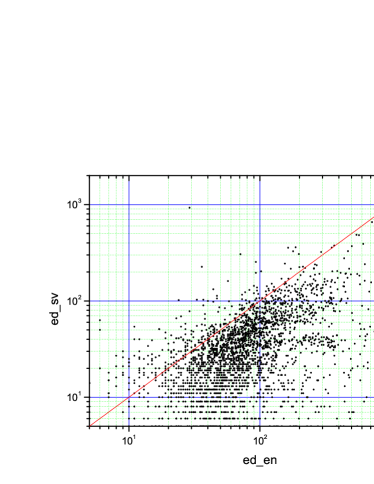 (b)
(b) 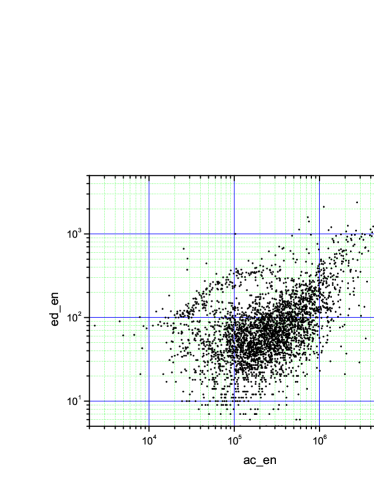 (c)
(c) 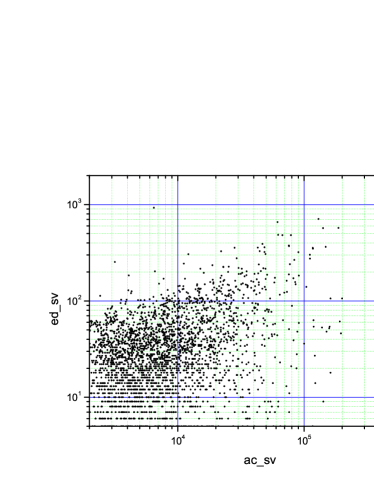
III Correlations of Total Access and Edit Volumes
In this Section we study total access volume and total edit volume for all articles in group 2, i. e., the Swedish articles with corresponding English version, and the corresponding English articles.
Figure 2(a) shows the total number of accesses to the Swedish page versus the total number of accesses to the corresponding English page. In most cases, the English pages are accessed about 20-50 times more often than the Swedish pages. Only very few pages were accessed more frequently in Swedish than in English (above the red line). Figures 2(b,c) show the quotient of the total number of accesses in Swedish and English Wikipedia versus access volume in English and in Swedish, respectively. A clustering can be seen in (b), where the quotient is constant around 2-5 percent for the different numbers of accesses. There seems to be another cluster with a larger ratio (around 10 percent) at lower English access volumes. It might represent the pages with general interest but also a particular interest in Sweden. However, the quotient for these pages is still less than one, i.e. there are still more accesses on these pages in English.
Figure 3(a) shows the corresponding results for edit activity of the articles in group 2. Again, the English pages are more frequently edited in most cases. The cross-scatter plots of edit versus access activity show a sub-cluster of very frequently edited but less frequently accessed pages in English (Fig. 3(b), top left), which is not so clear in Swedish (Fig. 3(c))). This might by partially due to an increased frequency of so-called edit wars in the English Wikipedia compared with the Swedish version; possibly edit wars are fought in English more often than in Swedish.
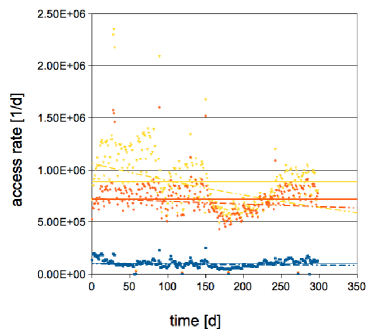
We also tried to study the effect of the creation of an English Wikipedia article on the access volume of the corresponding Swedish version which existed already before. For this approach, we identified – independent of the groups 1-3 described in Section 2 – all those Swedish Wikipedia articles, for which a corresponding (Interwiki-linked) English version was created between April 2009 and July 2009. Although the automated search for such a creation pattern yielded several hundreds of articles, many of them had to be dropped in a manual checking procedure because of pre-existing but differently linked English articles. Finally, only about one-hundred articles remained. The statistics of the access volume changes for the Swedish versions turned out to be not significantly different before and after the English version was created. The main reason for this negative results lies in the rather strong variations of article access volume throughout the observation period. It was not possible to eliminate the bias of the general growth of overall Wikipedia access volume (see also Section VIII), because this growth was far from constant. Furthermore, during some month of our observational period significant drops also occurred, see Fig. 4. These drops are partly due to access traffic missing in the server statistics.
Altogether, we can conclude that access volume for typical Swedish articles decreases by less than a few percent when an English version is created. This is a major result, since it shows that English articles do not draw away much attention from Swedish articles. There are further implications towards the main question. Most people read articles in Swedish if they exist, even if they might also read the English article. This raises another question: is the number of Wikipedia readers increasing just as there is more information available? How does this work with a usual market? It contradicts a bit the old economic theories (proven to be incorrect) that assumed that people are just consuming more if more products are available. More detailed research based on data from longer time periods will be required for answering such questions. With our restricted data base we also could not study the reverse effect, i.e., possible changes of access volume of English pages when a Swedish version is created, because statistics are even worse for this direction. We assume that the influence is marginal (if present at all) and could only be measured in much larger studies.
IV Weekly and Diurnal Variations in Groups 1 and 2
In this Section we compare weekly and diurnal variations of access rates for (i) the Swedish articles of local interest (group 1), (ii) the Swedish articles on topics of global interest (group 2) and (iii) the corresponding English articles (also group 2). For the weekly variations we counted for each day of the week the access in all pages and divided it by the total number of accesses of all pages. For the diurnal variations we did nearly the same, but counted over every hour of the days, or, in other words, treated all days of one week the same.
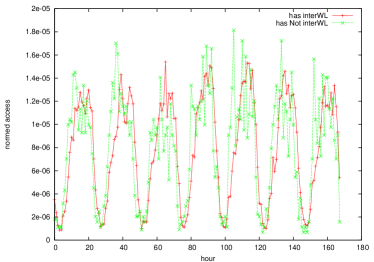
Figure 5 shows the results for the Swedish pages in groups 1 and 2. There is no significant difference in access behaviour for the pages with our without existing English version. The pages with the Interwiki links (global interest) were similarly often accessed during the night respectively the day as the pages without such links (regional interest). No distinct group of people knowing Swedish (and thus looking at the pages in group 1) but preferring the English version (and thus not looking at the Swedish versions in group 2) can thus be identified from studying weekly variations.
(a) 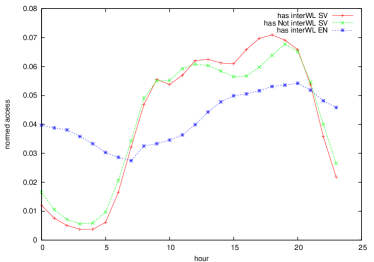 (b)
(b) 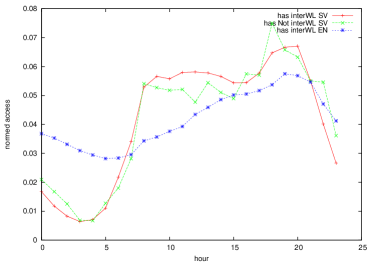
Looking at diurnal variations yields better statistics and can thus identify slight differences between the two groups. Figure 6 shows that the diurnal variations for the Swedish pages with and without links are close but not completely identical. Diurnal variations for the English pages, on the other hand, are very different and much less, since English is used all over the world. The first as well as the last hours in the plot represent the night (time is according to UTC). Obviously, one can find much less access for the Swedish versions there. This is logical because during the night most of the people are asleep and do not access Wikipedia. Nevertheless the amount of access is never zero. However, the drop is strongest for the Swedish pages in group 2, which have a corresponding English version. Therefore, if we assumed that a large fraction of the people reading Swedish articles at 3 or 4 o’clock at night live outside Europe, we could conclude that Swedish versions are more frequently preferred by Swedish users in Europe than by Swedish users in other parts of the world. At least approximately one third of the Swedish users in other parts of the world prefer to look at the English version, if it exists (the ratio is estimated at night-time hours 3 and 4 o’clock in Fig. 6(a)). For manually selected articles no such differences could be established (see Fig. 6(b)), because statistics are worse.
In general, Swedish pages in groups 1 and 2 show a typical diurnal profile. In the hours of the early morning there is a rising of the number of accesses as more and more people get up and check something on Wikipedia. There are two typical maxima: one around noon time and the other one around 7 p.m., corresponding to the work-life rhythm of the people. So in the Swedish Wikipedia the day-night-cycle is very distinctive, but not in the English Wikipedia. The slight shift in the position of the second peak for Swedish articles in groups 1 and 2 may be also interesting, since it might indicate that people tend to look at articles of more regional character later in the evening.
V Diurnal Variations of Access Rate in Group 3
In this Section the diurnal variations of access rates are studied for each of the seven languages in group 3.
(a) 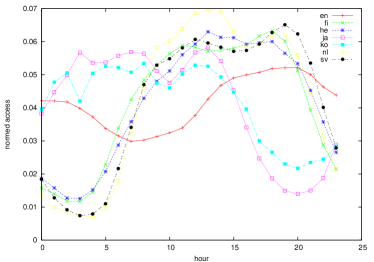 (b)
(b) 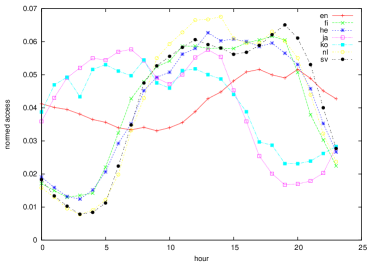 (c)
(c) 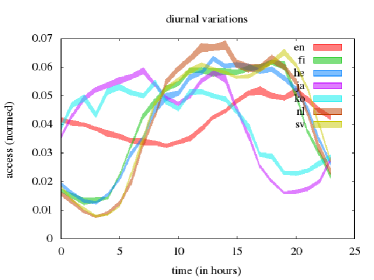
Figure 7 shows that the Wikipedias we chose because they are similar to Swedish (Finish, Dutch, and Hebrew) also show similar results for the diurnal variations. The day-night-cycle is very distinctive, and the maxima at lunch time and in the early evenings are similar as well. Korean and Japanese day-night-cycle are less distinctive, possibly because of emigrants in the US and elsewhere. Diurnal variations for English are very different because of the global context. Nearly the same results are found for normal articles and all pages (namespaces) in group 3. Figure 7(c) shows that the standard deviation for all languages are low, so that the differences between languages are significant in most cases.
V.1 Summertime and Wintertime
(a)  (b)
(b) 
(c) 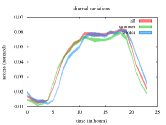 (d)
(d) 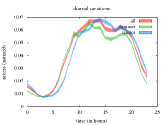
(e) 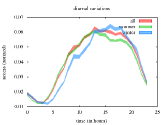 (f)
(f) 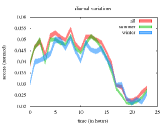
(g) 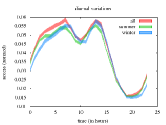
For Fig. 8 the hours of access where split into two groups: hours of summertime and of wintertime. The different days of change and presence or absence of daylight-saving time in each country were taken into account. The effects of different time zones in Japan and Korea compared to the European countries are clearly visible. Interestingly, the two peaks during daytime are much more pronounced in Japan and practically absent in Israel during wintertime.
V.2 Intermediate Month in Israel
(a) 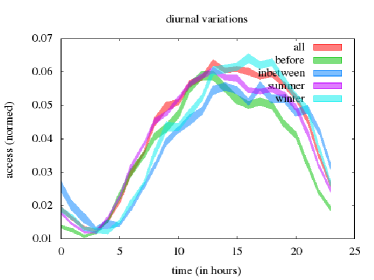 (b)
(b) 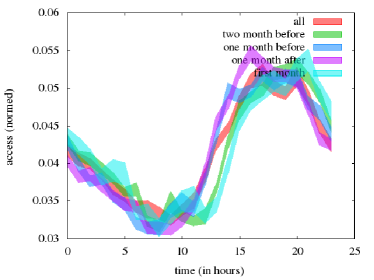
Additional information can be obtained from the data of the Hebrew Wikipedia, since the change from summertime (daylight-saving time) to wintertime occurred approximately one month earlier than in Europe and in most other countries. This effect can be used to distinguish users of Hebrew Wikipedia located in Israel in other parts of the world. Although the changes seen in Fig. 9(a) do not appear to be fully systematic, one can see that the behavior during the first month of wintertime (blue) is much more similar to the other months of wintertime (light blue) than to the last month of summertime (green). This indicates that most users of the Hebrew Wikipedia are actually located in the land of Israel and not in Europe or the US. We have also tried to identify changes in access volume for the English Wikipedia this way to see if people in Israel are using it, see Fig. 9(b). However, the fraction of Israeli users of the English Wikipedia is too small compared with other users, so that changes due to Israeli daylight-saving time are not significant in English Wikipedia access volumes. Random variations from month to month turned out to be larger than these effects.
V.3 Linear Combination Analysis
In another analysis step we have used two functions of diurnal variations as templates and linearly combined them to express a third one. This procedure corresponds to the assumption that, e.g., the diurnal variation of Hebrew Wikipedia usage during the first month of wintertime in Israel is composed of users from Israel (who approximately follow the typical Hebrew wintertime pattern) and users from other countries (who approximately follow the typical Hebrew pattern for the last month of summertime). The result is that a coefficient of only 0.011 appears in front of the last-month-of-summertime pattern (foreign users), while 0.928 appear in front of the wintertime pattern (users in Israel). This results confirms that most users of the Hebrew Wikipedia are located in Israel and shows that meaningful results can be obtained from such approximation tests.
| first template | delay | first coeff. | English coeff. |
|---|---|---|---|
| Finish | 1h | 1.15 | |
| Dutch | 0h | 0.89 | 0.12 |
| Japanese | 8h | 1.31 | |
| Hebrew before | 1h | 1.21 | |
| Hebrew summer | 1h | 1.23 | |
| Hebrew winter | 1h | 1.10 | |
| Hebrew between | 1h | 1.34 |
Therefore we tried to express the diurnal variations of Swedish Wikipedia access rates by various templates including the English diurnal variations. The goal was to identify the relation between English and Swedish Wikipedia in comparison with other Wikipedias. Table 1 shows that the corresponding coefficients for the English diurnal variations’ template are negative in most cases. This indicates that the approach is not sufficiently reliable.
VI Diurnal Variations of Edit Rates in Group 3
In this Section the diurnal variations of edit number and edit rates are studied for each of the seven languages in group 3 and compared with diurnal variations of access rate.
(a) 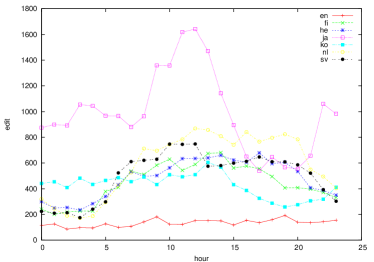 (b)
(b) 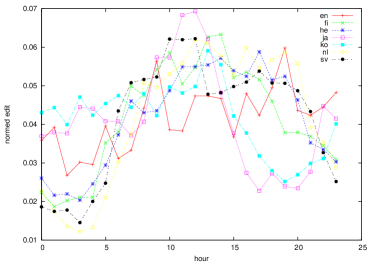
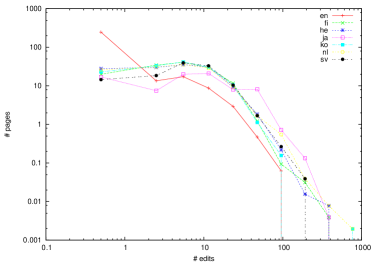
Figure 10 shows that the editorial activity is quite similar for the considered group of Wikipedia articles. For large numbers of edits one can see a power-law decrease of the number of articles according to with with the total number of edits in our observation. English articles are edited somewhat less frequently in our observation period, while Japanese articles are edited somewhat more frequently. Swedish articles are not deviating from most other languages regarding the edit frequency distribution. This results is somewhat surprising. It may be that many of the English articles were already in good shape before 2009. The English Wikipedia might also have more short articles compared to the number of editors or average article length. On the other hand, Swedish editors are usually much more active than, e. g. Koreans or Germans, and Swedish articles tend to be usually a bit shorter.
(a) 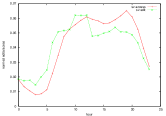 (b)
(b) 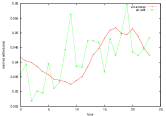
(c) 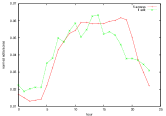 (d)
(d) 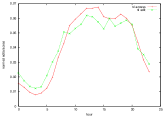
(e) 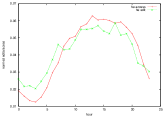 (f)
(f) 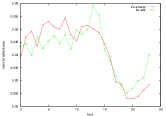
(g) 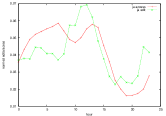
Figure 11 compares the total and the normalized diurnal variations of edit activity for all seven languages. Again, one can see that total edit activity is less in the English articles and more in the Japanese articles. Normalized edit activity variations are much more noisy than access volume variations (see also Fig. 7), since statistics are much worse for edit activity. Nevertheless, Fig. 12 shows significant similarities in the diurnal variation patterns. In all cases, the diurnal curve of edit activity runs ahead of the curve for access volume. This indicates that editing Wikipedia pages is usually done earlier than viewing pages. For Swedish Wikipedia (Fig. 12(a)), the morning peak of editorial activity is much more pronounced than the afternoon peak. In addition, the minimum during the night is twice as large for editorial activity than for access activity (see also Fig. 12(a)). Since typical Wikipedia editors are students with no real regulated work time, editors are probably much more night active than average readers. However, we cannot exclude that the editing of Swedish Wikipedia pages is more often done from abroad than the viewing of Swedish Wikipedia pages. In general, the diurnal variation pattern of editorial activity are too noisy to allow attributing editors to different time zones just based on these patterns in a quantitative way.
(a) 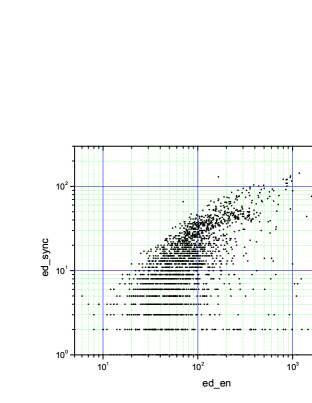
(b) 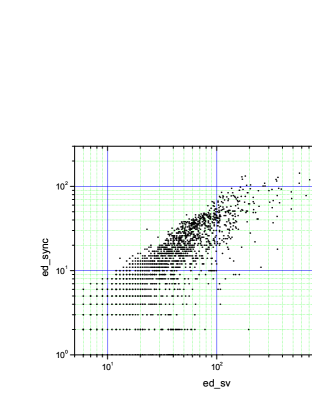
(c) 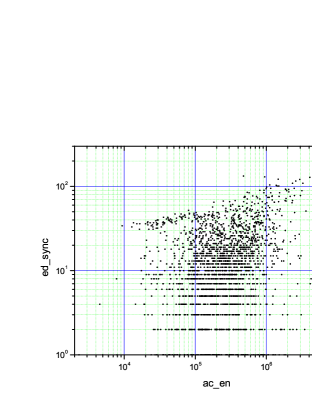
(d) 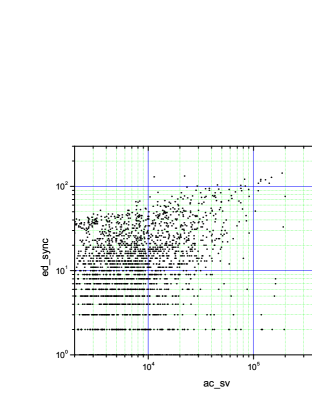
VII Synchronous Edits in Different Language Versions
In this Section we study the occurrence of synchronous edit events in Swedish and English article pairs from group 2. A synchronous edit event means that both language versions of an article (with corresponding topic) were modified simultaneously.
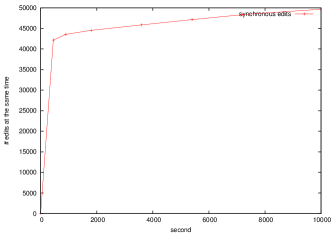
Figure 13 shows the total number of synchronous edits versus the permitted time difference. Clearly, no edits occur exactly at the same time, and if larger time differences are allowed, more edits are considered synchronous. Randomly synchronous edit events cause a linear increase for large time differences. To include as few random events as possible but still identify most of the practically synchronous edit event, we have chosen a threshold of 15 minutes for the definition of synchronous events based on Fig. 13.
Figure 14 shows the resulting number of synchronous edit events versus the total number of edits and the total number of accesses of the Swedish and English version of the article. In Figs. 14(a,b) one can see that there are article pairs where nearly all edits are synchronous (close to the diagonal), while for others there are only very few (or even none, not shown) synchronous edits. However, no clear clustering of different article subgroups is observed. However, Figs. 14(c,d) show that there are clusters of articles with particular frequent synchronous edits (30-50 times in the considered time period), but fairly low total access volumes. These article clusters might be related with edit wars: there are quite active editors with a special focus.
VIII Comparison of Growth of Article Number and Article Quality
Several models are used to describe the growth process of networks. Two very popular network models are the random graph model and the scale free network. Both models describe how the internal structure evolves in time, based on the degree distribution. In the first case, one assumes that all nodes (pages) already exist, and the growth process consists of adding links, one in each time step. In the second case, one page is added in each time step. This means a new link and a new page are created at the same time.
In a real network, like the Wikipedia content network, both processes of adding new pages and adding new links between pages are coupled and cannot be separated from each other. In order to describe the growth of the Swedish Wikipedia project in more detail we analyze the growth rates for the number of pages and the number of links. Because we have several types of links we also compare the growth rates of the number of links for those types. Internal links are links within the same Wikipedia (same language) and redirects to another page of the same Wikipedia. Internal links represent semantic relations between the terms the pages are about or just relations between topics or concepts which are used within a certain page. If the meaning of a term is ambiguous, special pages help to show users all possible meanings (based on other pages). Such pages do not contribute much text, but this structural information is of a high value and increases the usability of Wikipedia. External links are links to another language (Interwiki links) and links to pages outside the Wikipedia project (e.g., references). The frequency of such links represents an important quality indicator for Wikipedia articles.
VIII.1 Evolution of the Degree Distribution
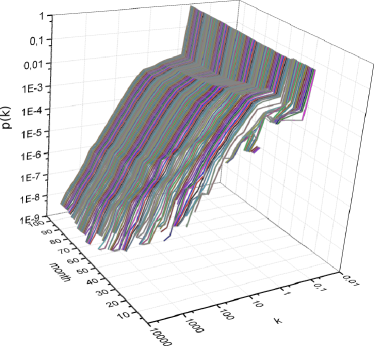
All links contribute to the Wikipedia’s structure which evolves over time. The creation of a new link is a result of an edit activity of an user. Figure 15 shows the temporal evolution of the internal link degree distribution for all pages of the Swedish Wikipedia. Redirects and external links are disregarded in this plot. Already since the beginning in 2002 the degree distribution can be described by a power law, with the exception of pages with a very low degree (low number of links). While pages are added over time, the distribution changes and its power-law shape becomes more obvious, since the range of degrees becomes wider. Actually, most of the pages have much more than ten internal links and are well described by a power-law degree distribution. Only the number of pages with less than ten internal links is smaller than assumed in the scale-free model that predicts power-law degree distributions.
VIII.2 Growth of the Content Network and Structural Changes
(a) 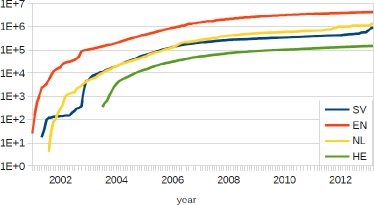 (b)
(b) 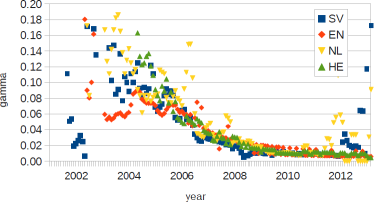
Figure 16(a) shows the total number of pages for four Wikipedia projects (Swedish, English, Dutch, and Hebrew). The number of pages is growing by the number of new pages per time interval month. Figure 16(b) shows the growth rate for an exponential growth model , which has been determined by . Note that an increased has been used if .
In the beginning the growth rate is quite large. Later, a tendency towards saturation can be identified. This shows that the character of edit events changed over time. In the early stage of a Wikipedia project most of the edit events are related to the creation of new pages, while later on the internal structure evolves. For the English Wikipedia project, one can see an intermediate regime with an exponential growth (). Such an exponential growth cannot be unambiguously identified for the Swedish Wikipedia. Interestingly, the page-growth rate has been drastically increasing during the last few months (in 2013) for the Dutch and – even more dramatically – for the Swedish Wikipedia. Acutally, the Swedish and the Dutch Wikipedia started to create articles using bots.
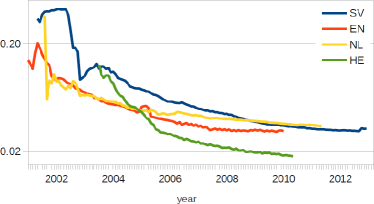
Figure 17 confirms that editorial activity tends to focus more on the addition of links than the creation of new pages during later states of Wikipedia evolution. It shows the ratio of the total number of pages and the total number of links as function of time. For all languages this ratio decreases during most of the time after a relatively large value (around 0.2, i.e., approximately five links per article) in the beginning. The final values are between 0.015 and 0.04, i.e. at approximately 25-60 links per article. For the Dutch and the Swedish Wikipedia the initial change (between 2001 and 2003) is quite sudden. In general, all four languages show a stronger decay of the page number to link number ratio in the beginning and a much slower decay later on. This behavior suggests that an exponential decay model may also be appropriate. However, we cannot find any regimes with unique or approximately constant decay rates for any of the considered four languages. The different decay rates of the page number to link number ratio might also be indicators for two different network growth processes.
The Swedish Wikipedia has initially links per page and later the number of links per page increases to an average of . This is in line with the change in the degree distribution, which is shown in Fig. 15. Here one can see a continuous shift towards a dominating structural growth process, while the growth of content volume – measured in number of pages – becomes less important. The current ratio of page number to link number for the Swedish Wikipedia is quite similar those for the English and the Dutch version, while the Hebrew Wikipedia has about twice as many links per article. During the quick growth of the Swedish Wikipedia article number in the past few months (see Figs. 16(a,b)), the article to link number ratio has slightly grown, which may indicate a slight change of the structure towards properties typical for Wikipedias at earlier stages of evolution. Although, this weak growth is still comparable with typical fluctuations of the ratio (just about twice as large), it may indicate that creating articles by bots leads to a step back in the quality of content.
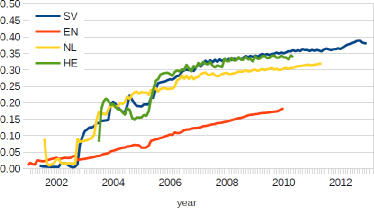
Next we separate the changes of internal and external link numbers. External links (to other language versions or references outside Wikipedia) are particularly important for confirmation of the article content and can thus be regarded as an important quality indicator for the articles. Figure 18 shows the ratio of the number of external links to the number of all links (internal and external). The increasing curves show, that the ratio of external links grows for most of the time in all four Wikipedias. We note that there are two major groups of external links: just ’further reading’ links (often in bad articles) and references (more likely in good articles). The habit of adding references increased in the last years, while one got more discouraged adding just simple links; they are usually also limited to 3-5 per article.
In Fig. 18 one can also find indicators for two regimes for each Wikipedia project except the English: fast growth from approximately 2003 to 2005 followed by a behavior close to saturation after 2005. Table 2 shows the times where the qualitative behavior changes. The transition time A () is determined from Figure 17, which shows the ratio of total number of pages and total number of links while the transition time C () is based on the plot in Figure 18, which shows the ratio of external and internal links. For all languages we find that is before , but the differences vary from 4 to 52 months depending on the languages.
| Language | |||
|---|---|---|---|
| SV | 05/2003 | 10/2007 | 43 |
| EN | 12/2001 | 12/2002 | 12 |
| NL | 01/2002 | 05/2006 | 52 |
| HE | 09/2005 | 01/2006 | 4 |
The Swedish Wikipedia has already reached the largest ratio of external links among all links in 2010 and has continued to increase this ratio during the last 2.5 years (see Fig. 18). This is an indication for a very good reference quality of average articles in the Swedish Wikipedia, better than in the Dutch Wikipedia. Note that the ratio of external links is very much lower in the English Wikipedia, just approximately half as large as in the Swedish Wikipedia (data from 2010). The slight drop of the Swedish curve in Fig. 18 in the last months is probably associated with the drastic increase of the total number of articles (see Fig. 16). However, it is too weak to be considered as an indication of a drop in article reference quality, and there was a significant larger increase during 2012 just before the slight drop. We note that bot generated articles usually have a quite high density of references, meaning just one sentence but 2-3 references to publications which, however, may not be linked using a web link. Overall, we can conclude that the article reference quality of the Swedish Wikipedia has not decreased significantly in the past months despite the quite drastic content increase with nearly doubled article number probably due to article creation by bots.
IX Literature overview
The following list has been compiled in December 2012.
-
1.
In Wikipedia: stats.wikimedia.org
-
Monthly:
- Unique Visitors per Region
- Wikimedia Projects Reach by Region
-
Special:
- Growth per Major Project
Project = Wikibooks, Wikinews, Wikipedia, Wikiquote, Wikisource, Wikiversity, Wikispecial, Wiktionary
- Growth per Language Edition
- Summaries for all Wikimedia Wikis
- Page Views per Project
- Wikipedia Page Views / Page Edits per Country / Language
- Breakdown of Page Views for all Wikimedia Projects
- Server Requests
- Page Edits & Reverts
- User Feedback (with Moodbars)
- Current Status
- Overview Recent Month
- …
-
External:
- Visualizations, an overview
- Google Trends
- Page Views-Trending Topics
- Page Views stats.grok.se / Emw
- Most Edited Pages-Wikirage
- Log Analysis Oct 2007-Dragons flight
- …
-
-
2.
List of publications
http://de.wikipedia.org/wiki/Wikipedia:Wikipedistik/Arbeiten-
Opuszko, Marek et al. (2010): Qualitätsmessung in der Wikipedia. Ein Ansatz auf Basis von Markov-Modellen. In: Schumann, Matthias et al. (Hrsg.): Multikonferenz Wirtschaftsinformatik 2010. Göttingen: Universitätsverlag Göttingen, S. 705-716.
-
Projekt Missbrauch Sozialer Software im Allgemeinen, automatische Erkennung von Wikipedia-Vandalismus und Edit-Wars im Speziellen. WWW: Bauhaus Universität Weimar, Web Technology & Information Systems
-
Graham, Marc (2011): Mapping Wikipedia’s augmentations of our planet. Evaluation of the articles’ Geotags in seven language versions with respect to their world-wide distribution.
-
Marcel Minke studies in his doctoral thesis if the sequence of Wikipedia articles viewed by users can lead to conclusions for their areas of knowledge (Institut für Mathematik und Angewandte Informatik, Universität Hildesheim, Germany).
-
-
3.
Further articles
-
K. Stein and C. Hess, Viele Autoren, gute Autoren? Eine Untersuchung ausgezeichneter Artikel in der deutschen Wikipedia, in: Web 2.0 Eine empirische Bestandsaufnahme, editors: P. Alpar and S. Blaschke, pages 105-129. http://www.springerlink.com/content/978-3-8348-0450-1/#section=214918&page=5&locus=0
-
D. Kinzler, Assessing the quality of Wikipedia articles with lifecycle based metrics, conference paper.
-
A. Dalby, Wikipedia(s) on the language map of the world, English Today 23, 3 (2007)
http://journals.cambridge.org/action/displayAbstract?fromPage= online&aid=1036104 -
U. Pfeil, P. Zaphiris, C. S. Ang, Cultural differences in collaborative authoring of Wikipedia, J. Computer-Mediated Communication 12, 88 (2006)
http://onlinelibrary.wiley.com/doi/10.1111/j.1083-6101.2006.00316.x/full
-