The Age and The Mass of The Herculis Triple-Star System From A MESA Grid of rotating stars with 1.3111The grid is publicly available for retrieval.
Abstract
Her is the second closest Asymptotic Giant Branch (AGB) star to the Sun, and the variable luminous M5 Ib-II member of a triple stellar system containing G8 III and A9 IV-V components. However, the mass of this important star was previously uncertain with published values ranging from 2 - 15. As shown by this study, its fortuitous membership in a nearby resolved triple star system, makes it possible to determine its fundamental properties including its mass and age. We present over twenty years of VRI photometry of Her as well as Wing intermediate-band near-IR TiO and NIR continuum photometry. We introduce a new photometry-based calibration technique, and extract the effective temperature and luminosity of Her, in agreement with recent interferometric measures. We find, K and .
With the MESA code, we calculate a dense grid of evolutionary tracks for Galactic low- to intermediate-mass (1.3 to 8 ) rotating stars from the pre-main sequence phase to the advanced AGB phase. We include atomic diffusion and rotation mechanisms to treat the effects of extra elemental mixing. Based on the observed properties of the Herculis stars, we constrain the age of the system to lie in the range 0.41 to 1.25 Gyr. Thus, the mass of Her lies in the range . We compare our model-based age inference with recent tracks of the Geneva and STAREVOL codes, and show their agreement. In the prescribed mass range for Her, the observed 12C/13C and 16O/17O ratios are consistent (within 2) with the ratios predicted by the MESA, Geneva and STAREVOL codes.
1. Introduction
The details of how a star evolves is mainly governed by three fundamental properties it inherits from its birth place: the chemical composition, angular momentum, and mass. The metal content and the projected rotation velocity of a star can be measured from spectroscopy. The mass assessments, however, are currently possible from either astereoseismic analyses of radially and/or non-radially pulsating stars, or more directly from the analyses of the light and radial velocity curves of double-line spectroscopic eclipsing binary systems. When the seismic and binary information are absent, one classically calculates a grid of stellar models, and tries to fit a range of tracks to the observed global properties of the star, such as effective temperature, surface gravity and luminosity to estimate other physical properties like age, mass and radius. However, this grid-based (isochronal) approach has large uncertainties associated with it (Basu et al. 2012); small uncertainties in , Fe/H, translate into large uncertainties in age and mass of the stars.
In the present study, we pursue the grid-based approach, and establish the range of possible masses for the three stars (with a single age) in the Herculis triple star system. Our rationale is to take advantage of the fortuitous membership of the bright M5 Ib-II Asymptotic Giant Branch (AGB) star in a resolved triple star system with a good parallax to determine its physical properties by simultaneously fitting the observed properties. The recent release of stellar evolutionary tracks (mainly by the Geneva group) provides an excellent opportunity to test the model dependence of the inferred physical properties of Her. For this purpose, we compare MESA with the rotating and non-rotating tracks of (Ekström et al. 2012, hereafter E12), (Lagarde et al. 2012, hereafter L12) and (Mowlavi et al. 2012, hereafter M12).
The stellar mass has an additonal critical role: The surface abundances of AGBs depend on the efficiency of the previous dredge-up episodes in addition to (extra) non-convective mixing mechanisms (e.g. Karakas et al. 2010; Abia et al. 2012). Different proposed extra mixing mechanisms are: rotation and atomic diffusion (Maeder & Meynet 2012), internal gravity waves (Talon & Charbonnel 2005), magnetic dynamo (Busso et al. 2007), and thermohaline mixing after the sub-giant phase (Charbonnel & Zahn 2007; Cantiello & Langer 2010). The latter affects low-mass stars (Stancliffe 2010), so, the net strength of surface enrichments depends explicitly on stellar mass. Since Her has had its 12C/13C and 16O/17O isotope ratios measured, here we provide a rare calibration point for these ratios at an intermediate mass and luminosity on the AGB (El Eid 1994).
2. Literature Debates on the Mass of Her
Historically, the reports on the mass of Her from the literature are inconsistent. They are M⊙ by Deutsch (1956), 2.0 M⊙ by Woolf (1963), 1.7 M⊙ by Reimers (1977) and Thiering & Reimers (1993), 5 to 7 M⊙ by Harris & Lambert (1984) and El Eid (1994), and by Moravveji et al. (2011). This uncertain mass of Her translates into its unknown evolutionary status: assuming a high mass, it could be a red supergiant or a super-AGB star and a progenitor of iron or electron-capture core-collapse supernova (Poelarends et al. 2008; Smartt 2009), while in the lower mass regime ( 5 M⊙), the star would be located near the upper tip of the AGB.
The membership of a bright AGB star in a nearby multiple star system is an excellent opportunity to determine the mass and evolutionary properties of an AGB star. Very few AGB stars have reliable ages and masses. We previously studied the Her light curve in Moravveji et al. (2010), and extracted the dominant pulsation periods. The purpose of this second paper is to constrain the parameter space of the global physical properties of Her - i.e. its mass, effective temperature and luminosity - for a subsequent asteroseismic modelling.
Firstly, we introduce the Herculis system in Section 3 and our photometric compilation in Section 4. In Section 5 we calibrate the effective temperature based on the strength of the TiO 7190 Å absorption bands. In Section 6 we derive the time-variable luminosity and radius of Her. Based on these, we set up a dense grid of evolutionary models (Section 7). In Section 8, we establish the most likely range for the age of the system and masses of its individual members, and compare our findings with those from three other codes. As a by-product of the grid calculation, we additionally present the explicit dependence of mixing of C and O isotopic ratios on the stellar mass during the AGB phase. We discuss our results in Section 9.
3. The Herculis System
| Her | Her A | Her B | ||||||||||
|---|---|---|---|---|---|---|---|---|---|---|---|---|
| Value | Ref. | Note | Value | Ref. | Note | Value | Ref. | Note | ||||
| Spectral Class | M5 Ib-II | (a,c) | (1) | G8 III | (d) | A9 IV-V | (d) | |||||
| [K] | 327146 | (g) | (2) | 4900150 | (d) | (3,4) | 7350150 | (d) | ||||
| 328589 | (h) | |||||||||||
| 326040 | (i) | (5) | ||||||||||
| 4.250.30 | (h) | |||||||||||
| 3.68 | (d) | (3) | 2.100.04 | (d) | (3,6) | 1.41 | (d) | (3) | ||||
| [mag] | 3.3500.003 | (c) | 5.6 | (a) | 6.6 | (f) | ||||||
| [mas] | 33.00.8 | (g,i) | (5) | |||||||||
| 31.510.08 | (h) | (7) | ||||||||||
| 39.321.04 | (j) | (8) | ||||||||||
| 37.222.94 | (k) | |||||||||||
| [pc] | 11016 | (l) | ||||||||||
| [ yr-1] | 1.1 - 1.5 | (d,e) | ||||||||||
References. — (a) Deutsch (1956), (b) Keenan & McNeil (1989), (c) This study, (d) Thiering & Reimers (1993), (e) Reimers (1977), (f) Woolf (1963), (g) Dyck et al. (1996), (h) Perrin et al. (2004), (i) Benson et al. (1991), (j) Weiner et al. (2003), (k) Richichi & Percheron (2002) (l) van Leeuwen (2007).
Note. — (1) From Coudé Spectroscopy of Deutsch (1956), (2) See Figure 2, Table 4 and Section 6. (3) We take the mean from Thiering & Reimers (1993), and correct for the underestimated distance (70 pc). (4) An error of 150 K in temperature for Her A is assumed. (5) K-band interferometry (m, m), (6) An assumed error of 0.1 mag in , translates to an error of , (7) Corrected to the revised Hipparcos distance, K-band interferometry, (8) Interferometry in mid-infrared (9.5 to 11.5m). The mid-infrared diameter of AGBs is up to 30% larger than their corresponding near-infrared diameter.
Herculis is an extensively studied system, and is composed of three stars. Based on the literature, several properties of the system is known, up to varying accuracies (e.g. Deutsch 1956; Reimers 1977; Thiering & Reimers 1993). McAlister et al. (1989) speculate the presence of the fourth or even fifth members.
The primary Her (Rasalgethi, HD 156014, mag, mag) is an M5 Ib-II (Deutsch 1956; Keenan & McNeil 1989) semi-regularly pulsating bright giant. According to the Morgan & Keenan (1973) classification, the spectra of Her is a standard for its subclass. The secondary, Her (HD 156015, ) is a spectroscopic binary itself (Thiering & Reimers 1993), consisting of a G5 III giant (hereafter Her A) and an A9 IV-V dwarf (hereafter Her B). The primary and the secondary are 4.7 arcsec distant (Jeffers & Vasilevskis 1978), so our photometry of the system (Section 4) includes the flux from three members. Where necessary, we have replaced the first Hipparcos parallax of Perryman et al. (1997, mas) with the revised value of van Leeuwen (2007); thus, the distance to the system is
| (1) |
With the parallax and the disk angular diameter expressed in milliarcsec (mas) the limb-darkened radius of the star can be assessed by
| (2) |
The angular diameter of Her is already measured by different interferometry groups. Figure 1 in Perrin et al. (2004) addresses the strong wavelength dependence of the angular diameter measurement, from near- to mid-IR (Weiner et al. 2003). The average of the limb-darkened K-band interferometry of Perrin et al. (2004) - from 1996 to 1997 - is mas. Similar assessment of Richichi & Percheron (2002) yields mas, and Weiner et al. (2003) give . Benson et al. (1991) measurement gives almost consistent angular diameter mas (similar to Dyck et al. 1996). Adopting the angular diameter measure of Perrin et al. (2004), the near-IR limb-darkened interferometric radius of Her is
| (3) |
The large error in the radius is dominated by the parallax uncertainty. Also, as shown in this study, the diameter of Her varies by up to 14%. Additionally, Perrin et al. (2004) find K. Correcting for the revised 2007 Hipparcos parallax, we estimate the luminosity of Her as .222 Using Eq. 3 and the Stefan-Boltzmann law, dex.
Spectroscopy of Deutsch (1956) shows that the Her system is enshrouded in an envelope of dust. This was later confirmed by the observations of Thiering & Reimers (1993) that the extent of the envelope is larger than the semi-major axis of the visual binary orbit. Recently, interferometric observations of Tatebe et al. (2007) at m over the period 1989-2004 show that Her has experienced a major outburst during 1990 in which has been ejected into the ISM, with an approximate ejecta speed of 75 km s-1. The same study finds that the shell has a temperature of 518 K, and an inner and outer angular radius of 250 and 350 mas, respectively. The mass loss rate of Her is yr-1 (Reimers 1977; Thiering & Reimers 1993).
Table 3 summarizes a collection of physical parameters of Herculis stars. They are relevant to our study, and are collected from the literature. Where necessary, we have corrected the first Hipparcos parallax of Perryman et al. (1997, ) with the revised value of van Leeuwen (2007).
For Her, the spectroscopic measurements of the surface yields of CNO-processed elements date back to the studies of Thompson & Johnson (1974) and Harris & Lambert (1984). These observational evidences - when directly compared to the theoretical model yields - help gauging the role of different flavours of composition mixing (e.g. El Eid 1994; Cantiello & Langer 2010). We adopt 12C/13C = , 16O/17O = and 16O/18O = from Harris & Lambert (1984).
4. Multi-Color Photometric Observations
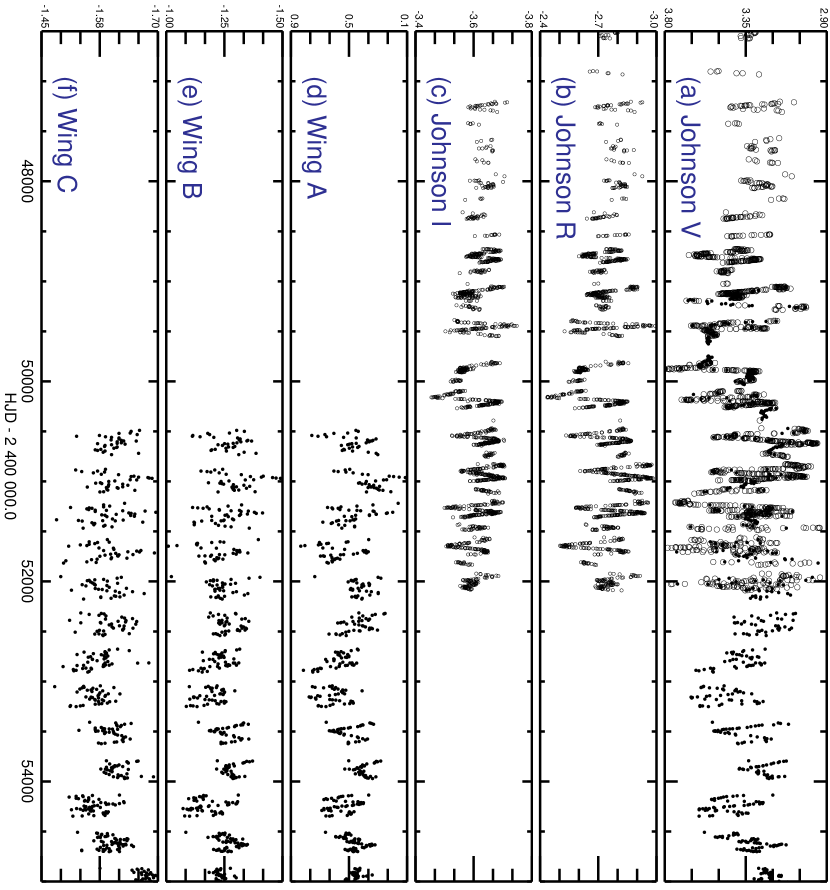
The photometric data for the Her system was obtained for more than two decades, and the data are compilations of observations from two different sites. The photometry has been conducted with the broad-band Johnson V-filters and three intermediate-band Wing ABC filters (Wing 1992) in Villanova University (VU) by two 20- and 28-cm Schmidt Cassegrain telescopes. The broad-band Johnson VRI photometry was obtained using the Fairborn-10 (T2) Automatic Photometric Telescope (APT, Henry & Eaton 1995) at Tennessee State University (TSU). The starting and ending observation dates for each dataset are different. The sampling is not regular and depends on the visibility of the star and the weather condition. The TSU observations commence in March 1986, and were discontinued in June 2001. The TSU photometry are first published in Percy et al. (2001). For the details of our dataset and the observations time baseline see Table 2. In this table, the first column gives the designations for the filters. The second column gives the central passband wavelength accompanied with its corresponding full width at half maximum (FWHM). The third column shows the observation site. The fourth column gives the maximum and minimum of the magnitude in the corresponding filter for the entire observations due to stellar variability. Note that the variability at shorter wavelengths has larger amplitudes. The fifth column is the standard error. The sixth column gives the start and end dates for the observations at the corresponding site, and , respectively. They are expressed in modified Julian date, MJD HJD 2 400 000. The seventh column gives the Rayleigh limit in units of d-1, where is the observation time baseline in days. The last column gives the number of observations taken over the prescribed duration per each site. This photometry includes all three components in the measure but the brightness is dominated by the bright, luminous M5 Ib-II star.
| Filter | wavelength aafootnotemark: | Observation | Max; Min | Std. Error | ; | ||
|---|---|---|---|---|---|---|---|
| (FWHM) [Å] | sitebbfootnotemark: | [mag] | [mag] | [MJD]ccfootnotemark: | [ d-1] | ||
| Johnson Vddfootnotemark: | 5500 (700) | VU | ; | 0.003 | 49043; 55076 | 1.657 | 728 |
| Johnson Vddfootnotemark: | 5500 (700) | TSU | ; | 0.004 | 46510; 52089 | 1.792 | 1766 |
| Johnson R | 6400 (1400) | TSU | ; | 0.002 | 46510; 52089 | 1.792 | 1757 |
| Wing-A (TiO) | 7190 (110) | VU | ; | 0.005 | 50489; 55076 | 1.657 | 547 |
| Wing-Beefootnotemark: | 7540 (110) | VU | ; | 0.003 | 50489; 55076 | 1.657 | 547 |
| Johnson I | 8800 (1500) | TSU | ; | 0.001 | 46510; 51993 | 1.823 | 1697 |
| Wing-Cfffootnotemark: | 10400 (420) | VU | ; | 0.002 | 50489; 55076 | 1.657 | 547 |
Both the VU and TSU observations were conducted differentially with respect to comparison stars. The offset was removed by finding the shift between the two datasets that minimizes the standard deviation of the combined dataset during the observed overlapping runs. The compiled light curves in Johnson V and Wing ABC filters are shown in the Appendix (Figure 11). Note that, from shorter to longer wavelengths, the star appears brighter (see Benson et al. 1991, and fourth column in Table 2), and the amplitude of light variability decreases. This is similar to the pulsation behaviour of Mira-type stars (e.g. Lockwood & Wing 1971).
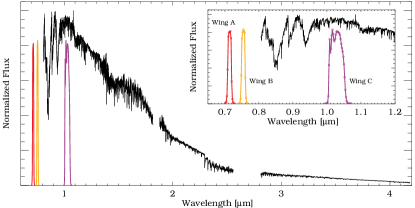
Figure 1 presents the low-resolution spectra of Her published by Rayner et al. (2009). It covers the wavelength range of 0.8 to 4.2 micron. The Wing ABC transmission functions are also plotted. These three filters were selected by Robert Wing (private communication) for measuring temperatures and luminosities of evolved M-type stars. The TiO (, 0, 0) 7190 absorption band strength is very sensitive to the temperature for evolved M-stars. The A-filter with =7190 Å is centered on the TiO band, and serves as a reference measure of the TiO band strength. The B-filter at =7540 Å is located essentially on the continuum region. The measured flux in C-filter at =10400 Å can be corrected to give the bolometric magnitude and luminosity (Section 6). In the Appendix A, we show that this bolometric correction to Wing C filter is in fact BC mag. The main conclusion from Figure 1 is that the Wing C filter does not suffer from strong absorption bands, and measures the peak of continuum of an M5 AGB. Compared to the Johnson V-bandpass, it also suffers less from strong TiO absorption bands.
5. Effective Temperature Calibration
5.1. Input standard stars
Levesque et al. (2005) tabulate their findings on spectrophotometric temperature calibration for 74 galactic red supergiants based on color combined with synthetic MARCS stellar atmosphere models. For bright M5 AGBs, their Table 5 gives K, which does not agree with derived from interferometry (Table 3). However, Her is the only M5 star in their list, thus the derived and V-filter bolometric correction (BCC) for such late type stars might be subject to a bias. Therefore, the M5 entry in Table 5 of Levesque et al. (2005) is considered unreliable. Therefore, we do not rely on this M5 entry in Levesque et al. (2005). Our independent calibration yields K cooler for M5 AGBs.
Eighteen standard stars were selected from Wing (1978), and were observed at the VU site through Wing ABC filters, repeatedly. This helps defining two color indices - and - for each of these stars. Following Wing (1992), the color index
| (4) |
in M-type giant stars is sensitive to temperature variations, since it tracks the slope of the tail of Planck distribution. Hence, it can be calibrated to yield the effective temperature of such late type stars. Yet, some absorption bands may interfere. Thus, the other color index which is called the TiO index and defined as
| (5) |
is less affected by TiO absorption lines, and tracks the changes in the temperature better (Wing 1992). The complete list of Wing standard stars, along with their measured mean is presented in Table 3, where the first column is the identification number, and the second column gives the stars’ HR designation. The third column gives the spectral classification taken from Wing (1978). The fourth column gives the effective temperatures taken from Levesque et al. (2005). The last column is the average for each of the program stars. Since could be time variable for the standard stars as for Her, we average over their values during our long-term monitoring. The list of program stars is sorted in the decreasing .
Figure 2a shows the time variability of . Due to the observed Long Secondary Period (LSP, Kiss et al. 2006; Percy et al. 2001) of Her, varies with the period of days; this can serve as an evidence for the pulsation origin of the LSP.

| ID | HR Number | Spectralaafootnotemark: | bbfootnotemark: | ccfootnotemark: |
|---|---|---|---|---|
| Class | [K] | [mag] | ||
| 1 | 6705 | K5.0 | 3940 | 0.202 |
| 2 | 248 | K5.4 | 3920 | 0.222 |
| 3 | 337 | M0.5 | 3934 | 0.349 |
| 4 | 8284 | M1.0 | 3817 | 0.400 |
| 5 | 48 | M1.5 | 3778 | 0.474 |
| 6 | 45 | M2.0 | 3736 | 0.560 |
| 7 | 750 | M2.5 | 3690 | 0.627 |
| 8 | 9064 | M3.0 | 3641 | 0.759 |
| 9 | 9089 | M3.4 | 3599 | 0.892 |
| 10 | 211 | M4.1 | 3522 | 1.026 |
| 11 | 4483 | M4.5 | 3475 | 1.250 |
| 12 | 4909 | M5.1 | 3401 | 1.424 |
| 13 | 587 | M5.1 | 3401 | 1.508 |
| 14 | 5512 | M5.5 | 3348 | 1.576 |
| 15 | 4267 | M5.9 | 3294 | 1.725 |
| 16 | 7941 | M5.9 | 3294 | 1.618 |
| 17 | 6146 | M6.6 | 3194 | 1.694 |
| 18 | 3639 | M7.1 | 3118 | 1.941 |
5.2. Calibrating versus Color Index
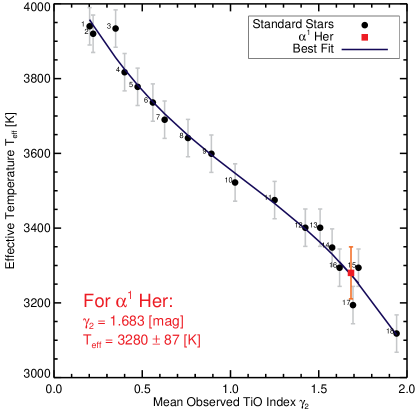
To arrive at a reasonable calibration for versus TiO index , we use a Levenberg-Marquardt least-squares (Markwardt 2009) order polynomial fit to the entries in Table 3, and derive the best fit coefficients. The reduced chi-square goodness of fit is = 1.02. Very similarly, could also be used, but we prefer for its higher sensitivity to temperature changes due to TiO absorptions. Therefore, we end up with the following relation
| (6) |
Compare this with last equations in Levesque et al. (2005). The numbers in the parentheses are the 1- uncertainties for each of the fitting coefficients. The resulting fit is shown as a solid line in Figure 3. The average of the TiO index for Her is mag. Consequently, the average effective temperature after substituting mean into Eq. 6 is K. The uncertainties are evaluated by a Monte Carlo simulation. For the calibration stars in Table 3, the standard deviation in is 31 K, and agrees with the assumed error estimates of Levesque et al. (2005). The agreement between our indirect derivation of and direct interferometric measures (Table 3) is convincing.
Therefore, we utilize this calibration for determining , and calculate the temperature for individual values of at any given epoch for Her. The observed maximum and minimum values of are 1.500 and 1.881 mag, respectively. Consequently, the upper and lower limits of the effective temperature of Her are 3365 K and 3155 K, respectively; they correspond to inferred spectral types of M5 and M6, respectively. This temperature variation indicated by the variability in the -index, can be induced by pulsations. This can be seen from the inferred variations of the star’s radius and luminosity (Figure 2). However, smaller non-periodic contributions to this variability could arise from the growth and decline of starspots from the changes in produced by the presence of large convective cells in the star’s atmosphere (Stothers 2010).
6. Time Variability of Luminosity and Radius
Once the change in the color temperature is accounted for, the calculation of luminosity and radius is straightforward from the Stefan-Boltzmann law . Lattanzio & Wood (2004) and Unno et al. (1989) argue that this relation yields reliable results for the AGBs. With a different calibration, the same law is employed in interferometric observations of nearby Miras and supergiants as a means of direct measurement of their luminosity and radius (e.g. Weiner et al. 2003; Perrin et al. 2004; Lacour et al. 2009). Therefore,
| (7) | |||
| (8) | |||
| (9) |
4.75 is the absolute magnitude of the Sun (Allen 1976), 5.207 is the distance modulus to the Her system from Hipparcos (Eq. 1), and BC mag is the bolometric correction to Wing C filter (Appendix A). The ISM absorption in the Wing C-filter along the Herculis line-of-sight was deemed insignificant. Dyck et al. (1996) also assume zero extinction in near-IR towards the Her system333 But, we are aware that this can impose a bias in the inferred bolometric luminosity.. From Table 2 and Appendix A the bolometric apparent magnitude has a net error of ; therefore, a rough estimate of the uncertainty in the absolute bolometric magnitude is mag, and that of luminosity is dex. The radius variation from Stefan-Boltzman law is
| (10) |
and the relative error in radius is approximately 21%.
Figures 2.a to 2.d show how the time dependence of the TiO index is translated to temporal variations in physical quantities of the star , , and with the period of LSP. When the star is hotter, it is more luminous and smaller. Apparently, stellar pulsation is the most likely mechanism to explain the observed simultaneous variability in temperature, luminosity and radius of the star (Wood et al. 2004; Nicholls et al. 2009). This is a subject of a forthcoming paper.
| Mean | Min | Max | ||
|---|---|---|---|---|
| K) | 3155 | 3365 | 6.4% | |
| 3.86 | 3.97 | 25.8% | ||
| 264 | 303 | 13.9% |
Table 4 summarizes the minimum, maximum, and average values for these calculated quantities; in the last column, MaxMinMean is the relative change in any quantity during our observations. Our derived luminosity is close to the lower limit of Perrin et al. (2004) (see Table 3), and agrees within the error bars. The angular diameter of the star based on Eqs. 1, 2 and 10 is 23.955.03 mas; this is 24% less than the K-band angular diameter measure of Perrin et al. (2004) (see Table 3). Despite the significant disagreement between our inferred angular diameter of Her and that of literature (Table 3), we show in Section 8.3 that our radius assessment has a better agreement with our evolutionary models.
7. Modeling the Herculis Stars
We assume that the three stars of the Herculis system are coeval. We adopt the Solar chemical composition of Asplund et al. (2009), i.e. (see Table 1 in Ekström et al. 2012, and details therein). This choice is supported by the spectroscopy of Hoflich et al. (1986). The differences among spectroscopic classes of Herculis stars (Table 3) imply that their initial ZAMS masses are different. Based on the measurements collected from literature and within their corresponding uncertainties (Table 3), we model the three stars using the state-of-the-art stellar structure and evolution code MESA444MESA is an open-source code accessible from http://mesa.sourceforge.net. The Fortran 90 inlists and modules are also available via http://mesastar.org/. The calculated tracks can be retrieved by directly contacting the corresponding author. (v.4589, Paxton et al. 2011, 2013). Our choice of abundances and other parameters allow us compare our models with recent results of Lagarde et al. (2012), Ekström et al. (2012) and Mowlavi et al. (2012). Below, we discuss the physical ingredients of our MESA grid.
7.1. Rotational Mixing
The initial equatorial rotation rate of Herculis stars are unknown a priori. Therefore, we set up a dense grid (in initial mass) of evolutionary models that take into account the shellular rotation (Heger et al. 2000, 2005). Yet, the choices for the initial rotation rates could be various (compare, e.g. Tassoul 2000; Charbonnel & Lagarde 2010; Cantiello & Langer 2010). Similar to Lagarde et al. (2012) we adopt on the ZAMS, where the critical angular velocity is . is the equatorial radius calculated for a non-rotating case, and is the stellar mass.
7.2. Convective, Overshoot and Thermohaline Mixing
The mixing processes near the stellar core will have an appreciable effect on the duration and width of the main-sequence (MS) phase in the HR diagram (Maeder 2009). For our case, the mixing parameters of Her B critically influenced the age of this star. The convective mixing is treated using the Mixing Length Theory (MLT) of Böhm-Vitense (1958), with . Boundaries of convective zone(s) are located where . The overshooting beyond the boundaries of convective zones are included with the extent of the overshoot zone a multiple of the local pressure scale height, say with =0.10.
Thermohaline mixing has been recently discussed as a source of extra mixing in models of red giant branch (RGB) stars. MESA uses the formulation by Kippenhahn et al. (1980) and Traxler et al. (2011). For applications, see Cantiello & Langer (2010) and Charbonnel & Lagarde (2010). 2D and 3D hydrodynamic simulations of this double-diffusive instability indicate a very slow mixing process acting in low-mass stars (Denissenkov 2010; Denissenkov & Merryfield 2011; Traxler et al. 2011). Thus, while this might have an impact on observable surface abundances, the effect on the internal thermal structure (hence luminosity and stellar age) is predicted to be negligible (Denissenkov & Pinsonneault 2008). In this study, we ignore the thermohaline mixing. Furthermore, we also ignore the extra mixing induced by magnetic fields, but we do include the radiative levitation based on Thoul et al. (1994) and Morel & Thévenin (2002).
7.3. Mass Loss
Dust-driven mass loss from highly luminous cool stars depends sensitively on the mass, radius, luminosity, and metallicity of the star (e.g. van Loon 2006). We employ the Reimers (1977) criteria for RGB mass loss, and the prescription by Blöcker (1995) on the AGB phase
| (11) |
with and expressed in solar units. The transition between the two prescriptions is made when the He mass fraction in the core is less than . The rotationally enhanced mass loss rate is employed, similar to Maeder & Meynet (2001).
8. Results
8.1. The Composite HR Diagram of Herculis System
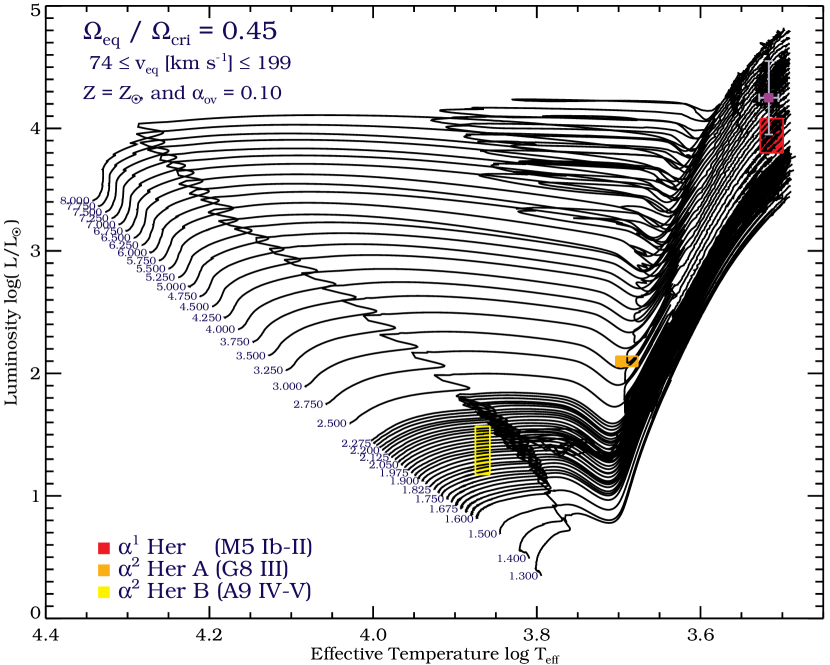
We calculate a dense grid of evolutionary models comprising of 55 tracks. The employed mass range and stepsize in unit of in is
| (12) |
For every track, the evolution calculation is stopped after the core helium depletion (hereafter CHeD), when drops below 3100 K. At the end, the grid consists of more than 353 000 rows of evolutionary information, such as , , etc. The synthetic absolute bolometric magnitude , V-band bolometric correction B.C., and the standard Johnson-Cousins color indices are calculated based on Lejeune et al. (1998). The grid is sketched in Figure 4. The positions of the three Herculis members within their 1 boxes of uncertainty are highlighted based on entries in Table 4; the result of Perrin et al. (2004) is also overplotted.
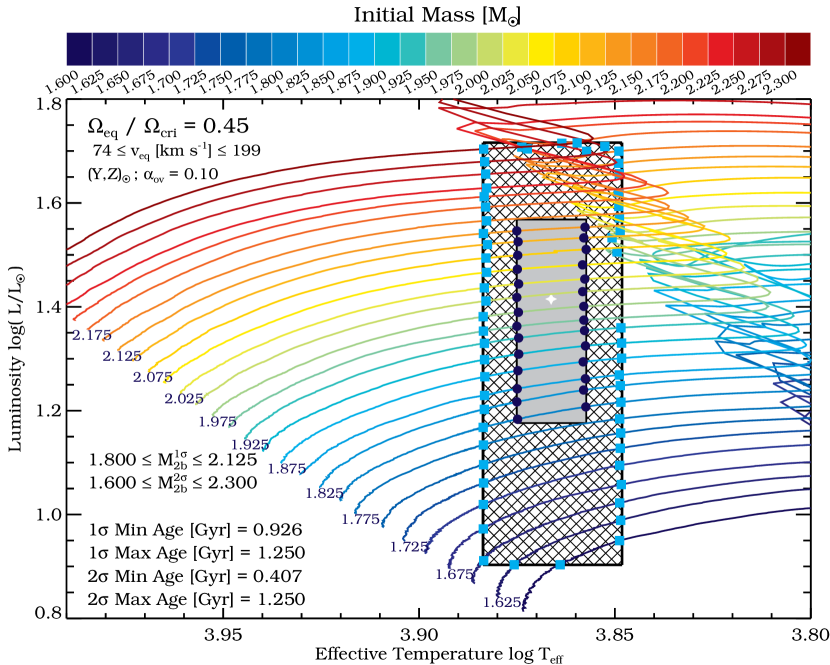
8.2. Constraining the Age of the Herculis System
From Figure 4 and the measured physical properties of Her B (in Table 3 and Section 3) this A9 IV-V star is either in the core hydrogen-burning phase, or has just entered the sub-giant phase. Hence, it is the least evolved (and least massive) member of the system. Because the main sequence evolution of stars is understood with more certainty (see Langer 2012), the model inference for Her B is more robust than for the other two components. Consequently, we base the estimate of the age of the system on the age we infer for the A9 IV-V star Her B. In other words, we assume that the only reason for the differences in evolutionary status of the three Herculis stars lies in their differences in initial masses.
Figure 5 enlarges a small portion of the grid (i.e. Figure 4), and shows models with their respective luminosity and effective temperature lying in the 1 (filled gray) and 2 (cross hatched) boxes of uncertainty for Her B (see Table 3). The filled symbols mark where the tracks enter/exit the highlighted zones, and where we measure the model ages. The lower and upper age limits of the system are assessed based on the age at these flagged points. We address these as the age constraints. Our results within the 1 and 2 uncertainties in and are summarised in Table 5. The timesteps (around the flagged points in Figure 5) are approximately two orders of magnitude smaller than the inferred ages.
| Uncertainty | Minimum | Maximum |
|---|---|---|
| [Gyr] | [Gyr] | |
| 0.926 | 1.250 | |
| 0.407 | 1.250 |
We repeat the same procedure for M12 tracks. For the age of Her B, we find different results: with uncertainty, the age ranges from 0.787 to 1.452 Gyr, and similarly, with 2 uncertainty it ranges from 0.734 to 1.719 Gyr. With respect to M12, the MESA ages roughly differ 14% to 53%. We cannot extend this comparison to E12 and L12 tracks, as their coarse mass spacing does not allow such. In Section 8.4, we address this age comparison again.
8.3. Masses of Herculis Stars from the HR Diagram
We designate the initial masses of Her, Her A and Her B by , and , respectively. From the assumption that the differences in the current evolutionary status of Herculis stars have their origins in their initial masses, , and must obey this inequality
| (13) |
From Figure 5, it is straightforward to find the most viable mass for Her B
| (14) |
M12 tracks, strikingly, give and in close agreement with Eq. 14. Due to the coarse mass spacing in E12 and L12, we decide not to assess masses from their tracks.
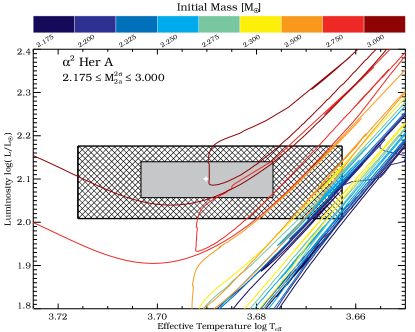
We permitted models with slightly higher masses than in Eq. 14 to deplete their core helium content, to ascend the AGB, and to reach K. Our strategy is to tightly bind and within 1 (and 2) uncertainties to find those tracks that simultaneously match the observed and of these stars, in addition to their ages lying between the minimum and maximum age of the system from Table 5. Figure 7 shows Her A on the HRD. Only the tracks within 2 box can satisfy the above conditions; therefore, the initial mass range for this star is
| (15) |
where the uncertainty is not larger than 0.05 . One of the following evolutionary scenarios applies to Her A: it is ascending the RGB, has just ignited helium in the core, or is on the early-AGB phase.
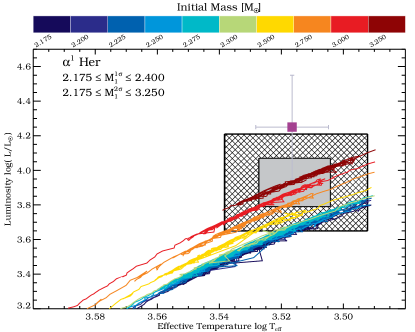
Figure 7 shows the expected location of the primary Her on HRD based on the observations of Perrin et al. (2004) and the present work (Tables 3 and 4). There is reasonable agreement of the luminosity of the primary star with the two approaches. Similar to the previous stars, we assess the evolutionary initial mass of the primary based on its age and location on HRD as
| (16) |
The solar-type pulsation pattern in the primary is already established (Bedding 2003; Kiss et al. 2006; Moravveji et al. 2010). Based on this fact, we earlier estimated the mass of this star to be (Moravveji et al. 2011) using the asteroseismic mass and radius scaling laws (Huber et al. 2011). Though the size of uncertainties are large, the seismic mass is consistent with Eq. 16. In Sections 8.4 and 8.5, we attempt to examine Eq. 16 based on the surface abundances of the primary.
It is worthwhile to mention that the model radius for Her based on our grid lies in the range . This agrees better with our inferred radius in Table 4 than with the near-IR interferometric estimate (Eq. 3). We admit that our treatments of the envelope convection and that of the extended atmosphere of AGB stars in our MESA models are simplistic.
8.4. Agreement in AGB Age Assessment
Figure 8 shows the final (i.e. AGB) lifetime of tracks from MESA, E12, L12 and M12 versus their corresponding initial masses. The ages given by M12 (green line) are significantly less than the rest of models, as the tracks terminate on the subgiant phase. On the higher mass regime, the lifetime of rotating star tracks in logarithmic scale is about 0.1 dex higher than the non-rotating star tracks. This is explained by extra engulfment of hydrogen fuel by the rotating core during the MS phase. Among evolution tracks including rotation, those of L12 have higher ages.
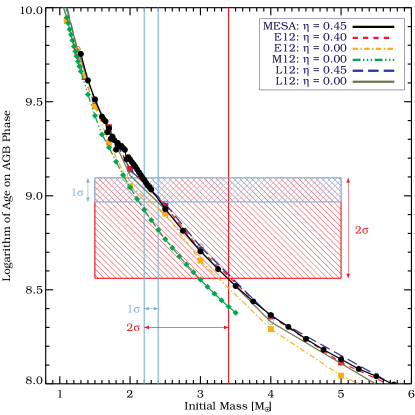
The highlighted 1 and 2 boxes in Figure 8 show the upper and lower bounds of the age of the Herculis system from Table 5. The vertical lines show the initial masses of stars which can reach the AGB phase within the given age (in agreement with Eqs. 16). Based on this, the age constraint from Table 5 is robustly independent of the stellar evolution code used. This places Her among the few AGB stars in our galaxy with known ages.
8.5. Surface Abundance Ratios of Carbon and Oxygen Isotopes
The literature on the spectroscopic abundance analyses of Her is, surprisingly, scarce. Harris & Lambert (1984) measure the surface ratios of the key CNO processed species in the atmosphere of Her. They are 12C/13C = , 16O/17O = and 16O/18O = . The large uncertainty in the latter is not constraining, and we exclude it from our analysis. To our knowledge, there is no record on the detection Li and/or Tc on Her; we conservatively interpret this as the hot bottom burning not occurring in Her, and the mass being below nearly 4 . This complies with Eq. 16.
El Eid (1994) employed these abundance ratios, and concluded that the mass of Her lies in the interval 5 and 7 . However, the models calculated by El Eid did not include rotational and overshooting mixing. During the past two decades, there have been major improvements in the input physics to the stellar evolution codes, mainly to the opacity, EOS and nuclear reaction rates. For this reason, we repeat the same exercise as in El Eid (1994) with MESA.
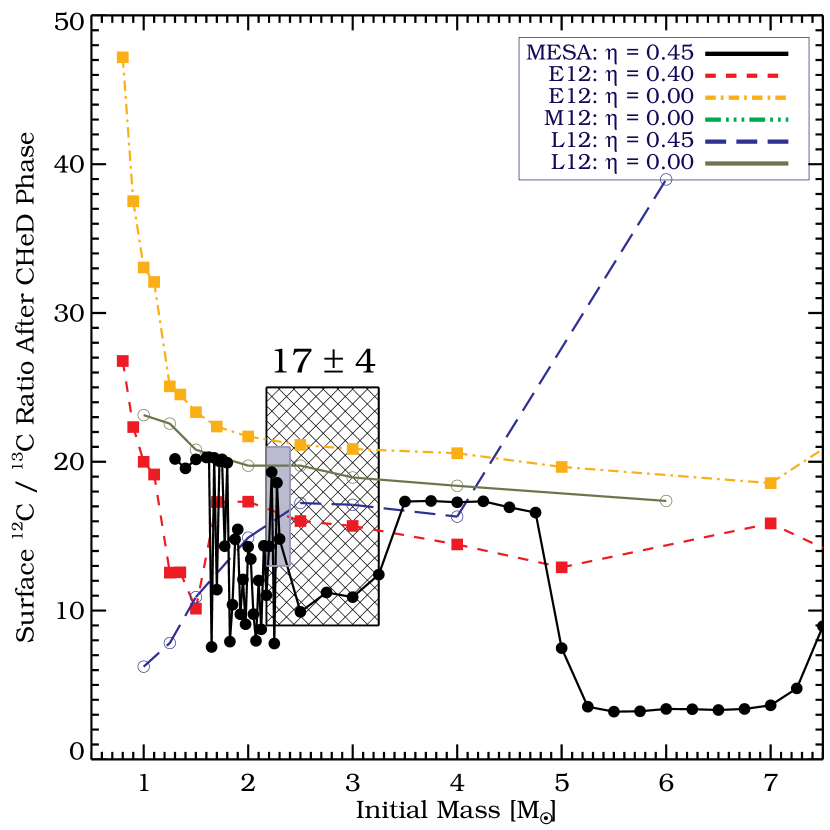
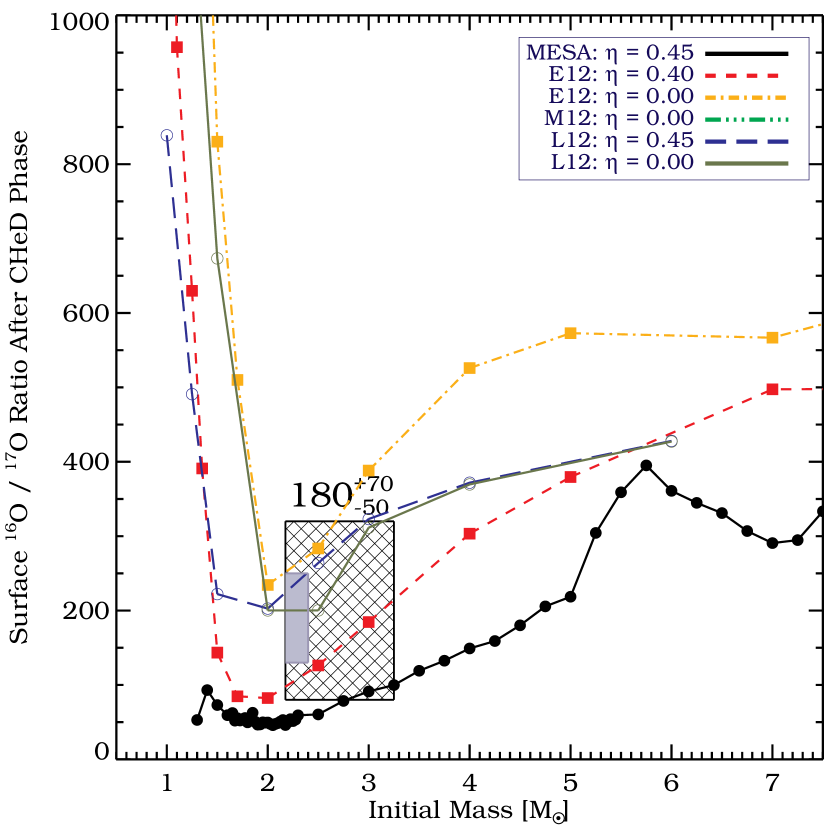
Figure 9 shows the surface abundance ratios of 12C/13C (left panel) and 16O/17O (right panel) versus the initial model masses. We designate these by and , respectively. The observations from Harris & Lambert (1984) within the 1 and 2 uncertainties are highlighted. These two ratios magnify the net contribution from convective and extra mixing mechanisms during the evolution history of the models. We compare the same yields from MESA, E12 and L12 for their rotating and non-rotating tracks. For the large departure of in L12 from MESA and E12, we subsequently present but do not discuss the surface abundance ratios from their rotating stellar tracks.
An inspection of C/13C ratio (Figure 9 left) indicates the different predictions made by different codes. In E12, declines monotonically with the model mass (orange and red squares). The inclusion of rotation gradually mixes extra 13C to the surface and is smaller for rotating tracks compared to their non-rotating counterparts. The non-rotating case of L12 (green empty circles) follows the same trend as E12. In MESA (black filled circles), is irregular on the low-mass regime, and then exhibits a clear variable trend on the higher mass end. Thus, it is not straightforward to assess the 1 and/or 2 mass of Her with any certainty.
The O/17O ratio (Figure 9 right) shows nearly the same behaviour in all codes except MESA: declining sharply with increasing model mass, reaching a dip around , and rising again. In E12, the gradual surface enrichment of 17O by rotation during the MS enforces a deeper dip. The results of L12 are roughly between those of E12. In MESA, the combined effects of atomic diffusion and rotational mixing result in the highest surface 17O enrichment which suppresses . For massive AGBs, the MESA predictions differ from the other models. Once more, the mass assessment for Her is not necessarily agreeing between different codes: with the rotating E12 tracks, we find , with L12 we find , and with MESA, we find . We find none of the mass assessments in good agreement with the predictions of Eq. 16. Therefore, we do not succeed to fine-tune by using surface abundance ratios, and .
9. Discussion and Concluding Remarks
In Sections 5 and 6, we propose a photometric method using Wing ABC filters to exploit the effective temperature (Eq. 6) and luminosity (Eqs. 7 to 9) of evolved - mid-K to mid-M spectral type - stars in agreement with near infrared interferometry. On one hand, direct measurement of angular diameter and for stars based on long-baseline interferometry has some shortcomings:
-
(i)
there are currently few actively operating interferometers that are accessible for the broad astronomy community,
-
(ii)
a limited number of stars fall within the observability of current instruments, according to their apparent magnitude and apparent angular diameter.
On the other hand, our proposed small-aperture photometry does not suffer these limitations, and can be applied to individual evolved stars.
To deduce the mass and age of Herculis stars, we used a grid of stellar evolutionary tracks. The assumptions, simplifications and uncertainties in the physical parameters of the model translates into significant uncertainties in calculating model masses, radii and ages. Basu et al. (2012) provide an in-depth analysis of these grid-based approaches. They estimate that the accuracy of mass evaluation without inclusion of additional seismic information is at least 8%. We conclude from Figure 8 that the model ages and masses calculated by MESA, E12, L12 and M12 are in satisfactory agreement. This is not a surprise as far as the four codes we are comparing employ very similar nuclear reaction rates555 All employed codes in this study use NACRE (Angulo et al. 1999) thermonuclear reaction rates with updates to 14N(p,)16O, triple-, 14N()18F and 12C()16O reactions.. This result supports the stringency of model-dependent age determination approaches, such as asteroseismology of red giants in clusters (Basu et al. 2011; Miglio et al. 2012).
Figure 10 summarizes our results on the mass distribution in the Herculis system within 1 and 2 uncertainties. It is a collection of the results from Eqs. 14 to 16 which employ the position of Herculis stars on the HRD (from Figures 5 to 7) and the age constraint (Table 5). From the condition that the masses of Herculis stars must not overlap (Eq. 13), we have no additional information that would limit the mass ranges for components of Herculis system.
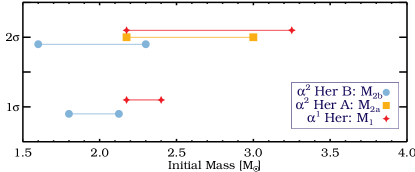
Figure 9 shows very different patterns for 12C/13C and 16O/17O atmospheric abundance ratios. It is difficult to judge whether the observed differences between the 12C/13C and 16O/17O trends in different codes is more of a physical nature or of computational origin; this is beyond the scope of this study. Yet, it calls for an observational calibration of surface abundances versus the global stellar parameters, such as mass and , which in return requires a high precision mass assessment. The asteroseismology of oscillating red giants comes to the rescue, as it can indirectly provide measures of from seismic scaling laws as precise as (see e.g. Basu et al. 2011). Also see Morel et al. (2012) and Thygesen et al. (2012). Once this is relaxed, surface abundance ratios might serve as an alternative technique in estimating the masses of stars when seismic and/or binarity information is missing.
10. Summary
We carried out more than two decades of multicolor photometry of the nearby triple-stellar system, Herculis, and devise a method to extract effective temperature and the bolometric luminosity of the primary star. For this, we use Wing ABC filters. For Her, we find and . These agree with the near-infrared interferometric observations of Perrin et al. (2004) within the error bars.
We calculated a grid of 55 evolutionary tracks with MESA which incorporate the effects of stellar rotation. The grid has the solar composition, and is calculated for the mass range 1.30 to 8.0 . Within 2 uncertainty, the Herculis system has an age of 0.41 to 1.25 Gyr. The inferred model age from MESA agrees with E12 and L12 tracks. We consequently find that the initial masses of the stars in Herculis system are distributed between 1.60 to 3.40 , with the primary M5 Ib-II AGB star having the mass . This result was independently reproduced by Moravveji et al. (2011), by extending the seismic scaling relations for RGBs to AGB stars. This now settles the debates on the mass of Her indicating a smaller value than formerly thought, and rejects its evolutionary status being a more massive red supergiant (like Ori and Sco; see Section 2).
Soon, Gaia will provide precise parallaxes for nearly half a million Galactic stars. Multicolor photometry of M-type giants and supergiants in Wing ABC filters, when combined with such precise parallaxes, can provide the stellar effective temperatures and luminosities at a precision comparable to or even better than the infrared interferometry.
References
- Abia et al. (2012) Abia, C., Palmerini, S., Busso, M., & Cristallo, S. 2012, A&A, 548, A55
- Allen (1976) Allen, C. W. 1976, Astrophysical Quantities, ed. Allen, C. W.
- Angulo et al. (1999) Angulo, C., et al. 1999, Nuclear Physics A, 656, 3
- Asplund et al. (2009) Asplund, M., Grevesse, N., Sauval, A. J., & Scott, P. 2009, ARA&A, 47, 481
- Basu et al. (2012) Basu, S., Verner, G. A., Chaplin, W. J., & Elsworth, Y. 2012, ApJ, 746, 76
- Basu et al. (2011) Basu, S., et al. 2011, ApJ, 729, L10
- Bedding (2003) Bedding, T. R. 2003, Ap&SS, 284, 61
- Benson et al. (1991) Benson, J. A., Dyck, H. M., Mason, W. L., Howell, R. R., Ridgway, S. T., & Dixon, D. J. 1991, AJ, 102, 2091
- Blöcker (1995) Blöcker, T. 1995, A&A, 297, 727
- Böhm-Vitense (1958) Böhm-Vitense, E. 1958, ZAp, 46, 108
- Busso et al. (2007) Busso, M., Wasserburg, G. J., Nollett, K. M., & Calandra, A. 2007, ApJ, 671, 802
- Cantiello & Langer (2010) Cantiello, M., & Langer, N. 2010, A&A, 521, A9
- Charbonnel & Lagarde (2010) Charbonnel, C., & Lagarde, N. 2010, A&A, 522, A10
- Charbonnel & Zahn (2007) Charbonnel, C., & Zahn, J.-P. 2007, A&A, 467, L15
- Denissenkov (2010) Denissenkov, P. A. 2010, ApJ, 723, 563
- Denissenkov & Merryfield (2011) Denissenkov, P. A., & Merryfield, W. J. 2011, ApJ, 727, L8
- Denissenkov & Pinsonneault (2008) Denissenkov, P. A., & Pinsonneault, M. 2008, ApJ, 684, 626
- Deutsch (1956) Deutsch, A. J. 1956, ApJ, 123, 210
- Dyck et al. (1996) Dyck, H. M., Benson, J. A., van Belle, G. T., & Ridgway, S. T. 1996, AJ, 111, 1705
- Ekström et al. (2012) Ekström, S., et al. 2012, A&A, 537, A146
- El Eid (1994) El Eid, M. F. 1994, A&A, 285, 915
- Harris & Lambert (1984) Harris, M. J., & Lambert, D. L. 1984, ApJ, 285, 674
- Heger et al. (2000) Heger, A., Langer, N., & Woosley, S. E. 2000, ApJ, 528, 368
- Heger et al. (2005) Heger, A., Woosley, S. E., & Spruit, H. C. 2005, ApJ, 626, 350
- Henry & Eaton (1995) Henry, G. W., & Eaton, J. A., eds. 1995, Astronomical Society of the Pacific Conference Series, Vol. 79, Robotic telescopes : current capabilities, present developments, and future prospects for automated astronomy : proceedings of a symposium held as part of the 106th annual meeting of the Astronomical Society of the Pacific, Flagstaff, Arizona, 28-30 June 1994
- Hoffleit & Jaschek (1982) Hoffleit, D., & Jaschek, C. 1982, The Bright Star Catalogue. Fourth revised edition. (Containing data compiled through 1979)., ed. Hoffleit, D. & Jaschek, C.
- Hoflich et al. (1986) Hoflich, P., Lowe, R. P., Moorhead, J., Scholz, M., Wehlau, W., & Wehrse, R. 1986, MNRAS, 220, 377
- Huber et al. (2011) Huber, D., et al. 2011, ApJ, 743, 143
- Jeffers & Vasilevskis (1978) Jeffers, H. M., & Vasilevskis, S. 1978, AJ, 83, 411
- Karakas et al. (2010) Karakas, A. I., Campbell, S. W., & Stancliffe, R. J. 2010, ApJ, 713, 374
- Keenan & McNeil (1989) Keenan, P. C., & McNeil, R. C. 1989, ApJS, 71, 245
- Kippenhahn et al. (1980) Kippenhahn, R., Ruschenplatt, G., & Thomas, H.-C. 1980, A&A, 91, 175
- Kiss et al. (2006) Kiss, L. L., Szabó, G. M., & Bedding, T. R. 2006, MNRAS, 372, 1721
- Lacour et al. (2009) Lacour, S., et al. 2009, ApJ, 707, 632
- Lagarde et al. (2012) Lagarde, N., Decressin, T., Charbonnel, C., Eggenberger, P., Ekström, S., & Palacios, A. 2012, ArXiv e-prints
- Langer (2012) Langer, N. 2012, ARA&A, 50, 107
- Lattanzio & Wood (2004) Lattanzio, J., & Wood, P. 2004, Asymptotic Giant Branch Stars, ed. Habing J. H. & Olofsson H.
- Lejeune et al. (1998) Lejeune, T., Cuisinier, F., & Buser, R. 1998, A&AS, 130, 65
- Levesque et al. (2005) Levesque, E. M., Massey, P., Olsen, K. A. G., Plez, B., Josselin, E., Maeder, A., & Meynet, G. 2005, ApJ, 628, 973
- Lockwood & Wing (1971) Lockwood, G. W., & Wing, R. F. 1971, ApJ, 169, 63
- Maeder (2009) Maeder, A. 2009, Physics, Formation and Evolution of Rotating Stars, ed. Maeder, A.
- Maeder & Meynet (2001) Maeder, A., & Meynet, G. 2001, A&A, 373, 555
- Maeder & Meynet (2012) —. 2012, Reviews of Modern Physics, 84, 25
- Markwardt (2009) Markwardt, C. B. 2009, in Astronomical Society of the Pacific Conference Series, Vol. 411, Astronomical Data Analysis Software and Systems XVIII, ed. D. A. Bohlender, D. Durand, & P. Dowler, 251
- McAlister et al. (1989) McAlister, H. A., Hartkopf, W. I., Sowell, J. R., Dombrowski, E. G., & Franz, O. G. 1989, AJ, 97, 510
- Miglio et al. (2012) Miglio, A., et al. 2012, ArXiv e-prints
- Moravveji et al. (2011) Moravveji, E., Guinan, E. F., & Sobouti, Y. 2011, in Astronomical Society of the Pacific Conference Series, Vol. 445, Astronomical Society of the Pacific Conference Series, ed. F. Kerschbaum, T. Lebzelter, & R. F. Wing, 163
- Moravveji et al. (2010) Moravveji, E., Guinan, E. F., Wasatonic, R., Sobouti, Y., & Nasiri, S. 2010, Ap&SS, 21
- Morel & Thévenin (2002) Morel, P., & Thévenin, F. 2002, A&A, 390, 611
- Morel et al. (2012) Morel, T., et al. 2012, ArXiv e-prints
- Morgan & Keenan (1973) Morgan, W. W., & Keenan, P. C. 1973, ARA&A, 11, 29
- Mowlavi et al. (2012) Mowlavi, N., Eggenberger, P., Meynet, G., Ekström, S., Georgy, C., Maeder, A., Charbonnel, C., & Eyer, L. 2012, A&A, 541, A41
- Nicholls et al. (2009) Nicholls, C. P., Wood, P. R., Cioni, M.-R. L., & Soszyński, I. 2009, MNRAS, 399, 2063
- Paxton et al. (2011) Paxton, B., Bildsten, L., Dotter, A., Herwig, F., Lesaffre, P., & Timmes, F. 2011, ApJS, 192, 3
- Paxton et al. (2013) Paxton, B., et al. 2013, ArXiv e-prints
- Percy et al. (2001) Percy, J. R., Wilson, J. B., & Henry, G. W. 2001, PASP, 113, 983
- Perrin et al. (2004) Perrin, G., Ridgway, S. T., Coudé du Foresto, V., Mennesson, B., Traub, W. A., & Lacasse, M. G. 2004, A&A, 418, 675
- Perryman et al. (1997) Perryman, M. A. C., et al. 1997, A&A, 323, L49
- Poelarends et al. (2008) Poelarends, A. J. T., Herwig, F., Langer, N., & Heger, A. 2008, ApJ, 675, 614
- Rayner et al. (2009) Rayner, J. T., Cushing, M. C., & Vacca, W. D. 2009, ApJS, 185, 289
- Reimers (1977) Reimers, D. 1977, A&A, 61, 217
- Richichi & Percheron (2002) Richichi, A., & Percheron, I. 2002, A&A, 386, 492
- Smartt (2009) Smartt, S. J. 2009, ARA&A, 47, 63
- Stancliffe (2010) Stancliffe, R. J. 2010, MNRAS, 403, 505
- Stothers (2010) Stothers, R. B. 2010, ApJ, 725, 1170
- Talon & Charbonnel (2005) Talon, S., & Charbonnel, C. 2005, A&A, 440, 981
- Tassoul (2000) Tassoul, J. 2000, Stellar rotation, Cambridge astrophysics series (Cambridge University Press)
- Tatebe et al. (2007) Tatebe, K., Hale, D. D. S., Wishnow, E. H., & Townes, C. H. 2007, ApJ, 658, L103
- Thiering & Reimers (1993) Thiering, I., & Reimers, D. 1993, A&A, 274, 838
- Thompson & Johnson (1974) Thompson, R. I., & Johnson, H. L. 1974, ApJ, 193, 147
- Thoul et al. (1994) Thoul, A. A., Bahcall, J. N., & Loeb, A. 1994, ApJ, 421, 828
- Thygesen et al. (2012) Thygesen, A. O., et al. 2012, A&A, 543, A160
- Traxler et al. (2011) Traxler, A., Garaud, P., & Stellmach, S. 2011, ApJ, 728, L29
- Unno et al. (1989) Unno, W., Osaki, Y., Ando, H., Saio, H., & Shibahashi, H. 1989, Nonradial oscillations of stars, ed. Unno, W., Osaki, Y., Ando, H., Saio, H., & Shibahashi, H.
- van Leeuwen (2007) van Leeuwen, F. 2007, A&A, 474, 653
- van Loon (2006) van Loon, J. T. 2006, in Astronomical Society of the Pacific Conference Series, Vol. 353, Stellar Evolution at Low Metallicity: Mass Loss, Explosions, Cosmology, ed. H. J. G. L. M. Lamers, N. Langer, T. Nugis, & K. Annuk, 211
- Weiner et al. (2003) Weiner, J., Hale, D. D. S., & Townes, C. H. 2003, ApJ, 589, 976
- White & Wing (1978) White, N. M., & Wing, R. F. 1978, ApJ, 222, 209
- Wing (1978) Wing, R. F. 1978, Astronomy Dept., Ohio State University
- Wing (1992) —. 1992, Journal of the American Association of Variable Star Observers (JAAVSO), 21, 42
- Wood et al. (2004) Wood, P. R., Olivier, E. A., & Kawaler, S. D. 2004, ApJ, 604, 800
- Woolf (1963) Woolf, N. J. 1963, The Observatory, 83, 260
Appendix A Wing C-Filter Bolometric Correction BCC
The C-filter of Wing’s 3-color system is centred in a continuum region free from strong absorption lines (see Fig 1 and Table 2). The central wavelength is at 1040 nm with a FWHM of 42 nm White & Wing (1978). The transmitted flux through the filter measures near-IR apparent magnitudes that approximate bolometric magnitudes, as seen in Mira-variable light curves near their energy maxima (Wing 1992). Bolometric corrections BCC between 1040 nm magnitudes and the UBV-based apparent bolometric magnitudes are computed for eight M4.8 to M5.1 calibration stars via Eq. A1.
| (A1) |
where is the 1040 nm magnitude and is taken from Wing (1978) for each star. The UBV-based apparent bolometric magnitude, , is calculated from Eq. A2
| (A2) |
The V-band magnitudes are taken from the Bright Star Catalog (Hoffleit & Jaschek 1982) or the Simbad Astronomical Database. Using the bolometric corrections in Table 5 of Levesque et al. (2005), a second-order polynomial is generated to calculate unique bolometric corrections that are dependent on the spectral sub-types of the eight calibration stars. This second-order polynomial is given in Eq. A3
| (A3) |
where represents the numerical part of the spectral sub-type plus one. For example, to compute the BCV of a M4.9 star, = 5.9 in Eq. A3. Table A lists the calibration stars with their spectral types, V, BCV, , and BCC magnitudes, respectively. An average is then taken of all eight bolometric corrections to C to yield the final correction value itself. The bolometric correction to C for each star is given in the last column in Table A, and the final bolometric correction to C is BC. This value is added to the color-corrected C-filter 1040 nm bolometric magnitudes, and these final resulting magnitudes are then used to compute the luminosities in Figure 2 and Table 4.
| HR | Spectral | BCV | Wing 1040-nm | BCC | ||||
|---|---|---|---|---|---|---|---|---|
| Number | Type | [mag] | [mag] | [mag] | [mag] | |||
| (a) | (b) | (a) | (Eq. A3) | (b) | (Eq. A1) | |||
| 85 | M4.8 | 5.12 | (2.345) | 0.97 | 1.805 | |||
| 1722 | M4.8 | 5.65 | (2.345) | 1.71 | 1.595 | |||
| 4949 | M4.8 | 5.66 | (2.345) | 1.53 | 1.785 | |||
| 7804 | M4.8 | 5.55 | (2.345) | 1.60 | 1.605 | |||
| 4045 | M4.9 | 6.30 | (2.382) | 2.15 | 1.768 | |||
| 5192 | M5.0 | 4.19 | (2.419) | (-0.03) | 1.801 | |||
| 587 | M5.1 | 5.51 | (2.457) | 1.31 | 1.743 | |||
| 4909 | M5.1 | 5.84 | (2.457) | 1.60 | 1.783 | |||
| Ave. Spec. | M4.9 | Average | 1.735 | |||||
| Std. Dev. | 0.085 | |||||||
| Std. Err. | 0.030 |
Appendix B Light Curves in Johnson VRI and Wing ABC Filters