DIGIT survey of far-infrared lines from protoplanetary disks I. [O i], [C ii], OH, H2O and CH+. ††thanks: Herschel is an ESA space observatory with science instruments provided by European-led Principal Investigator consortia and with important participation from NASA.
We present far-infrared (50-200 m) spectroscopic observations of young pre-main-sequence (PMS) stars taken with Herschel/PACS as part of the DIGIT key project. The sample includes 16 Herbig AeBe and 4 T Tauri sources observed in SED mode covering the entire spectral range. An additional 6 Herbig AeBe and 4 T Tauri systems have been observed in SED mode with a limited spectral coverage. Multiple atomic fine structure and molecular lines are detected at the source position: [O i], [C ii], CO, OH, H2O, CH+. The most common feature is the [O i] 63 m line detected in almost all of the sources followed by OH. In contrast with CO, OH is detected toward both Herbig AeBe groups (flared and non-flared sources). An isothermal LTE slab model fit to the OH lines indicates column densities of cm-2, emitting radii AU and excitation temperatures K. We used the non-LTE code RADEX to verify the LTE assumption. High gas densities (cm-3) are needed to reproduce the observations. The OH emission thus comes from a warm layer in the disk at intermediate stellar distances. Warm H2O emission is detected through multiple lines toward the T Tauri systems AS 205, DG Tau, S CrA and RNO 90 and three Herbig AeBe systems HD 104237, HD 142527, HD 163296 (through line stacking). Overall, Herbig AeBe sources have higher OH/H2O abundance ratios across the disk than do T Tauri disks, from near- to far-infrared wavelengths. Far-infrared CH+ emission is detected toward HD 100546 and HD 97048. The slab model suggests moderate excitation ( 100 K) and compact (AU) emission in the case of HD 100546. Off-source [O i] emission is detected toward DG Tau, whose origin is likely the outflow associated with this source. The [C ii] emission is spatially extended in all sources where the line is detected. This suggests that not all [C ii] emission is associated with the disk and that there is a substantial contribution from diffuse material around the young stars. The flux ratios of the atomic fine structure lines ([O i] 63 m, [O i] 145 m, [C ii]) are analyzed with PDR models and require high gas density ( cm-3) and high UV fluxes (), consistent with a disk origin for the oxygen lines for most of the sources.
Key Words.:
Protoplanetary disks – Stars: formation1 Introduction
Far-infrared (far-IR) spectroscopic observations of young pre-main-sequence stars have the potential to reveal the gas and dust composition of protoplanetary disks in regions not probed at any other wavelengths (e.g., van Dishoeck, 2004; Lorenzetti, 2005; Henning et al., 2010). The atomic and molecular transitions in the far-IR regime (50-200 m) span a large range in upper energy level (from a few 10 K to a few 103 K) and are sensitive to the warm (a few 102 K) upper layers of the disk ( cm-3). For a disk irradiated by UV and/or X-rays from the pre-main-sequence star, these conditions are found at intermediate distances from the central star ( 10 AU) (e.g., Kamp & Dullemond, 2004; Bruderer et al., 2012). Observations of lines of multiple species provide a wealth of information that allow us to (1) determine the physical properties of the gas such as excitation temperature, column density, emitting radii (and in some cases the total gas density); (2) constrain the excitation mechanism (e.g., collisions, UV fluorescence, IR pumping); and (3) address the chemical structure of the disk. The far-IR (IR) spectrum contains information complementary to that provided by near- and mid-IR observations which are sensitive to the hot ( 1000 K) inner region of the disk (few AU). At the other end of the spectrum, (sub)millimeter spectroscopic observations with ALMA will unveil the physical conditions and chemical composition of the disk midplane at distances 10 AU. The far-IR data probe intermediate disk radii and depths. The ultimate goal of these observational campaigns is to use the combined data to address the chemistry and physics of the entire protoplanetary disk from inner to outer edge.
We present here 50–200 m spectra of a sample of protoplanetary disks around Herbig AeBe and T Tauri stars obtained in the context of the ‘Dust, Ice and Gas in Time’ (DIGIT) key program (Sturm et al., 2010). The unprecedented sensitivity of the PACS instrument (Poglitsch et al., 2010) on board the Herschel Space Observatory (Pilbratt et al., 2010) allows for the first time the detection of weak atomic and molecular emission down to a few 10-18 W m-2. Far-IR spectra of bright Herbig stars have been obtained previously with the Long Wavelength Spectrometer (LWS) on the Infrared Space Observatory (ISO) (e.g., Waelkens et al., 1996; Meeus et al., 2001; Giannini et al., 1999; Lorenzetti et al., 1999, 2002; Creech-Eakman et al., 2002). One of the main results has been an empirical classification of the Herbig AeBe systems into two groups based on the ratio of the far- to near-IR (dust) emission (Meeus et al., 2001). Group I sources have a high far- to near-IR emission ratio consistent with a flaring disk geometry while Group II sources have a low flux ratio characteristic of a flat, self-shadowed disk. Grain growth and settling may also play a role (e.g. Acke et al., 2009). One question to be addressed here is to what extent the far-IR gas-phase lines reflect this dichotomy in disk structure.
The near-IR spectra of Herbig AeBe disks are characterised by several ro-vibrational lines of CO (e.g. Brittain et al., 2003; Blake & Boogert, 2004; van der Plas et al., 2009; Salyk et al., 2011a) and OH (Mandell et al., 2008; Fedele et al., 2011; Doppmann et al., 2011; Liskowsky et al., 2012). At mid-IR wavelengths the spectra of Herbig AeBe disks are dominated by dust emission and only very few Herbig sources show molecular emission (Pontoppidan et al., 2010; Salyk et al., 2011b). The optical forbidden oxygen lines are common in Herbig AeBe spectra (e.g. Acke & van den Ancker, 2004) and are found to come from the disk atmosphere close to the star (AU, e.g., Fedele et al., 2008; van der Plas et al., 2008). In contrast, the emission from T Tauri systems is characterised by a rich molecular spectrum from near- to mid-IR wavelengths. The inventory of molecular species detected in T Tauri sources in the infrared includes: CO (e.g. Najita et al., 2003), OH and H2O (e.g., Carr et al., 2004; Salyk et al., 2008), HCN and C2H2 (e.g., Carr & Najita, 2008; Pascucci et al., 2009; Carr & Najita, 2011; Mandell et al., 2012) and, finally CO2 (Pontoppidan et al., 2010). Are Herbig sources also different from T Tauri sources at far-IR wavelengths?
In this paper we report on the detection of far-IR atomic fine structure lines ([O i] and [C ii]) and molecular lines (OH, H2O, CH+). The analysis of far-IR CO lines is reported in Meeus et al. (2013, hereafter paper II). This survey over the full PACS wavelength range complements GASPS (Meeus et al., 2012) which targeted specific lines.
| Star | RA | DEC | Sp. Type | Distance$$$$footnotemark: | Group | Obsid | Obs. date |
| (J2000) | (J2000) | [pc] | (1342+) | ||||
| AB Aur | 04 55 45.8 | +30 33 04.3 | A0 | 140 15 a𝑎aa𝑎avan Leeuwen (2007) | I | 217842/3 | 2011/04/04 |
| HD 35187 | 05 24 01.2 | +24 57 37.6 | A2+A7 | 114 24 a𝑎aa𝑎avan Leeuwen (2007) | II | 217846††\dagger††\daggerSpectral coverage = 50-73 m, 100-145 m; | 2011/04/04 |
| HD 36112 | 05 30 27.5 | +25 19 57.0 | A5 | 280 55 a𝑎aa𝑎avan Leeuwen (2007) | I | 228247/8 | 2011/09/07 |
| HD 38120 | 05 43 11.9 | -04 59 49.9 | B9 | 480 175 a𝑎aa𝑎avan Leeuwen (2007) | I | 226212/3 | 2011/08/15 |
| HD 50138 | 06 51 33.4 | -06 57 59.5 | B9 | 390 70 a𝑎aa𝑎avan Leeuwen (2007) | II | 206991/2 | 2010/10/23 |
| HD 97048 | 11 08 03.3 | -77 39 17.4 | A0 | 160 15 a𝑎aa𝑎avan Leeuwen (2007) | I | 199412/3 | 2010/06/30 |
| HD 98922 | 11 22 31.7 | -53 22 11.5 | B9 | 1150 a𝑎aa𝑎avan Leeuwen (2007) | II | 210385‡‡\ddagger‡‡\ddaggerSpectral coverage = 60-75 m, 120-143 m | 2010/11/27 |
| HD 100453 | 11 33 05.6 | -54 19 28.5 | A9 | 122 10 a𝑎aa𝑎avan Leeuwen (2007) | I | 211695/6 | 2010/12/25 |
| HD 100546 | 11 33 25.4 | -70 11 41.2 | B9 | 97 4 a𝑎aa𝑎avan Leeuwen (2007) | I | 188038/7 | 2009/12/11 |
| HD 104237 | 12 00 05.1 | -78 11 34.6 | A4 | 116 5 a𝑎aa𝑎avan Leeuwen (2007) | II | 207819/20 | 2010/11/03 |
| HD 135344 B | 15 15 48.4 | -37 09 16.0 | F4 | 140 27 b𝑏bb𝑏bMüller et al. (2011) | I | 213921/2 | 2011/02/07 |
| HD 139614 | 15 40 46.4 | -42 29 53.5 | A7 | 140 5 c𝑐cc𝑐cAcke & van den Ancker (2004) | I | 215683/4 | 2011/03/10 |
| HD 141569 A | 15 49 57.8 | -03 55 16.3 | A0 | 116 7 a𝑎aa𝑎avan Leeuwen (2007) | II | 213913‡‡\ddagger‡‡\ddaggerSpectral coverage = 60-75 m, 120-143 m | 2011/02/06 |
| HD 142527 | 15 56 41.9 | -42 19 23.2 | F6 | 230 50 a𝑎aa𝑎avan Leeuwen (2007) | I | 216174/5 | 2011/03/16 |
| HD 142666 | 15 56 40.0 | -22 01 40.0 | A8 | 145 5 c𝑐cc𝑐cAcke & van den Ancker (2004) | II | 213916‡‡\ddagger‡‡\ddaggerSpectral coverage = 60-75 m, 120-143 m | 2011/02/06 |
| HD 144432 | 16 06 57.9 | -27 43 09.7 | A9 | 160 25 a𝑎aa𝑎avan Leeuwen (2007) | II | 213919‡‡\ddagger‡‡\ddaggerSpectral coverage = 60-75 m, 120-143 m | 2011/02/07 |
| HD 144668 | 16 08 34.3 | -39 06 18.3 | A1/A2 | 160 15 a𝑎aa𝑎avan Leeuwen (2007) | II | 215641/2 | 2011/03/08 |
| Oph IRS 48 | 16 27 37.2 | -24 30 35.0 | A0 | 120 4 d𝑑dd𝑑dLoinard et al. (2008) | I | 227069/70 | 2011/08/22 |
| HD 150193 | 16 40 17.9 | -23 53 45.2 | A2 | 203 40 a𝑎aa𝑎avan Leeuwen (2007) | II | 227068‡‡\ddagger‡‡\ddaggerSpectral coverage = 60-75 m, 120-143 m | 2011/08/22 |
| HD 163296 | 17 56 21.3 | -21 57 21.9 | A1 | 120 10 a𝑎aa𝑎avan Leeuwen (2007) | II | 217819/20 | 2011/04/03 |
| HD 169142 | 18 24 29.8 | -29 46 49.3 | A8 | 145 5 c𝑐cc𝑐cAcke & van den Ancker (2004) | I | 206987/8 | 2010/10/23 |
| HD 179218 | 19 11 11.3 | +15 47 15.6 | A0 | 255 40 a𝑎aa𝑎avan Leeuwen (2007) | I | 208884/5 | 2010/11/12 |
| DG Tau | 04 27 04.7 | +26 06 16.3 | K5 | 140 e𝑒ee𝑒efootnotemark: | 225730/1 | 2011/11/15 | |
| HT Lup | 15 45 12.9 | -34 17 30.6 | K2 | 120 35 a𝑎aa𝑎avan Leeuwen (2007) | 213920‡‡\ddagger‡‡\ddaggerSpectral coverage = 60-75 m, 120-143 m | 2011/11/17 | |
| RU Lup | 15 56 42.3 | -37 49 15.5 | G5 | 120 35 a𝑎aa𝑎avan Leeuwen (2007) | 215682‡‡\ddagger‡‡\ddaggerSpectral coverage = 60-75 m, 120-143 m | 2011/03/10 | |
| RY Lup | 15 59 28.4 | -40 21 51.2 | K4 | 120 35 a𝑎aa𝑎avan Leeuwen (2007) | 216171‡‡\ddagger‡‡\ddaggerSpectral coverage = 60-75 m, 120-143 m | 2011/03/16 | |
| AS 205 | 16 11 31.4 | -18 38 24.5 | K5 | 125 f𝑓ff𝑓fPontoppidan et al. (2011) | 215737/8 | 2011/11/18 | |
| EM* SR 21 | 16 27 10.3 | -24 19 12.5 | G3 | 120 4 f𝑓ff𝑓fPontoppidan et al. (2011) | 227209/10 | 2011/08/14 | |
| RNO 90 | 16 34 09.2 | -15 48 16.8 | G5 | 125 4 f𝑓ff𝑓fPontoppidan et al. (2011) | 228206‡‡\ddagger‡‡\ddaggerSpectral coverage = 60-75 m, 120-143 m | 2011/09/06 | |
| S Cra | 19 01 08.6 | -36 57 19.9 | K3+M0 | 129 11 g𝑔gg𝑔gNeuhäuser & Forbrich (2008) | 207809/10 | 2010/11/02 |
2 Observations and data reduction
2.1 Sample
The sources were selected primarily on their far-IR fluxes such that a could be reached on the continuum within 5 hours of integration time. The Herbig AeBe sources in this sample have spectral type between F4 to B9 and are not embedded in large molecular clouds. They have been studied previously at mid-IR wavelengths by Spitzer (Juhász et al., 2010) and the selected sample contains mostly nearby and low-luminosity sources. The T Tauri stars consist of an inhomogeneous sample of bright sources with K–G spectral type. AS 205, S CrA, and RU Lup are heavily veiled sources, with CO line profiles suggesting the presence of a disc wind (Bast et al., 2011; Pontoppidan et al., 2011). DG Tau is associated with an outflow that can contribute to the observed emission. In addition RU Lup has evidence for a jet (Güdel et al., 2010). Table 1 provides the parameters of the sample. For the Herbig AeBe sources, the disc group is also indicated: group I sources have flared discs while group II sources have flat discs, in the classification of Meeus et al. 2001).
The focus in this paper is on the Herbig sample, but the data on T Tauri sources are reported for completeness and to allow a comparison with the Herbig sample in a consistent way. More details about the sample are given in paper II.
2.2 Observational details
PACS is an array of 55 spaxels222A spaxel is a spatial sampling element of the PACS integral field unit, with each spaxel covering 9494. The instrument is diffraction limited only at m. The targets were observed in SED mode with two settings in order to cover the spectral range 51-220 m (B2A, 51-73 m, short R1, 100-145 m and B2B, 70-105 m long R1, 140-220 m). The spectral resolving power is 1000, increasing to 3000 at the shortest wavelengths. A second sample of targets was observed with a limited spectral range (B2A, 60-75 m; short R1, 120-143 m) centered at the position of the forsterite emission but including some specific lines. The observations were carried out in chopping/nodding mode with a chopping throw of 6′. The observation log and parameters of the sample are presented in Table 1.
The data have been reduced with HIPE 8.0.2489 with standard calibration files from level 0 to level 2 (see Green et al., 2013). The two nod positions were reduced separately (oversampling factor = 3) and averaged after a flat-field correction. In the case of HD 100546, which was observed in a different mode during the science demonstration phase, we used an oversampling factor equal to 1. The spectra are extracted from the central spaxel to optimize the signal-to-noise () ratio. To flux calibrate the spectra we performed the following steps: 1) correct for flux loss by means of a PSF-loss correction function provided by HIPE; 2) scale to PACS photometry (whenever available); 3) matching spectral modules. Step 1 is valid for objects well centered in the central spaxel. In the case of mispointed observations we extracted the total flux (all 25 spaxels) to recover the flux loss. In this case we fitted a 3rd-order polynomial to two spectra (central spaxel and 25 spaxels). The correction factor is the ratio between the two fits. The mispointed sources are: AB Aur, HD 97048, HD 169142, HD 142666. The regions affected by spectral leakage (B2B m and R1 m) are excluded from this procedure. Based on a statistical analysis, the PACS SED fluxes agree with PACS photometry to within 5–10%. For this reason we assign an uncertainty of 10% to the PACS SED fluxes of sources without PACS photometry available.
The line fluxes are measured by fitting a Gaussian function and the uncertainty () is given by the product , where is the standard deviation of the (local) spectrum (W m-2 m-1), is the wavelength spacing of the bins (m) and is the width of the line in spectral bins (5 for all lines).
| Star | COa𝑎aa𝑎aT | OH | H2O | CH+ | |||
| 63 m | 145 m | ||||||
| AB Aur | Y | Y | Y | Y | Y | n | n |
| HD 35187 | Y | nb𝑏bb𝑏bD | nb𝑏bb𝑏bD | n | n | n | n |
| HD 36112 | Y | n | n | Y | Y | n | n |
| HD 38120 | Y | Y | Y | n | ? | n | n |
| HD 50138 | Y | Y | Y | n | Y | n | n |
| HD 97048 | Y | Y | Y | Y | Y | n | Y |
| HD 98922 | Y | - | - | n | n | n | n |
| HD 100453 | Y | n | n | n | n | n | n |
| HD 100546 | Y | Y | Y | Y | Y | n | Y |
| HD 104237 | Y | n | n | n | Y | Y | n |
| HD 135344 B | Y | n | n | n | n | n | n |
| HD 139614 | Y | n | n | n | n | n | n |
| HD 141569 A | Y | Yb𝑏bb𝑏bD | Yb𝑏bb𝑏bD | n | n | n | n |
| HD 142527 | Y | n | n | n | ? | Y | n |
| HD 142666 | nc𝑐cc𝑐cL | nb𝑏bb𝑏bD | nb𝑏bb𝑏bD | N | ? | n | n |
| HD 144432 | n | - | - | n | n | n | n |
| HD 144668 | Y | n | n | n | n | n | n |
| Oph IRS 48 | Y | Y | Y | Y | n | n | n |
| HD 150193 | Y | nb𝑏bb𝑏bD | nb𝑏bb𝑏bD | n | n | n | n |
| HD 163296 | Y | n | n | n | Y | Y | n |
| HD 169142 | Y | n | n | n | n | n | n |
| HD 179218 | Y | Y | Y | n | n | n | n |
| DG Tau | Y | Y | Y | Y | Y | Y | n |
| HT Lup | Y | - | - | n | n | n | n |
| RU Lup | Y | - | - | n | Y | n | n |
| RY Lup | Y | - | - | n | n | n | n |
| AS 205 | Y | Y | n | Y | Y | Y | n |
| EM* SR 21 | n | n | Y | n | n | n | n |
| RNO 90 | Y | - | - | n | Y | Y | n |
| S Cra | Y | Y | n | Y | Y | Y | n |
| [O i] 63 m | [O i] 145 m | [C ii]a𝑎aa𝑎aA | |
| AB Aur | 94.6 5.2 | 3.7 0.7 | 2.0 |
| HD 35187 | 4.8 2.0 | – | – |
| HD 36112 | 5.6 0.7 | 1.1 | 1.2 |
| HD 38120 | 7.6 0.8 | 0.7 0.1 | 3.3 |
| HD 50138 | 240 10 | 6.6 0.2 | 7.8 |
| HD 97048 | 136 5 | 5.3 0.5 | 6.3 |
| HD 98922 | 23.1 1.2 | – | – |
| HD 100453 | 10.2 0.7 | 1.2 | 1.3 |
| HD 100546 | 596 6 | 21.1 1.1 | 17.6 |
| HD 104237 | 7.4 0.7 | 1.5 | 1.5 |
| HD 135344 B | 3.6 0.5 | 1.2 | 1.4 |
| HD 139614 | 3.1 0.4 | 1.2 | 1.3 |
| HD 141569 A | 25.3 1.5 | – | – |
| HD 142666 | 50 | – | – |
| HD 142527 | 3.6 0.8 | 2.9 | 2.8 |
| HD 144432 | 5.6 | – | – |
| HD 144668 | 13.3 1.0 | 0.9 | 1.1 |
| Oph IRS 48 | 30.8 1.5 | 2.9 0.6 | 1.2 |
| HD 150193 | 3.2 0.7 | – | – |
| HD 163296 | 18.2 0.9 | 1.3 | 1.3 |
| HD 169142 | 8.9 2.0 | 2.2 | 2.5 |
| HD 179218 | 17.9 0.9 | 0.95 0.1 | 0.4b𝑏bb𝑏b[C ii] |
| DG Tau | 153 2.0 | 8.3 0.4 | 7.4 |
| HT Lup | 4.0 0.8 | – | – |
| RU Lup | 18.9 1.2 | – | – |
| RY Lup | 5.0 2.0 | – | – |
| AS 205 | 21.5 1.4 | 1.6 0.4 | 1.5 |
| EM* SR 21 | 5.4 | 1.3 | 0.13 |
| RNO 90 | 12.5 1.0 | – | – |
| S Cra | 43.6 1.3 | 1.8 0.5 | 1.7 |
3 Results
3.1 Overview
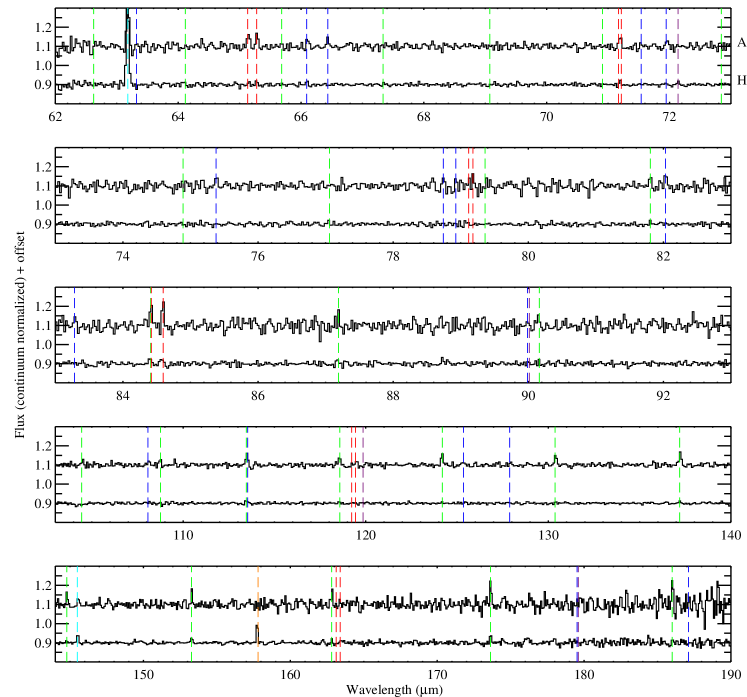
An overview of the detected atomic and molecular species is shown in Table 2. Fig. 9 shows the continuum normalized PACS spectrum of a T Tauri star (AS 205) and of an Herbig AeBe star (HD 97048). Fig. 10 and 11 show a portion of the PACS spectrum (continuum normalized) of selected sources. The strongest and most common feature is the [O i] 63 m line, seen in all but 4 sources. The [O i] 145 m and [C ii] 157 m lines are also detected, usually in the same sources, although the detection rate is much lower for these two lines. Four molecular species are seen: CO, OH, H2O and CH+. Line fluxes are reported in Tables 3-5 and 7. The CO lines are presented in paper II. After [O i] 63 m, OH emission is the most common feature, detected in 40% of the sources with full spectral coverage.
We searched for other species such as [N ii], HD and OH+. The HD =1-0 line at 112 m has been detected towards TW Hya with a flux of 6.3 ( 0.7) W m-2 after deep integration (Bergin et al., 2013). None of the sources analyzed here shows evidence of [N ii], HD or OH+ emission with 3 upper limits of the order of 10-17 W m-2 for most of the sources. Typical upper limits in different parts of individual PACS spectra can be derived from upper limits on nearby OH lines in Table 7.
3.2 [O i]
The [O i] 63 m line is the most common and strongest feature detected throughout the whole sample. The only sources in which the line is not detected are HD 142666, HD 144432 and SR 21. The line flux ranges from W m-2. The [O i] 145 m line is detected in 7 (out of 16) HAeBe stars and in 3 (out of 4) T Tauri stars. In both cases, the spatial distribution of the line emission in the PACS array follows the shape of the PSF and the emission is not spatially extended. Fig. 10 and 11 show the [O i] spectra for a selected sample.
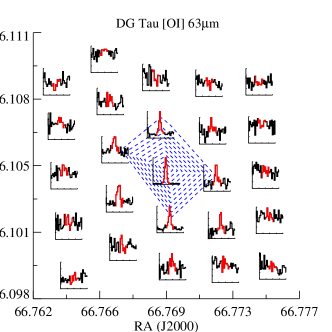
Excess emission is detected outside the central spaxel toward DG Tau (see appendix) in agreement with Podio et al. (2012). In this case, the fluxes of the [O i] 63 m lines are lower from those reported by Podio et al. (2012) who computed the line fluxes by adding all the spaxels (thus including off-source emission). The [O i] 63 m line flux of DG Tau in Table 3 refers to the on-source position only (spectrum extracted from the central spaxel and corrected for PSF-loss, see appendix).
3.3 OH
The most common molecular species detected in the PACS spectra is the hydroxyl radical, OH. Six OH doublets with upper energy levels up to 875 K are found including a cross-ladder transition at 79 m. No spatially extended OH emission is detected outside the central spaxel of the PACS array. The emission is seen in both Herbig AeBe groups (flared and flat) as well as in T Tauri stars (Fig. 9-11).
3.4 H2O
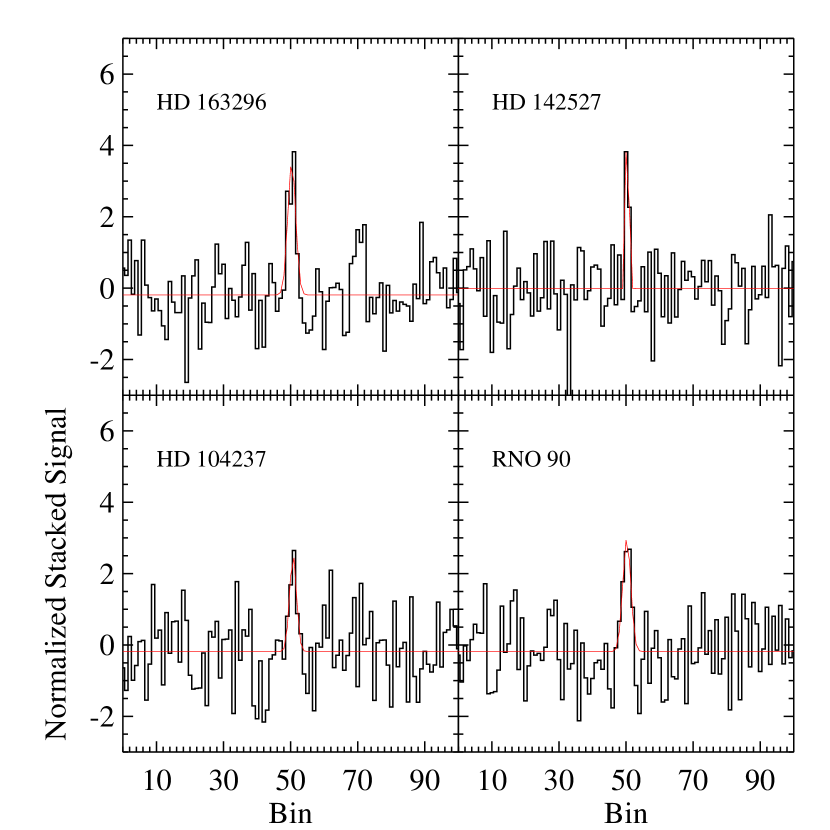
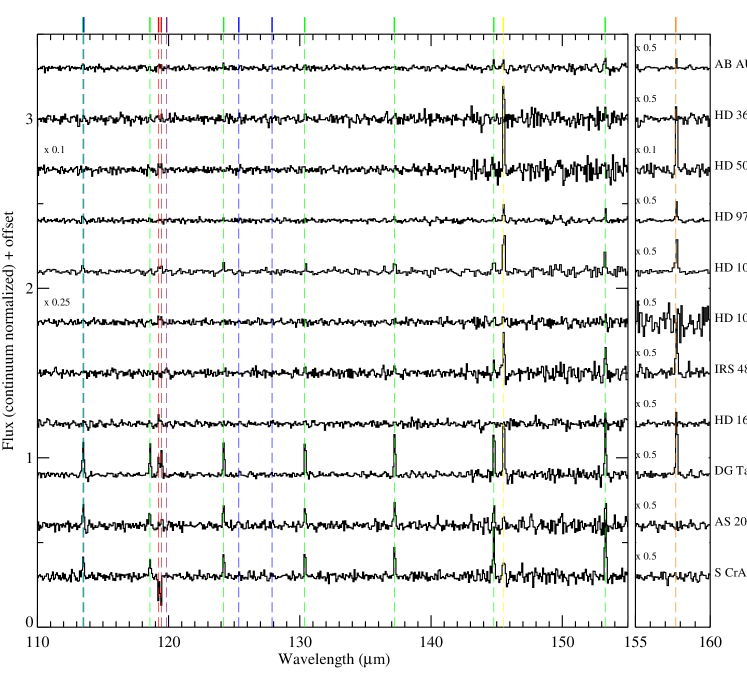
H2O lines are detected toward the T Tauri sources AS 205, DG Tau, and S CrA, including transitions from high-excitation levels (K). Different transitions are detected in different targets and, interestingly, the strongest lines come from high energy levels in contrast to embedded sources where the strongest lines are from low energy levels (e.g., Herczeg et al., 2012). These differences are likely due to different excitation mechanisms (e.g. collisions, infrared pumping, shocks) and different physical conditions (temperature and column density). The non detection of low-energy lines is further discussed in § 4.3.3. The target with the richest H2O spectrum is AS 205 with 10 lines detected. Individual line fluxes are reported in Table 5 together with 3 upper limits to some of the low-energy backbone lines for AS 205. Far-IR H2O emission in DG Tau has also been detected by Podio et al. (2012) using PACS. The line fluxes agree within 10-30% due to different flux calibration. Weak H2O emission is also detected toward RNO 90 through line stacking as shown in Fig. 1 (see below for details of the method).
Herbig AeBe sources show weak or no H2O far-IR emission. Weak lines have been reported toward HD 163296 (Fedele et al., 2012; Meeus et al., 2012) and have been confirmed through a stacking analysis. Two other Herbig AeBe stars show hints of H2O emission: HD 142527 and HD 104237. The lines are weak, with line fluxes ranging between a few W m-2 to a few W m-2, often below the 3 limit. To confirm the presence of H2O emission in these sources, we performed a line stacking analysis as described in detail in Fedele et al. (2012). In brief, the stacking consists in averaging the spectral segments containing H2O lines, based on a template of observed H2O lines by Herczeg et al. (2012). Spectral bins containing other emission lines ([O i], OH, CO and CH+) are masked, and blended H2O lines are excluded from the analysis. The stacked H2O spectra of HD 163296, HD 142527, HD 104237 and of the T Tauri source RNO 90 are shown in Fig. 1. The false alarm probability, i.e. the probability to detect a signal of equal intensity by stacking random portions of the PACS spectrum, is measured by counting the occurrences of detection in a simulation of 50,000 random stackings (after masking the the spectral bins containing H2O, OH, CO, CH+, [O i] and [C ii] lines). More details are given in Fedele et al. (2012). The false alarm probability is 0.02 % for HD 142527, 0.2 % for HD 104237 and 0.6 % for RNO 90 based on 50,000 randomized tests compared to a false alarm probability of 0.03 % for HD 163296. None of the other sources show evidence for the presence of warm H2O.
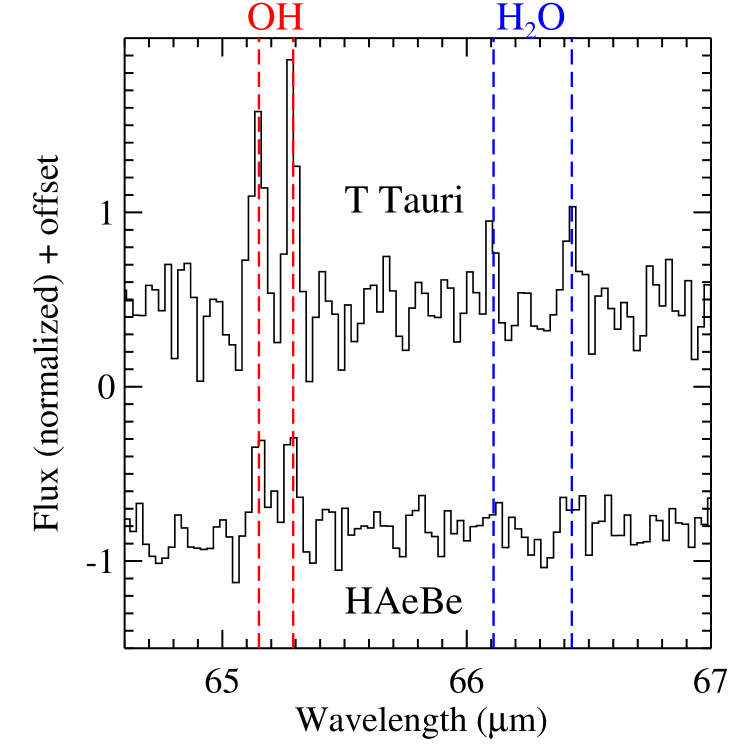
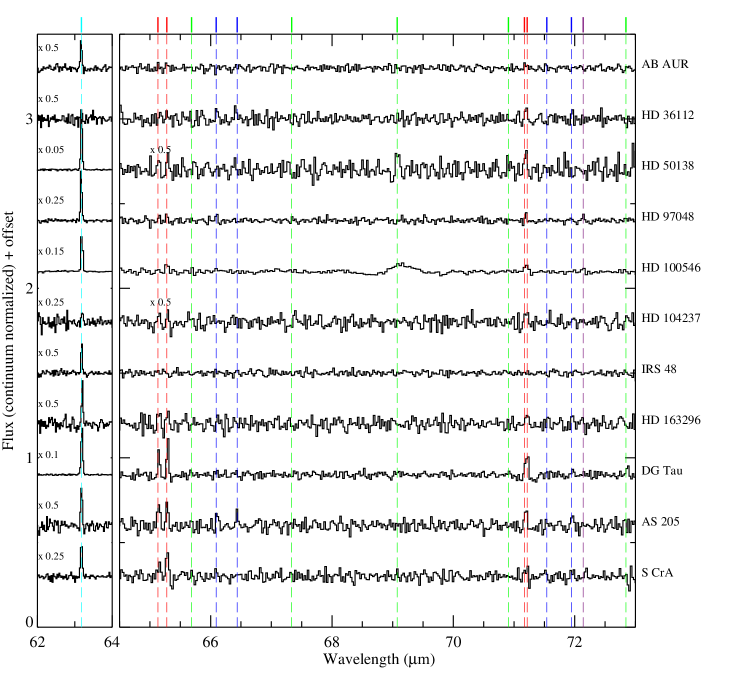
Fig. 2 shows the average PACS spectrum of the T Tauri and Herbig AeBe sources around 65 m. The spectrum of each individual source is continuum subtracted and is divided by the local standard deviation. The source spectra in each category are then summed. The spectrum of HD 100546 was excluded from the Herbig AeBe list because of its lower spectral sampling. These average spectra demonstrate that OH emission is detected in both classes of objects, but H2O only in T Tauri sources. From this result we conclude that H2O far-IR emission is not detected in Herbig AeBe sources as a class and that the three sources with tentative detection through line stacking may be peculiar in this regard.
3.5 CH+
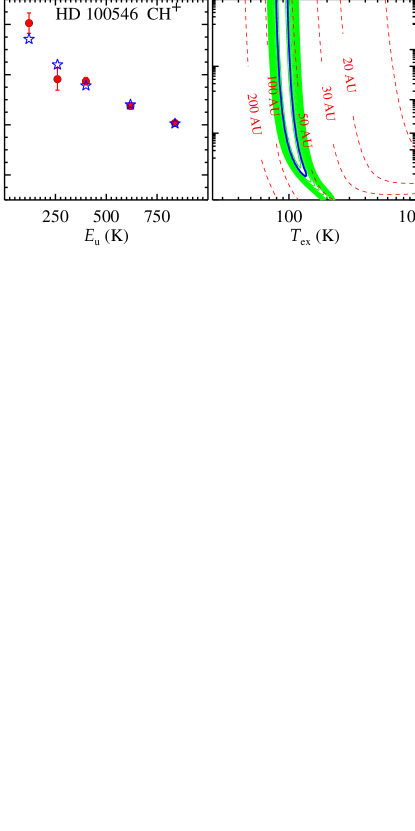
CH+ emission is detected toward two Herbig Ae systems: HD 100546 and HD 97048 (Table 4). For HD 100546 six rotational lines are detected (see also Thi et al., 2011) while in the case of HD 97048 only the and transitions are seen. The line fluxes for HD 100546 differ from those reported by Thi et al. (2011) by 10-50% due to updated flux calibration (see § 2.2).
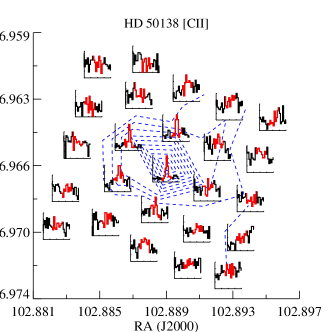
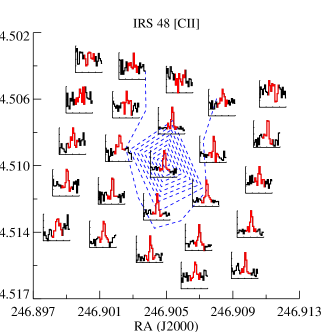
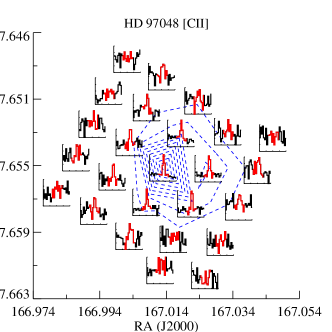
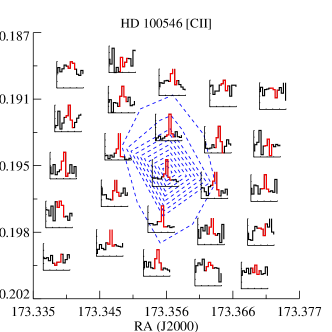
3.6 [C ii]
[C ii] emission is detected towards 7 (out of 16) Herbig AeBe sources and 2 (out of 4) T Tauri stars (Table 3). In contrast with [O i], the [C ii] emission is often spatially extended (e.g. Bruderer et al., 2012). This proves that some of the emission is produced in the large scale environment (cloud or remnant envelope) around the star even though very extended emission on scales has been chopped out. More details are given in Appendix D where the [C ii] spectral maps are also presented. The [C ii] flux reported in Table 3 refers to the on-source spectrum only, that is the flux measured in the central spaxel after subtraction of the spatially extended emission (see Appendix D). These values must be considered an upper limit to the [C ii] emission arising from the disk as extended emission from a compact remnant envelope may still be present in the central 94 94 area of the sky. The closest target is at 100 pc and the size of the central spaxel corresponds to a physical scale of 1000 AU which is of the same order as a compact envelope. Moreover, given the large PSF at this wavelength, some of the spatially extended emission will fall into the central spaxel.
Two of the sources presented here (AB Aur and HD 100546) have been previously observed at far-IR wavelengths with ISO-LWS (Giannini et al., 1999; Lorenzetti et al., 2002). The [O i] 63 m fluxes agree within 10 – 15%, which is within the calibration uncertainty. For the [O i] 145 m line, the ISO flux is 1.5 times larger than the PACS value reported here. The [C ii] fluxes are discrepant: in both cases, the flux measured with ISO is much larger (more than an order of magnitude) than the values reported here. This is due to the diffuse [C ii] emission in the large (80″) ISO beam which was not removed in the ISO observations.
4 Analysis
4.1 Correlation of line luminosities
The lines and continuum fluxes can show a correlation if the emitting conditions are physically linked. In particular, the emission of oxygen fine structure lines is expected to be correlated. We excluded the [C ii] line from this analysis as the on-source flux (i.e. the flux emerging from the disk) is only an upper limit (see § 3.6).
Fig. 3 presents a series of plots of observed line luminosities versus each other and versus far-IR continuum. The plotted quantities are the logarithm of line luminosity (log ) and continuum luminosity at 63 m (log ). To search for possible correlations/trends, different statistical tests have been performed using the ASURV (Rev. 1.2 Isobe & Feigelson, 1990; Lavalley et al., 1992) statistical package which implements the methods presented in Isobe et al. (1986). In particular three different correlation tests have been used: Cox-Hazard regression, generalised Kendall, generalised Spearman. Linear regression coefficients are calculated with the EM algorithm. These statistical tests include upper limits.
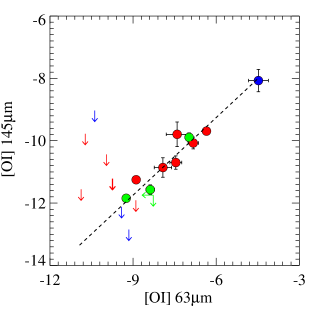
As expected, a correlation is found between the [O i] 145 m and [O i] 63 m luminosities
| (1) |
The standard deviation is 0.28. The three correlation tests give a probability that a correlation is not present of .
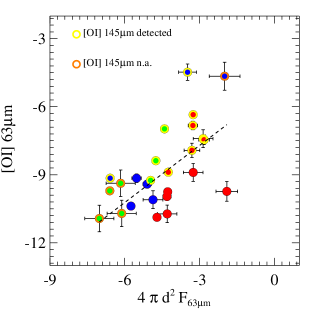
We also searched for correlations between line and continuum flux. The only finding is that sources with stronger infrared continuum luminosity tend to have stronger [O i] 63 m line luminosity (bottom panel)
| (2) |
with a standard deviation of 1.45. The three correlation tests give a probability of , suggesting that a correlation is indeed present. Nevertheless, the scatter is large: a high infrared continuum flux is a necessary but not sufficient condition to have stronger [O i] 63 m emission. No other clear correlations with source parameters are found. The origin of these correlations and the implications for the line emitting region are discussed in § 5.2.
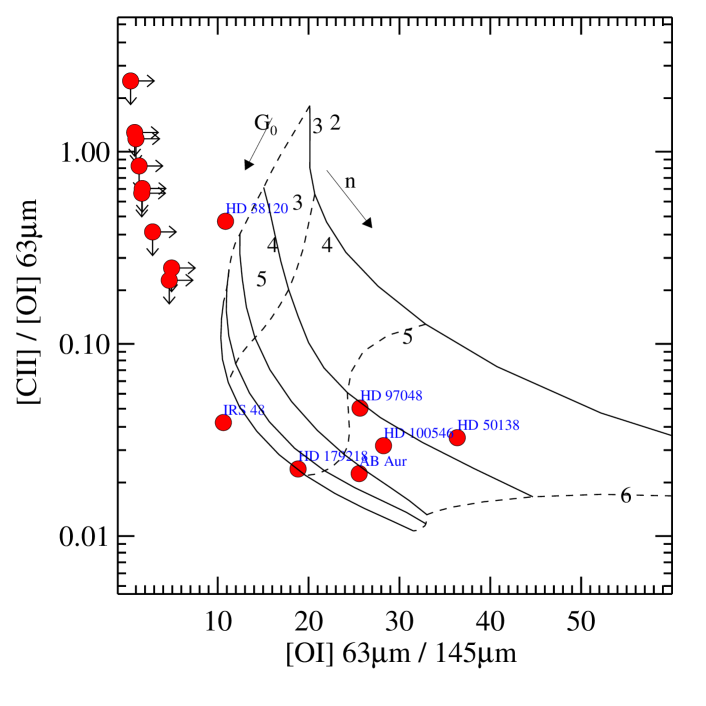
4.2 [C ii]-[O i] diagnostic plot
The atomic fine structure lines can be used as diagnostics of the physical conditions of the emitting gas. In this section we analyze the three line ratios: [O i] 145 m / [O i] 63 m, [O i] 145 m / [C ii], [O i] 63 m / [C ii]. The observed [O i] 63 m/[O i] 145 m ratio goes from 10–40 and it is higher than the typical ratio measured in molecular clouds (, e.g., Liseau et al., 1999). The gas density and the incident FUV flux can be estimated by comparing the observations with PDR models.
In the high density regime ( cm-3) different PDR models do not agree and may predict very different gas temperatures (e.g. Röllig et al., 2007). Since the oxygen fine structure lines are very sensitive to the temperature, different models produce very different line ratios. The aim of our analysis is to look for a trend consistent with the observations. For this reason, the comparison of the data to a single PDR model is justified. The model used here is from Kaufman et al. (1999). With this choice we can directly compare our results with those of Lorenzetti et al. (2002) based on ISO data.
Fig. 4 shows the observed line ratios and the model predictions. DG Tau was not included in this analysis as both the [O i] 63 m and [C ii] lines are spatially extended and the on-source flux emission is an upper limit in both cases. According to this model, there is a group of sources (AB Aur, HD 50138, HD 97048, HD 100546, HD 179218) with gas density cm-3 and between and , where is the FUV (6 – 13.6 eV) incident flux measured in units of the local galactic interstellar field (1 = 1.6 10-3 erg cm-2 s-1, Habing, 1968). These values correspond to surface temperatures 500 K - a few 103 K at radii where most of the emission originates. The density is lower for IRS 48 ( cm-3) and HD 38120 (a few 102 cm-3). As noted before, not all the [C ii] emission measured with PACS comes from the same region as the oxygen lines, thus the intrinsic (disk) oxygen-carbon line ratio can be higher than what is found here. A lower [C ii]/[O i] ratio shifts the results to even higher gas density and temperature. For this reason the gas densities found in Fig. 4 should be considered as a lower limit to the gas density of the oxygen emitting region. The values of and found here are larger than those found with ISO for Herbig AeBe stars (Lorenzetti et al., 2002). The differences are driven by the higher [C ii] flux measured with ISO (see § 3.6). In general, the physical conditions derived here are consistent with disk surface layers.
4.3 OH, H2O and CH+ excitation
In this section the rotational diagrams of OH, H2O and CH+ are analyzed. The measured Herschel-PACS line fluxes of all sources are fit in a homogeneous way with a uniform slab of gas in local thermal equilibrium (LTE) including the effects of line opacity and line overlap (Bruderer et al., 2010). This is a simple model to provide estimates of the physical conditions in the regions where the lines arise. The gas column density derived here corresponds to the column density of a “warm” molecular layer.
4.3.1 Slab model
The molecular emission is assumed to emerge from a disk with homogeneous temperature and column density and a radius . The solid angle is taken to be , where is the distance of the source. The flux of an optically thin line can be written as
| (3) |
with the line frequency , the Einstein-A coefficient , the molecular column density , the statistical weight of the upper level , the energy of the upper level and the partition function . The molecular data are from the LAMDA database (Schöier et al., 2005). The number of emitting molecules is
| (4) |
Rearranging eq. 3 yields
| (5) |
Thus the vertical axis of a rotational diagram is given by
| (6) |
The free parameters of the model are the excitation temperature and the column density . The emitting area can be determined uniquely for every given combination of and . If all lines are optically thin, the column density and emitting area () are degenerate. In this case we can measure the total number of molecules () and constrain the upper limit of and the lower limit of . For optically thick lines, the spectrum is calculated on a very fine wavelength grid using
| (7) |
with obtained from the sum of the
| (8) |
over all fine structure components (). Here, is the normalized line profile function, which is assumed to be a Gaussian with width corresponding to the thermal line width. No further (e.g. turbulent) line broadening is included. More details are given in Bruderer et al. (2010). For the analysis of the H2O lines an ortho-to-para ratio of 3 is assumed. The best fit parameters are found by minimizing the reduced () between model and observations.
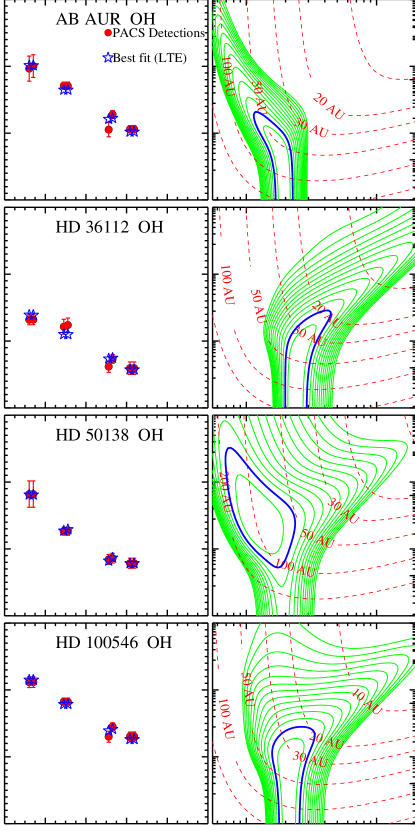
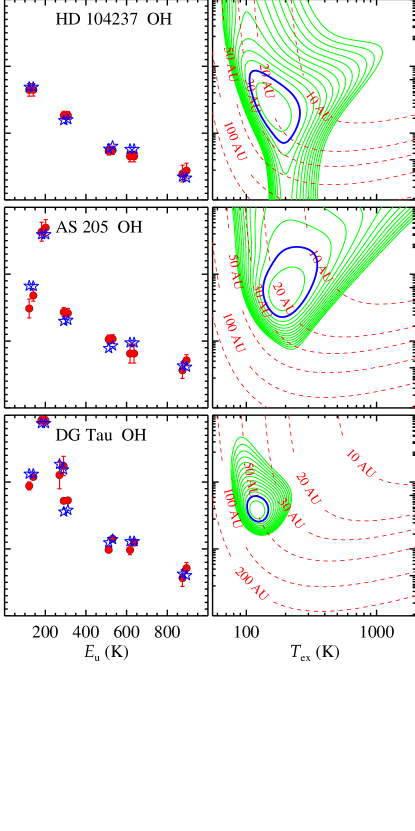
4.3.2 OH
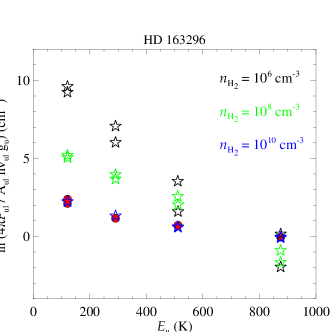
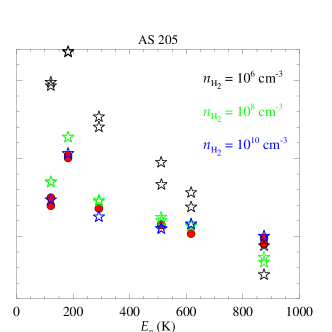
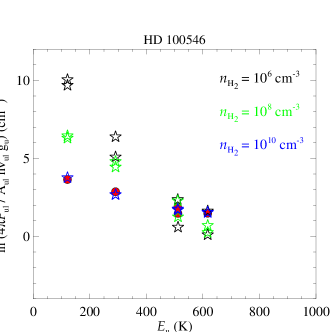
OH rotational diagrams have been fitted only for sources for which 4 (or more) OH doublets have been detected. The OH rotational diagrams are presented in Fig. 5-5 where the PACS measurements are shown as red dots and the best-fit model as blue stars. The figure also shows the contours of the fit to the data; that of HD 163296 is reported in Fedele et al. (2012). The blue contour represents the 1 confidence level of the fit which corresponds to = minimum() + 1. The best fit results are reported in Table 6. The OH emission is characterized by a warm temperature with K. In some cases all the OH lines are optically thin ( cm-2) and they fall on a straight line in the corresponding rotational diagram. For these sources, the OH column density and emitting radius are degenerate so only a lower boundary to the emitting radius is given, varying between 20 and 50 AU. The lowest excitation temperature is found for HD 50138 and DG Tau ( 100-130 K).
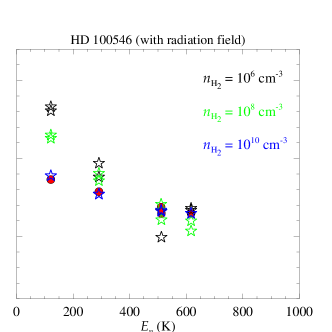
Given the large critical density of the far-IR OH lines and the strong infrared continuum, non-LTE excitation (including infrared pumping) can be important. We verified the effects of non-LTE excitation using RADEX (van der Tak et al., 2007). The detailed analysis is presented in Appendix C. The RADEX simulation shows that high gas densities (cm-3) are needed to reproduce the observed rotational diagram, even when a realistic infrared radiation field produced by the dust continuum is included in the RADEX simulation. The high density justifies the LTE assumption.
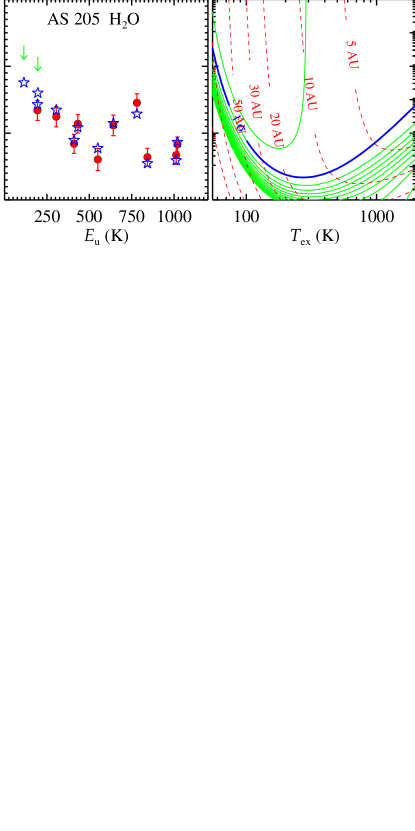
4.3.3 H2O
Fig. 6 (right) shows the contours for AS 205, best fit results are given in Table 6. The molecular data are listed in Table 8. The best fit models (first contour) give K, a column density cm-2 and an emitting radius AU. The rotational diagram is shown in Fig. 6 (left) together with the model predictions. The model reproduces well the measured line fluxes () as well as the upper limits of the low-energy backbone lines, and . According to the slab model, the detected lines are optically thick with optical depth , so the inferred number of molecules is a lower limit. In the case of LTE, the line flux ratio of the low and high energy lines decreases quickly with increasing temperature. To test the validity of the LTE assumption, we checked the line flux ratio of a low-energy transition (179 m non detected) versus a high-energy one (72 m). The observed ratio is ( upper limit). According to the LTE model, this ratio drops below 0.5 for K and cm-2. Low gas temperatures (K) are ruled out by the detection of high-energy transitions. Large column densities ( cm-2) are needed to reproduce the observed scatter (deviation from optically thin) in the rotational diagram.
Non-LTE excitation may also be important because of the large critical densities of the H2O lines detected here ( a few cm-3 for K), and the scatter of the H2O lines in the rotational diagram can also be produced by sub-thermal excitation. If this is the case, the kinetic temperature of the H2O containing gas is likely larger than the excitation temperature (e.g., Herczeg et al., 2012). However, given the results of the OH modeling, the far-IR H2O emission likely comes from a high gas density region (cm-3) where the H2O rotational levels are in LTE.
In the case of DG Tau, S CrA and RNO 90 only a few H2O lines are detected and the fit is not constrained.
The analysis of HD 163296 is reported in Fedele et al. (2012), who find that the far-IR H2O emission is optically thin, cm-2 with an emitting radius AU, and the excitation temperature is K (Table 6). For the other Herbig AeBe sources, HD 142527 and HD 104237, the individual H2O lines are too weak (below 3 ) for such an analysis. With the assumption of optically thin emission, the upper limit to the number of warm water molecules is given by Eq. 4. The line at 72 m is used. The partition sum is taken from the HITRAN TIPS program (Laraia et al., 2011) The typical upper limit to the total number of warm water molecules ranges from a few for K. This number decreases by 20% for a gas temperature K. Assuming a characteristic emitting radius of 30 AU the upper limit to the water column density, , is a few 10cm-2 (10cm-2 for HD 50138).
4.3.4 CH+
The CH+ rotational diagram for HD 100546 is shown in Fig. 7. The model that best fits the data gives K, cm-2 and AU. The column density is not well constrained because of the large uncertainty in the two lower lines.
Compared to Thi et al. (2011), the slab model analysis presented here indicates a lower excitation temperature, K versus K (Thi et al., 2011). The CH+ emitting region is also different: Thi et al. (2011) find that most of the emission comes from a narrow rim at the cavity edge between 10-13 AU from the star through full thermo-chemical modeling, whereas the slab model suggests a much larger emitting area. Part of the discrepancy is due to a different flux calibration of the PACS spectra; the PACS spectrum presented here matches the PACS photometric points which have an accuracy of 5% in absolute flux.
| Transition | Wavelength | HD 100546 | HD 97048 |
|---|---|---|---|
| (m) | |||
| 60.25 | 18.5 2.0 | 2.9 1.5 | |
| 72.14 | 14.8 2.0 | 2.2 0.5 | |
| 90.02 | 13.1 2.0 | 3.0 | |
| 119.86 | 3.6 1.5 | 2.5 | |
| 179.60 | 4.2 1.5 | 2.7 |
| Transition | Wavelength | AS 205 |
|---|---|---|
| (m) | ||
| 58.71 | 2.5 1.1 | |
| 59.99 | 2.4 0.7 | |
| 66.09 | 3.0 1.1 | |
| 66.44 | 2.9 1.1 | |
| 71.96 | 3.1 1.1 | |
| 75.39 | 2.0 0.8 | |
| 78.74 | 2.7 1.0 | |
| 78.93 | 2.8 1.0 | |
| 83.29 | 1.7 0.7 | |
| 108.07 | 1.0 0.4 | |
| 174.62 | 1.6 | |
| 179.53 | 1.6 | |
| DG Tau | ||
| 78.75 | 1.2 0.6 | |
| 82.03 | 1.3 0.7 | |
| 108.13 | 1.3 0.4 | |
| 179.54 | 1.1 0.4 | |
| S CrA | ||
| 63.31 | 2.3 0.6 | |
| 66.09 | 1.6 0.6 | |
| 71.96 | 2.4 0.7 | |
| 78.74 | 2.3 0.7 | |
| 187.11 | 1.2 0.4 |
| log() | ||||
| [K] | [cm-2] | [AU] | ||
| OH | ||||
| AS 205 | 190 | 8 1015 | 19 | 45.31 |
| DG Tau | 115 | 4 1015 | 50 | 45.85 |
| AB Aur | 190 | 1014 | 50 | 44.25 |
| HD 36112 | 240 | 1014 | 50 | 44.25 |
| HD 50138 | 130 | 2 1015 | 95 | 46.10 |
| HD 100546 | 210 | 2 1014 | 40 | 44.35 |
| HD 104237 | 160 | 2 1015 | 20 | 44.75 |
| HD 163296 | 425 | 8 1014 | 15 | 44.10 |
| H2O | ||||
| AS 205 | 100 – 300 | 1017 | 10 – 30 | 45.85 |
| HD 163296 | 250 – 300 | 20 | 43.5 - 44.5 | |
| CH+ | ||||
| HD 100546 | 80 – 120 | 50 – 70 | 46.94 | |
5 Discussion
5.1 Origin of far-IR emission lines
According to the results of the OH rotational diagram, the far-IR OH lines are emitted by warm gas with of 100 - 400 K. The OH emission toward AB Aur, HD 36112, HD 100546 is optically thin (cm-2). For the remaining sources (AS 205, DG Tau, HD 50138, HD 163296) the far-IR OH lines are at the border between optically thick and optically thin emission (). The derived excitation temperature and the emitting radius are consistent with a disk origin with the emission coming from the upper layers of the disk at distances of 15–50 AU from the star (100 AU in the case of HD 50138). Given the high excitation temperature and high critical densities (of order cm-3 to excite OH), the emitting radius cannot be much larger.
In the case of the T Tauri system DG Tau, the derived excitation temperature is 115 K (lowest in the sample) and the OH emitting radius is 50 AU, which is 2.5 times larger than the emitting radius of the other T Tauri star (AS 205). In this case, a further contribution to the OH lines may come from a shock associated with the molecular outflow/jet associated with the system. Indeed, compact warm OH emission has been observed to be associated with outflows in embedded young stellar objects (van Kempen et al., 2010; Wampfler et al., 2010; Podio et al., 2012; Wampfler et al., 2013; Karska et al., 2013). Further analysis including the mid-infrared lines (from Spitzer) is needed to disentangle the disk/outflow origin of OH for these systems. In the case of AS 205 the emitting redius of the far-IR H2O lines is is AU, also consistent with a disk origin.
As discussed in § 4.2, the high density and UV fluxes implied by the ratios of the atomic fine structure lines are consistent with a disk origin for most of the sources. The [C ii] emission is spatially extended in all sources where the line is detected. This suggests that there is a contribution from a diffuse cloud (or remnant envelope) around the young star. The on-source [C ii] flux correlates with the oxygen line fluxes suggesting that (some of) the on-source [C ii] emission is associated with the disk. From the PACS spectra it is however impossible to disentangle the disk emission from the diffuse emission. HIFI spectra of the [C ii] line profiles are needed to solve this issue (Fedele et al., in prep.).
5.2 Disk geometry and dust settling
The protoplanetary disks presented here vary in geometry and degree of grain growth and settling. These factors are important for the excitation of the atomic and molecular gas. For example, in the case of water, a combination of these factors can play a role in the low detection rate towards Herbig AeBe systems. As pointed out by Woitke et al. (2009), whether or not the puffed-up inner rim shadows the hot water layer is important, since shadowing reduces the UV radiation field by about two orders of magnitude and increases water by the same amount. Also, grain settling, presence or absence of PAHs and the gas-to-dust ratio can all have a large effect in boosting line fluxes (e.g., Meijerink et al., 2009; Najita et al., 2011; Tilling et al., 2012; Bruderer et al., 2012).
Far-IR CO emission is only detected in HAeBe systems of Group I (Table 2 and paper II). The high CO lines detected with PACS are sensitive to the UV flux impinging onto the disk, which controls the disk gas temperature. Using the thermo-chemical models of Bruderer et al. (2012), we have shown that flared disks indeed have higher gas temperatures out to several tens of AU and stronger high CO fluxes (paper II). This is an independent proof that the disks of Group I indeed have a flared geometry. On the other hand, the OH lines are less sensitive to the gas temperature, consistent with its detection in both Group I and II sources (Bruderer et al., in prep. and § 5.4).
The [O i] 63 m line is detected in most of the disks independently from disk geometry and stellar parameters. The high detection rate toward Group II sources is interesting. If these sources are indeed self-shadowed and/or have grain growth and settling, the gas temperature in the surface layers should be lower (Jonkheid et al., 2007) and the atomic and molecular emission at far-IR wavelengths is expected to be reduced in Group II disks. The excitation of the O (3P1) level (upper level of the [O i] 63 m line) is mostly due to collisions with H and H2. Once the gas density exceeds the critical density of the line888 ([O i] 63 m) = 2.5 cm-3at 100 K and lower for higher temperature the excitation depends only on the temperature and no longer on the density. In this scenario, Group I sources can have stronger [O i] 63 m and [O i] 145 m emission due to the higher temperature of the gas. The intensity of the [O i] 63 m line varies by two orders of magnitude for a given value of the continuum flux at 63 m. This implies a different gas density structure (in the [O i] forming region) from object to object. According to model predictions (e.g. Woitke et al., 2009; Bruderer et al., 2012), the oxygen emitting region can be more extended than the far-IR continuum. The FIR continuum emission comes mostly from the inner 50 AU, while the oxygen lines originate in the outer disk (up to a few 102 AU in the case of Herbig AeBe stars). The large spread in [O i] 63 m fluxes for a given FIR continuum flux (Fig. 3) suggests that the [O i]-bright sources may have an enhanced scale-height (more flared) compared to the [O i]-faint sources. Based on the results of § 4.2 and on the high detection rate of [O i] 63 m we conclude that the oxygen lines have a disk origin in most of the cases, with the strength determined by the specific disk structure.
5.3 Comparison to near- and mid-IR spectroscopy
The comparison of the far-IR spectra shown here to the near- (1-5 m) and mid- (10-40 m) IR spectra can give insights on the radial distribution of different gas species in the upper layers of protoplanetary disks. At longer wavelengths also larger vertical depths into the disk are probed.
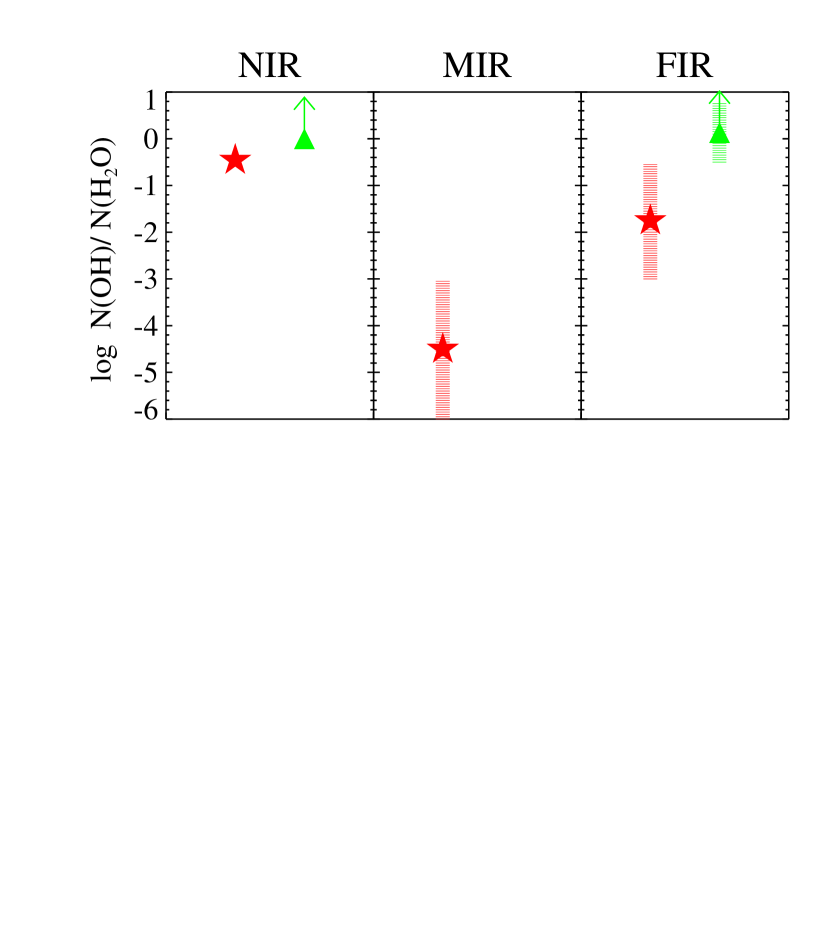
Fig. 8 shows the OH/H2O column density ratio for T Tauri and Herbig AeBe stars measured at different wavelengths. The values represent the ratio of the total number of molecules and are taken from Salyk et al. (2008), Fedele et al. (2011), Salyk et al. (2011a) and from this work. In the case of Herbig AeBe stars, the MIR ratio refers to the ratio of the upper limits and is thus not constrained. At all wavelength ranges, the Herbig AeBe disks show a higher OH/H2O abundance ratio compared to T Tauri disks. For Herbig AeBe systems the OH/H2O lower limit does not vary much from near- to far-IR wavelengths. In contrast the T Tauri disks do show a clear decrease in the OH/H2O ratio. The difference between the mid- and far-IR ratios are not significant.
Herbig AeBe: The major difference between short and long wavelengths is the lack of any H2O lines at near-IR (Mandell et al., 2008; Fedele et al., 2011) whereas weak H2O lines are detected at mid- and far-IR in some sources (Pontoppidan et al., 2010; Fedele et al., 2012; Meeus et al., 2012). Even though the detection rate of warm H2O is low and the individual lines are weak ( a few 10-17 W m-2), this finding suggests a different H2O abundance between the inner and outer disk. However, as Fig. 8 shows, the OH/H2O abundance limits are similar at all wavelengths. Also interesting is the high detection rate () of far-IR OH emission for sources with full spectral coverage. This emission is detected in both Group I and II sources in contrast to near-IR OH emission which is detected in Group I sources only (Fedele et al., 2011). Finally, near-IR CO emission (ro-vibrational) is detected in several Herbig AeBe systems independently from disk geometry in contrast to far-IR CO which is only detected in flared disks (paper II). This difference is likely a consequence of the larger number of UV photons that impinge onto the disk surface in the case of a flared geometry which can heat the gas to the larger distances responsible for the far-IR lines.
T Tauri : The PACS spectra presented here are rich in molecular emission similar to the near-IR and mid-IR spectra. AS 205 and RNO 90 have a rich OH and H2O spectrum ranging from the pure-rotational lines detected here to ro-vibrational lines detected with NIRSPEC and CRIRES (3 m) and Spitzer/IRS (10-40 m) (Salyk et al., 2011b; Pontoppidan et al., 2010; Mandell et al., 2012). The energy levels involved range from a few hundred to a few thousand K. The H2O-rich PACS spectrum is unlikely to originate from the same region of the disk as the shorter wavelength data. Indeed, based on the slab model, the emitting region of the far-IR lines of OH and H2O has a radius AU in contrast to a radius of a few AU (or less) for the hot H2O near-IR and mid-IR lines (Salyk et al., 2011b). The conclusion is that H2O is present in the surface layers of disks around low-mass pre-main sequence stars from the inner ( 0.1 AU) out to the outer ( 30 AU) disk, but the OH/H2O abundance ratio changes with radius (see Zhang et al. 2013 for the analysis of H2O data of one source).
5.4 Disk chemistry and molecular excitation
The different detection rates and excitation mechanisms of the various species provide information about the chemical processes governing the atmosphere of protoplanetary disks. In the case of the UV-bright Herbig stars, the chemistry and excitation are regulated more strongly by photoprocesses like UV fluorescence (e.g. for CO) and photodissociation of molecules (e.g. OH, H2O) than in T Tauri stars, unless those low-mass sources have significant UV excess due to accretion.
First, we find that OH far-IR emission is detected in all groups of sources in contrast to CO far-IR emission which is only detected in flared Herbig AeBe disks and T Tauri disks. The excitation of the high CO rotational lines in disks is regulated by the gas temperature which in turn is controlled by the UV radiation field. In the case of OH, the lines are excited either by collisions with atomic and molecular hydrogen or through infrared pumping, both of which are much less sensitive to geometry. A third viable mechanism for OH is the prompt emission after the OH molecules are produced rotationally excited by the photodissociation of water which is also controlled by the UV field.
Another interesting finding is the detection of (weak) far-IR H2O emission. The non-detection of hot H2O lines at near- and mid-IR wavelengths suggests that the atmospheres of disks around early type stars lack H2O molecules due the photodissociation of H2O by the strong UV radiation field of the central star (Fedele et al., 2011; Pontoppidan et al., 2010). In contrast, the PACS detection of warm H2O in some sources suggests that H2O molecules can survive at large distances ( 30 AU) from the star and somewhat deeper into the disk, likely produced by high temperature reactions of O + H2 and OH + H2 driving much of the oxygen into water (e.g., Bergin, 2011; Woitke et al., 2010). The importance of this result is that it reveals the presence of an H2O reservoir in the outer disk around early type stars, beyond the traditional snow line.
CH+ emission is found toward HD 100546 and HD 97048. Interestingly these are the only two Herbig AeBe sources where ro-vibrational H2 emission has been detected so far (Carmona et al., 2011). The velocity profile of the line suggests extended H2 emission to more that 50 AU (radius) from the star (Carmona et al., 2011). This is likely the same spatial region traced by the far-IR CH+ lines reported here: the CH+ emitting area in HD 100546 is 50-70 AU according to the slab model. The detection of vibrationally excited H2 and CH+ towards the same sources is not a coincidence but relates to the gas phase reaction (Sternberg & Dalgarno, 1995)
| (9) |
6 Conclusion
We present far-IR spectra of Herbig AeBe and T Tauri stars taken with Herschel/PACS. Besides the fine structure lines of [O i] and [C ii], emission is detected of CO (paper II), OH, H2O and CH+. The most common feature detected is the [O i] 63 m line.
far-IR OH emission is detected in several sources. An LTE slab model including optical depth effects is used to fit the OH rotational diagram. The OH lines are likely associated with the disk, probing a warm layer of gas in the outer disk (AU). In contrast to the high- CO lines, the OH lines are detected in both flat and flared disks (Group I and II) around Herbig AeBe stars. The reason for this different may be the different excitation mechanisms for the two species.
Warm H2O emission is detected in three Herbig AeBe sources and in four T Tauri sources. In the Herbig sources, the emission is weak and the detection of warm H2O is confirmed only by line stacking. This result reveals the presence of an H2O reservoir in the outer disk region around Herbig stars. However, the OH/H2O abundance limit is the same between inner and outer disk, consistent with a decreasing UV field. In the case of the T Tauri star AS 205 the slab model suggests “warm” ( 100-300 K) H2O emission coming from the inner 10-30 AU from the star. Overall, the OH/H2O column density ratio decreases from inner and outer disk for T Tauri disks.
The flux ratios of atomic fine structure lines are fitted with PDR models involving high gas density ( cm-3) and high UV radiation field () as expected for the atmosphere of protoplanetary disks. The presence of spatially extended [C ii] emission (on scale of 103 AU) implies the presence of diffuse material (e.g., remnant of the molecular cloud) around the young stars.
Acknowledgements.
Support for this work, part of the Herschel Open Time Key Project Program, was provided by NASA through an award issued by the Jet Propulsion Laboratory, California Institute of Technology. We are grateful to the DIGIT team for stimulating discussions and scientific support. Astrochemistry in Leiden is supported by the Netherlands Research School for Astronomy (NOVA), by a Spinoza grant and grant 614.001.008 from the Netherlands Organisation for Scientific Research (NWO), and by the European Community’s Seventh Framework Programme FP7/2007-2013 under grant 238258 (LASSIE) and grant 291141 (CHEMPLAN). PACS has been developed by a consortium of institutes led by MPE (Germany) and including UVIE (Austria); KU Leuven, CSL, IMEC (Belgium); CEA, LAM (France); MPIA (Germany); INAF-IFSI/OAA/OAP/OAT, LENS, SISSA (Italy); IAC (Spain). This development has been supported by the funding agencies BMVIT (Austria), ESA-PRODEX (Belgium), CEA/CNES (France), DLR (Germany), ASI/INAF (Italy), and CICYT/MCYT (Spain). The research of M.G. has been supported by the the Austrian Research Promotion Agency (FFG) through the ASAP initiative of the Austrian Federal Ministry for Transport, Innovation and Technology (BMVIT). We thank the anonymous referee for the helpful comments.References
- Acke et al. (2009) Acke, B., Min, M., van den Ancker, M. E., et al. 2009, A&A, 502, L17
- Acke & van den Ancker (2004) Acke, B. & van den Ancker, M. E. 2004, A&A, 426, 151
- Agúndez et al. (2010) Agúndez, M., Goicoechea, J. R., Cernicharo, J., Faure, A., & Roueff, E. 2010, ApJ, 713, 662
- Bast et al. (2011) Bast, J. E., Brown, J. M., Herczeg, G. J., van Dishoeck, E. F., & Pontoppidan, K. M. 2011, A&A, 527, A119
- Bergin (2011) Bergin, E. A. 2011, The Chemical Evolution of Protoplanetary Disks, ed. P. J. V. Garcia, 55–113
- Bergin et al. (2013) Bergin, E. A., Cleeves, L. I., Gorti, U., et al. 2013, Nature, 493, 644
- Blake & Boogert (2004) Blake, G. A. & Boogert, A. C. A. 2004, ApJ, 606, L73
- Brittain et al. (2003) Brittain, S. D., Rettig, T. W., Simon, T., et al. 2003, ApJ, 588, 535
- Bruderer et al. (2010) Bruderer, S., Benz, A. O., Stäuber, P., & Doty, S. D. 2010, ApJ, 720, 1432
- Bruderer et al. (2012) Bruderer, S., van Dishoeck, E. F., Doty, S. D., & Herczeg, G. J. 2012, A&A, 541, A91
- Carmona et al. (2011) Carmona, A., van der Plas, G., van den Ancker, M. E., et al. 2011, A&A, 533, A39
- Carr & Najita (2008) Carr, J. S. & Najita, J. R. 2008, Science, 319, 1504
- Carr & Najita (2011) Carr, J. S. & Najita, J. R. 2011, ApJ, 733, 102
- Carr et al. (2004) Carr, J. S., Tokunaga, A. T., & Najita, J. 2004, ApJ, 603, 213
- Creech-Eakman et al. (2002) Creech-Eakman, M. J., Chiang, E. I., Joung, R. M. K., Blake, G. A., & van Dishoeck, E. F. 2002, A&A, 385, 546
- Doppmann et al. (2011) Doppmann, G. W., Najita, J. R., Carr, J. S., & Graham, J. R. 2011, ApJ, 738, 112
- Fedele et al. (2012) Fedele, D., Bruderer, S., van Dishoeck, E. F., et al. 2012, A&A, 544, L9
- Fedele et al. (2011) Fedele, D., Pascucci, I., Brittain, S., et al. 2011, ApJ, 732, 106
- Fedele et al. (2008) Fedele, D., van den Ancker, M. E., Acke, B., et al. 2008, A&A, 491, 809
- Giannini et al. (1999) Giannini, T., Lorenzetti, D., Tommasi, E., et al. 1999, A&A, 346, 617
- Green et al. (2013) Green, J. D., Evans, II, N. J., Jørgensen, J. K., et al. 2013, ApJ, 770, 123
- Güdel et al. (2010) Güdel, M., Lahuis, F., Briggs, K. R., et al. 2010, A&A, 519, A113
- Habing (1968) Habing, H. J. 1968, Bull. Astron. Inst. Netherlands, 19, 421
- Henning et al. (2010) Henning, T., Semenov, D., Guilloteau, S., et al. 2010, ApJ, 714, 1511
- Herczeg et al. (2012) Herczeg, G. J., Karska, A., Bruderer, S., et al. 2012, A&A, 540, A84
- Isobe & Feigelson (1990) Isobe, T. & Feigelson, E. D. 1990, in Bulletin of the American Astronomical Society
- Isobe et al. (1986) Isobe, T., Feigelson, E. D., & Nelson, P. I. 1986, ApJ, 306, 490
- Jonkheid et al. (2007) Jonkheid, B., Dullemond, C. P., Hogerheijde, M. R., & van Dishoeck, E. F. 2007, A&A, 463, 203
- Juhász et al. (2010) Juhász, A., Bouwman, J., Henning, T., et al. 2010, ApJ, 721, 431
- Kamp & Dullemond (2004) Kamp, I. & Dullemond, C. P. 2004, ApJ, 615, 991
- Karska et al. (2013) Karska, A., Herczeg, G. J., van Dishoeck, E. F., et al. 2013, A&A, 552, A141
- Kaufman et al. (1999) Kaufman, M. J., Wolfire, M. G., Hollenbach, D. J., & Luhman, M. L. 1999, ApJ, 527, 795
- Kenyon et al. (2008) Kenyon, S. J., Gómez, M., & Whitney, B. A. 2008, Low Mass Star Formation in the Taurus-Auriga Clouds, ed. B. Reipurth, 405
- Laraia et al. (2011) Laraia, A. L., Gamache, R. R., Lamouroux, J., Gordon, I. E., & Rothman, L. S. 2011, Icarus, 215, 391
- Lavalley et al. (1992) Lavalley, M. P., Isobe, T., & Feigelson, E. D. 1992, in Bulletin of the American Astronomical Society
- Liseau et al. (1999) Liseau, R., White, G. J., Larsson, B., et al. 1999, A&A, 344, 342
- Liskowsky et al. (2012) Liskowsky, J. P., Brittain, S. D., Najita, J. R., et al. 2012, ApJ, 760, 153
- Loinard et al. (2008) Loinard, L., Torres, R. M., Mioduszewski, A. J., & Rodríguez, L. F. 2008, ApJ, 675, L29
- Lorenzetti (2005) Lorenzetti, D. 2005, Space Sci. Rev., 119, 181
- Lorenzetti et al. (2002) Lorenzetti, D., Giannini, T., Nisini, B., et al. 2002, A&A, 395, 637
- Lorenzetti et al. (1999) Lorenzetti, D., Tommasi, E., Giannini, T., et al. 1999, A&A, 346, 604
- Mandell et al. (2012) Mandell, A. M., Bast, J., van Dishoeck, E. F., et al. 2012, ApJ, 747, 92
- Mandell et al. (2008) Mandell, A. M., Mumma, M. J., Blake, G. A., et al. 2008, ApJ, 681, L25
- Meeus et al. (2013) Meeus, G., et al. 2013, A&A, submitted
- Meeus et al. (2012) Meeus, G., Montesinos, B., Mendigutía, I., et al. 2012, A&A, 544, A78
- Meeus et al. (2001) Meeus, G., Waters, L. B. F. M., Bouwman, J., et al. 2001, A&A, 365, 476
- Meijerink et al. (2009) Meijerink, R., Pontoppidan, K. M., Blake, G. A., Poelman, D. R., & Dullemond, C. P. 2009, ApJ, 704, 1471
- Müller et al. (2011) Müller, A., van den Ancker, M. E., Launhardt, R., et al. 2011, A&A, 530, A85
- Najita et al. (2003) Najita, J., Carr, J. S., & Mathieu, R. D. 2003, ApJ, 589, 931
- Najita et al. (2011) Najita, J. R., Ádámkovics, M., & Glassgold, A. E. 2011, ApJ, 743, 147
- Neuhäuser & Forbrich (2008) Neuhäuser, R. & Forbrich, J. 2008, The Corona Australis Star Forming Region, ed. B. Reipurth, 735
- Pascucci et al. (2009) Pascucci, I., Apai, D., Luhman, K., et al. 2009, ApJ, 696, 143
- Pilbratt et al. (2010) Pilbratt, G. L., Riedinger, J. R., Passvogel, T., et al. 2010, A&A, 518, L1
- Podio et al. (2012) Podio, L., Kamp, I., Flower, D., et al. 2012, A&A, 545, A44
- Poglitsch et al. (2010) Poglitsch, A., Waelkens, C., Geis, N., et al. 2010, A&A, 518, L2
- Pontoppidan et al. (2011) Pontoppidan, K. M., Blake, G. A., & Smette, A. 2011, ApJ, 733, 84
- Pontoppidan et al. (2010) Pontoppidan, K. M., Salyk, C., Blake, G. A., et al. 2010, ApJ, 720, 887
- Röllig et al. (2007) Röllig, M., Abel, N. P., Bell, T., et al. 2007, A&A, 467, 187
- Salyk et al. (2011a) Salyk, C., Blake, G. A., Boogert, A. C. A., & Brown, J. M. 2011a, ApJ, 743, 112
- Salyk et al. (2008) Salyk, C., Pontoppidan, K. M., Blake, G. A., et al. 2008, ApJ, 676, L49
- Salyk et al. (2011b) Salyk, C., Pontoppidan, K. M., Blake, G. A., Najita, J. R., & Carr, J. S. 2011b, ApJ, 731, 130
- Schöier et al. (2005) Schöier, F. L., van der Tak, F. F. S., van Dishoeck, E. F., & Black, J. H. 2005, A&A, 432, 369
- Sternberg & Dalgarno (1995) Sternberg, A. & Dalgarno, A. 1995, ApJS, 99, 565
- Sturm et al. (2010) Sturm, B., Bouwman, J., Henning, T., et al. 2010, A&A, 518, L129
- Thi et al. (2011) Thi, W.-F., Ménard, F., Meeus, G., et al. 2011, A&A, 530, L2
- Tilling et al. (2012) Tilling, I., Woitke, P., Meeus, G., et al. 2012, A&A, 538, A20
- van der Plas et al. (2009) van der Plas, G., van den Ancker, M. E., Acke, B., et al. 2009, A&A, 500, 1137
- van der Plas et al. (2008) van der Plas, G., van den Ancker, M. E., Fedele, D., et al. 2008, A&A, 485, 487
- van der Tak et al. (2007) van der Tak, F. F. S., Black, J. H., Schöier, F. L., Jansen, D. J., & van Dishoeck, E. F. 2007, A&A, 468, 627
- van Dishoeck (2004) van Dishoeck, E. F. 2004, ARA&A, 42, 119
- van Kempen et al. (2010) van Kempen, T. A., Kristensen, L. E., Herczeg, G. J., et al. 2010, A&A, 518, L121
- van Leeuwen (2007) van Leeuwen, F. 2007, A&A, 474, 653
- Waelkens et al. (1996) Waelkens, C., Waters, L. B. F. M., de Graauw, M. S., et al. 1996, A&A, 315, L245
- Wampfler et al. (2013) Wampfler, S. F., Bruderer, S., Karska, A., et al. 2013, A&A, 552, A56
- Wampfler et al. (2010) Wampfler, S. F., Herczeg, G. J., Bruderer, S., et al. 2010, A&A, 521, L36
- Woitke et al. (2009) Woitke, P., Kamp, I., & Thi, W. 2009, A&A, 501, 383
- Woitke et al. (2010) Woitke, P., Pinte, C., Tilling, I., et al. 2010, MNRAS, 405, L26
- Zhang et al. (2013) Zhang, K., Pontoppidan, K. M., Salyk, C., & Blake, G. A. 2013, ApJ, 766, 82
Appendix A PACS Spectra
Fig. 9 shows the PACS spectra of a the T Tauri star AS 205 and of the Herbig Ae star HD 97048 between 62–190 m. The main molecular and atomic transitions detected in the whole sample are shown. Figs. 10 and 11 show a portion of the PACS spectra of selected sources.
Appendix B OH line fluxes and molecular data of selected species
Table 7 reports the line fluxes of the far-IR OH transitions. The line flux uncertainties correspond to the 1 error. For non-detection the 3 upper limit is reported. Table 8 reports the atomic and molecular data of the transitions detected in this paper. Molecular data are taken from the LAMDA database (Schöier et al. 2005).
| 65.13 m | 65.28 m | 84.42 m | 84.59 m | 119.23 m | 119.44 m | 79.11 m | 79.18 m | |
| AB Aur | 7.0 2.0 | 12.5 2.0 | 10.1 1.5 | 10.1 1.5 | 2.8 1.4 | 3.1 1.4 | 9.0 | 9.0 |
| HD 36112 | 2.2 0.5 | 2.9 0.5 | 2.5 0.8 | 2.6 0.8 | 0.49 0.20 | 0.52 0.12 | 3.4 | 3.4 |
| HD 38120 | 3.5 | 3.5 | 2.8 | 2.8 | 0.9 | 0.9 | 2.7 | 2.7 |
| HD 50138 | 4.0 0.8 | 4.1 0.8 | a𝑎aa𝑎aB | 1.9 0.6 | 1.0 0.2 | 1.1 0.2 | 4.0 | 4.0 |
| HD 97048 | 4.9 1.0 | 5.7 1.0 | 6.8 1.0 | 6.8 1.0 | 2.4 | 2.4 | 4.0 | 4.0 |
| HD 100453 | 3.4 | 3.4 | 3.0 | 3.0 | 1.3 | 1.3 | 2.0 | 2.0 |
| HD 100546 | 13.6 0.4 | 19.9 3.3 | a𝑎aa𝑎aB | 13.8 2.0 | 4.2 0.9 | 4.2 0.9 | 6.0 | 6.0 |
| HD 104237 | 3.0 0.5 | 3.0 0.5 | 3.1 0.5 | 3.1 0.5 | 1.2 0.3 | 1.2 0.3 | 3.6 | 3.6 |
| HD 135344 B | 4.0 | 4.0 | 3.8 | 3.8 | 0.67 0.19 | 0.71 0.16 | 3.0 | 3.0 |
| HD 139614 | 4.6 | 4.6 | 3.6 | 3.6 | 1.2 | 1.2 | 3.0 | 3.0 |
| HD 142527 | 9.0 | 9.0 | 6.6 1.1 | 5.0 2.0 | 4.0 | 4.0 | 4.0 | 4.0 |
| HD 144668 | 4.5 | 4.5 | 4.8 | 4.8 | 0.8 | 0.8 | 4.0 | 4.0 |
| IRS 48 | 9.6 | 9.6 | 4.0 | 4.0 | 1.2 | 1.2 | 3.0 | 3.0 |
| HD 163296 | 5.3 0.8 | 4.5 0.8 | 2.8 0.5 | 2.7 0.5 | 1.3 0.2 | 0.74 0.23 | 3.0 | 3.0 |
| HD 169142 | 8.4 | 8.4 | 7.9 | 7.9 | 2.4 | 2.4 | 4.0 | 4.0 |
| HD 179218 | 3.2 | 3.2 | 2.7 | 2.7 | 1.1 | 1.1 | 2.0 | 2.0 |
| DG Tau | 5.9 0.7 | 8.9 0.7 | 10.6 0.7 | 10.4 0.7 | 2.6 0.4 | 3.8 0.4 | 4.7 0.8 | 4.7 0.8 |
| AS 205 | 6.5 1.0 | 6.4 1.0 | 4.8 0.8 | 4.7 0.8 | 0.8 0.3 | 1.3 0.3 | 2.2 0.8 | 2.5 0.8 |
| SR 21 | 3.8 | 3.8 | 3.9 | 3.8 | 1.3 | 1.3 | 3.5 | 3.5 |
| S CrA | 5.0 0.6 | 5.8 0.6 | 4.5 0.7 | 5.1 0.7 | absorption | absorption | 2.9 0.8 | 4.5 |
| 55.89 m | 55.95 m | 71.17 m | 71.21 m | 163.12 m | 163.40 m | |||
| AB Aur | 22.4 | 22.4 | 4.5 0.6 | 4.5 0.6 | 3.3 | 3.3 | ||
| HD 36112 | 7.6 | 7.6 | 1.2 0.2 | 1.2 0.3 | 1.5 | 1.5 | ||
| HD 38120 | 5.6 | 5.6 | 2.3 | 2.3 | 1.3 | 1.3 | ||
| HD 50138 | 8.0 | 8.0 | 2.0 0.4 | 2.0 0.4 | 1.8 | 1.8 | ||
| HD 97048 | 3.0 0.8 | 2.4 0.8 | 1.8 0.4 | 1.8 0.4 | 2.5 | 2.5 | ||
| HD 100453 | 5.5 | 5.5 | 3.0 | 3.0 | 1.4 | 1.4 | ||
| HD 100546 | 16.0 | 16.0 | 8.0 1.4 | 8.0 1.4 | 3.7 | 3.7 | ||
| HD 104237 | 2.4 0.8 | 2.7 0.8 | 1.4 0.3 | 1.4 0.3 | 1.7 | 1.7 | ||
| HD 135344 B | 8.2 | 8.2 | 2.7 | 2.7 | 1.6 | 1.6 | ||
| HD 139614 | 8.5 | 8.5 | 2.9 | 2.9 | 1.6 | 1.6 | ||
| HD 142527 | 13.0 | 13.0 | 6.3 | 6.3 | 2.8 | 2.8 | ||
| HD 144668 | 7.8 | 7.8 | 2.9 | 2.9 | 2.3 | 2.3 | ||
| IRS 48 | 8.3 | 8.3 | 2.9 | 2.9 | 1.6 | 1.7 | ||
| HD 163296 | 4.8 1.0 | 6.0 1.0 | 1.8 | 2.9 0.3 | 1.4 | 1.4 | ||
| HD 169142 | 13.5 | 13.5 | 5.8 | 5.8 | 2.8 | 2.8 | ||
| HD 179218 | 7.0 | 7.0 | 2.2 | 2.2 | 1.0 | 1.0 | ||
| DG Tau | 5.0 1.0 | 5.0 1.0 | 4.0 1.0 | 4.0 1.0 | 0.9 0.4 | 1.3 0.4 | ||
| AS 205 | 3.8 1.2 | 5.6 1.2 | 2.1 0.6 | 2.1 0.6 | 1.5 | 1.5 | ||
| SR 21 | 5.8 | 5.8 | 3.2 | 3.2 | 1.5 | 1.5 | ||
| S CrA | 6.0 | 6.0 | 1.6 0.6 | 1.9 0.6 | 1.6 | 1.6 | ||
| Species | Transition | log() | ||
| [m] | [K] | [s-1] | ||
| OH | 55.891 | 875 | 0.34 | |
| OH | 55.949 | 875 | 0.34 | |
| OH | 65.131 | 512 | 0.11 | |
| OH | 65.278 | 510 | 0.10 | |
| OH | 71.170 | 617 | 0.01 | |
| OH | 71.215 | 617 | 0.01 | |
| OH | 79.115 | 181 | -1.44 | |
| OH | 79.178 | 181 | -1.44 | |
| OH | 84.420 | 291 | -0.28 | |
| OH | 84.596 | 290 | -0.28 | |
| OH | 119.233 | 120 | -0.86 | |
| OH | 119.441 | 120 | -0.86 | |
| OH | 163.120 | 270 | -1.190 | |
| OH | 163.410 | 270 | -1.190 | |
| CH+ | 60.248 | 839 | 0.27 | |
| CH+ | 72.141 | 600 | 0.03 | |
| CH+ | 90.017 | 400 | -0.26 | |
| CH+ | 119.858 | 240 | -0.66 | |
| CH+ | 179.605 | 120 | -1.21 | |
| o-H2O | 58.70 | 550 | 0.14 | |
| p-H2O | 59.99 | 1020 | 0.13 | |
| o-H2O | 63.32 | 1070 | 0.24 | |
| o-H2O | 66.09 | 1013 | -0.02 | |
| o-H2O | 66.44 | 410 | 0.09 | |
| o-H2O | 71.95 | 843 | 0.06 | |
| o-H2O | 75.38 | 305 | -0.48 | |
| o-H2O | 78.74 | 432 | -0.32 | |
| p-H2O | 78.93 | 781 | -0.34 | |
| o-H2O | 82.03 | 643 | 0.06 | |
| p-H2O | 83.28 | 642 | -0.15 | |
| o-H2O | 108.07 | 194 | -0.59 | |
| o-H2O | 113.54 | 323 | -0.61 | |
| o-H2O | 179.53 | 114 | -1.25 | |
| p-H2O | 187.11 | 396 | -1.43 | |
| 63.185 | 228 | -4.05 | ||
| 145.535 | 327 | -4.75 | ||
| 157.680 | 91 | -5.64 |
Appendix C Effects of non-LTE excitation of OH far-IR
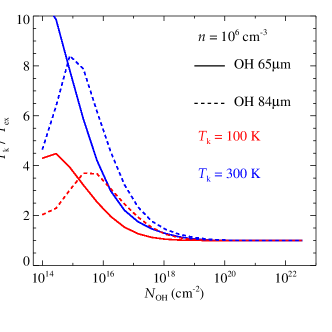
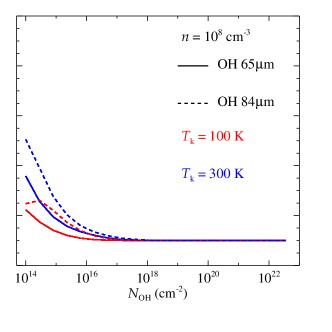
OH lines studied here have large critical densities (cm-3) and non-LTE excitation may be important if the gas density is not high enough to thermalize the OH molecules. To test the assumption of LTE we fit the observed rotational diagram using the non-LTE code RADEX (van der Tak et al. 2007). We used the same fitting procedure as for the LTE case and we repeated the analysis for different values of the gas (H2, collision partner) density (cm-3). Fig. 12 shows the OH rotational diagram for two test cases: the Herbig Ae HD 163296 and the T Tauri AS 205 disks. We reproduced the slab model using the best-fit parameters found in the LTE case with cm-2 and K for HD 163296 and cm-2 and K for AS 205 (Table 6). The non-LTE model predictions are plotted in Fig. 12 with different colors for the three values of . For low values ( cm-3) the model fails to reproduce the observed rotational diagram. The gas density must be cm-3 in order to fit the observations. Thus, the OH rotational lines emerge from an high density region where the OH molecules are thermalized and the rotational levels are in LTE.
Infrared pumping can be relevant for the excitation of OH molecules. To test the effects of line pumping we run a grid of RADEX models for HD 100546 providing also the infrared radiation field (between 20 m – 3 mm) in the input parameters. The radiation field is taken from the full disk thermo-chemical model of Bruderer et al. (2012) who computed the radiation field at each position of the disk for different wavelengths. The radiation field is stronger in the inner region of the disk (AU). As input to RADEX we considered the value of the infrared radiation field at a distance of =20 AU and height above the midplane =4 AU ( = 0.2). At larger radii and height (where the FIR OH lines originate) the radiation field is always fainter. Fig. 12 shows the OH rotational diagram of HD 100546 (middle row) and the RADEX predictions without (left) and with (right) infrared radiation field. The line flux ratios vary in the presence of infrared pumping, but even in this case high gas density (cm-3) is needed to reproduce the observed rotational diagram.
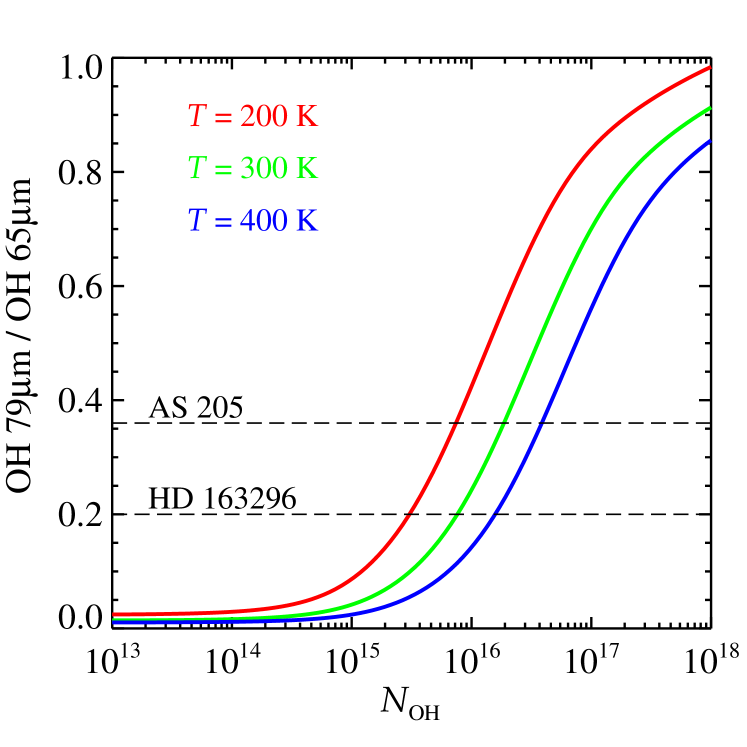
The non-LTE simulations also show that for large values of the column density (cm-2) the OH rotational lines are in LTE even at gas densities cm-3 (Fig. 12, bottom). This is due to line opacity which traps the photons and helps to thermalize the gas. However, we can exclude this scenario for most of the sources based on the non-detection of the intra-ladder transitions at 79 m. These transitions are indeed very sensitive to line opacity and the lines are easily detected for cm-2, as in the case of DG Tau and AS 205. This is shown in Fig. 13 where the ratio of the OH 79 m to the OH 65 m lines is shown in the LTE case for different temperatures. In order for the intra-ladder lines to be detected high column density is needed.
when the lines are optically thick.
Appendix D [O i], [C ii] spatial extent
This section describes an analysis of the atomic lines aiming at addressing the spatial extent of the line. The Herschel/PACS PSF varies substantially from 50 m to 200 m. As a consequence the amount of flux in the central spaxel varies from 70 % at 60 m to 55 % at 160 m. For this reason, line emission can be detected outside the central spaxel (especially in the red part 100 m). To check whether a line is spatially extended we compute the equivalent width () and integrated continuum () next to the line and check the relative spatial distribution. If the line emission is co-spatial to the continuum emission, then the spatial distribution of the equivalent width will be equal to that of the integrated continuum () (same PSF). In particular, the distribution of corresponds to the PSF at the given wavelength (assuming that the continuum emission is not spatially resolved).
For the [O i] 63 m line, is measured integrating the spectrum between 64.0 – 64.5 m and the equivalent width is measured integrating the spectrum between 63.08 – 63.30 m. The only source where off-source oxygen excess emission is DG Tau. Fig. 14 shows the [O i] 63 m spectral map of DG Tau: the (blue) dashed contours show the distribution of the spectral continuum and the sub-panels shows the [O i] 63 m spectrum in each spaxel. While the continuum is compact and centered on the central spaxel, the line emission shows an excess emission outside the central spaxel. The maximum excess is measured southward of the central source in agreement with the outflow position.
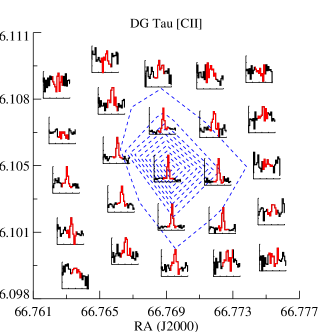
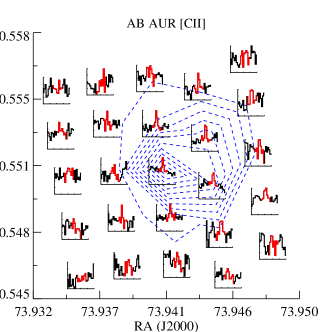
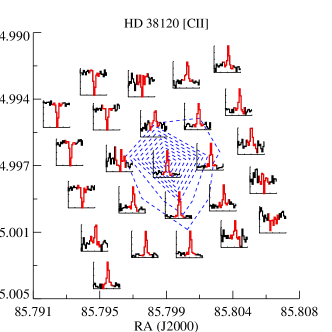
For the [C ii] line the line is integrated between 157.530 – 157.970 m and the continuum flux between 158.5 – 162 m. Figs. 14 and 15 shows the line spectral map for different sources. The spectral map shows the spectrum (continuum subtracted) in each spaxel. All the sources where [C ii] emission is detected show excess line emission outside the central spaxel. The most clear cases are HD 38120, IRS 48 and DG Tau. This pattern is the result of extended line emission. In the case of AB Aur and HD 97048 the object is mis-pointed and the spatial distribution of the continuum emission deviates from the PSF. Nevertheless, also in these two cases the line emission is not co-spatial with the continuum emission and proves a spatially extended line emission. The case of HD 50138 is less clear.
D.1 On-source [C ii] line flux
To estimate the maximum [C ii] emission associated with the protoplanetary disk the extended emission needs to be subtracted. To do this the [C ii] line flux (integrated between 157.60-157.98 m) in each of the 9 central spaxels is calculated. Then the extended emission is determined as the average of the line flux measured in the 8 neighbouring spaxels (around the central one) and subtracted from the value measured in the central spaxel. The result is reported in Table 3. In this way, the large scale ( 94) [C ii] emission is approximately removed. The value of the [C ii] flux derived by this method must be considered an upper limit to the [C ii] emission arising from the disk as extended emission from a compact remnant envelope may still be present in the central 94 94 area of the sky.