11email: giuseppe.gavazzi@mib.infn.it, g.consolandi1@campus.unimib.it, massimo.dotti@mib.infn.it 22institutetext: Universitäts-Sternwarte München, Scheinerstrasse 1, D-81679 München, Germany
22email: mfossati@mpe.mpg.de 33institutetext: Max-Planck-Institut für Extraterrestrische Physik, Giessenbachstrasse, D-85748 Garching, Germany 44institutetext: Centre for Astrophysics and Supercomputing, Swinburne University of Technology, Hawthorn, Victoria 3122, Australia
44email: gsavorgn@astro.swin.edu.au 55institutetext: Osservatorio astronomico di Bologna, Via Ranzani 1, I-40127 Bologna, Italy
55email: roberto.gualandi@oabo.inaf.it, ivan.bruni@oabo.inaf.it
Red-channel (6000-8000 Å) nuclear spectra of 376 local galaxies ††thanks: Tables 3 and 4 and Figure 4 are only available in electronic form at the CDS via anonymous ftp to cdsarc.u-strasbg.fr (130.79.128.5) or via http://cdsweb.u-strasbg.fr/cgi-bin/qcat?J/A+A/
We obtained long-slit optical spectra of the nuclear regions of 376 galaxies in the local Universe using the 1.5m Cassini telescope of Bologna Observatory. Of these spectra, 164 were either never taken before by the Sloan Digital Sky Survey (SDSS), or given by the Nasa Extragalactic Database (NED). With these new spectra, we contribute investigating the occurrence of active galactic nuclei (AGNs). Nevertheless, we stress that the present sample is by no means complete, thus, it cannot be used to perform any demographic study. Following the method presented in Gavazzi et al (2011), we classify the nuclear spectra using a six bin scheme: SEY (Seyfert), sAGN (strong AGN), and wAGN (weak AGN) represent active galactic nuclei of different levels of activity; HII accounts for star-forming nuclei; RET (retired) and PAS (passive) refer to nuclei with poor or no star-formation activity. The spectral classification is performed using the ratio of 6584 [NII] to lines and the equivalent width (EW) of versus (WHAN diagnostic introduced by Cid Fernandes and collaborators) after correcting for underlying absorption. The obtained spectra are made available in machine readable format via the Strasbourg Astronomical Data Center (CDS) and NED.
Key Words.:
Galaxies: active; Galaxies: nuclei; Galaxies: Seyfert1 Introduction
The advent of the Sloan Digital Sky Survey (SDSS, York et al. 2000) revolutionized the course of astronomy at the turn of the millennium. However some residual incompleteness remains in the SDSS spectroscopic database, especially at the bright luminosity end, due to shredding of the large galaxies and fiber conflict (Blanton et al. 2005a,b,c). Mitigating this problem is a task that even 1.5m class telescopes can contribute to. With this idea, we decided to continue the spectroscopic project that began in 2005 at the Loiano Observatory (Gavazzi et al. 2011) with an aim at searching for previously unknown optically selected active galactic nuclei (AGNs) in the local Universe111The first year master students of G.G. are invited annualy to participate in some observing runs at the 1.5m Loiano telescope, which are kindly provided by the Observatory of Bologna (It).. In 2012-2013, we obtained 127 new nuclear spectra, bringing the total number of galaxies independently observed to 376. These are spectra taken with the red-channel of the spectrograph, namely between 6000 and 8000 Å. Since nuclear spectra of about half these galaxies were neither obtained by SDSS nor distributed by NED, we provide our new observations to NED in order to make them publicly available in FITS (Flexible Image Transport Sistem) format.
The classification of AGNs based on optical nuclear spectra is routinely (eg, Decarli et al. 2007, Reines et al. 2013) performed using the BPT (Baldwin, Phillips & Terlevich) diagnostic diagram (Baldwin et al. 1981), which requires the measurement of four spectral lines: , [OIII], , and [NII]. General AGNs are disentangled from nuclear starbursts using the ratio [NII]/ (where must be corrected for any underlying stellar absorption, as stressed by Ho et al. 1997), while strong AGNs (sAGN) can be separated from the weaker (weak AGNs or wAGN) LINERs (Low-Ionization Nuclear Emission-Line Region) using the ratio [OIII]/. However a recent two-line diagnostic diagram named WHAN, which is based on the ratio combined with the strength of the line was introduced by Cid Fernandes et al. (2010, 2011) to disentangle strong and weak AGNs, believed to be triggered by supermassive black holes from “fake AGNs”, dubbed as retired galaxies, whose ionization mechanism is probably provided by their old stellar population (Trinchieri & di Serego Alighieri 1991, Binette et al. 1994, Macchetto et al. 1996, Stasińska et al. 2008, Sarzi et al. 2010, Capetti & Baldi 2011). For a nucleus to be considered ionized by a central black hole, it is necessary that the equivalent width (hereafter EW) of exceeds 3 Å (Cid Fernandes et al. 2010, 2011). This quantitative threshold has been, however, questioned by Gavazzi et al. (2011), who adopted 1.5 Å.
Given the two-line WHAN diagnostic diagram, the red-channel spectra presented in this work can contribute to increasing the number of known AGNs, especially those associated with nearby bright galaxies, most affected by the residual incompleteness of the SDSS spectral database. Nevertheless we reiterate that the present sample is not complete by any means, thus inadequate to perform any demographic study.
The outline of this paper is as follows. In Section 2 we describe the galaxy sample. In Section 3 we illustrate the observations taken at the Loiano observatory and the data reduction procedures. The nuclear spectra are given and classified in Section 4. In Section 5 we outline the fitting method applied to broad-line systems.
2 The sample
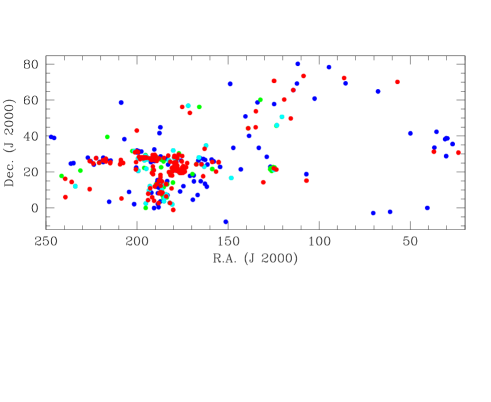
This paper is based on a miscellaneous set of 376 northern galaxies visible in spring, which is not complete by any means, and therefore not useful for performing any statistical study. They comprise of well-known bright local galaxies within , most of which have a nuclear spectrum already available from the literature, mixed with fainter previously unobserved objects. The latter were mainly selected from the Coma and Local superclusters (RA 180 deg, see Figure 1) for not having a nuclear spectrum available from SDSS or for the being unavailable, in either ASCII or FITS form, in the nuclear optical spectra from NED222Except for 162, all 376 galaxies in our sample have a redshift from NED. This does not necessarily mean that an optical nuclear spectrum is distributed by NED for all of them.. Figure 2 (top) illustrates the -band absolute magnitude distribution of the selected galaxies, showing a dramatic lack of objects fainter than -20 mag with respect to to those predicted by the -band luminosity function (e.g. Blanton et al. 2003). Figure 2 (bottom) highlights the preferential membership of the selected targets to the Coma supercluster () and the Virgo cluster and its surroundings ().

3 Observations and data reduction
We used the Bologna faint object spectrograph and camera (BFOSC, Gualandi & Merighi 2001) attached to the 152cm F/8 Cassini Telescope located in Loiano, which belongs to the Observatory of Bologna, to obtain optical spectra of the nuclei of 376 galaxies. The observations took place from 2005 to 2013 (see Table 1). The long-slit spectra were taken through a slit of 2 or 2.5 arcsec width (depending on the seeing conditions), with a intermediate-resolution red-channel grism (R 2200) that covers the 6100 - 8200 Å portion of the spectrum, which contains , [NII], and [SII] lines (three galaxies were observed also using a blue-channel grism covering H and [OIII], as shown in Figure 5). The detector used by BFOSC is an EEV LN/1300-EB/1 CCD of 1300x1340 pixels, with 90% quantum efficicency near 5500 Å. Its spatial scale of 0.58 arcsec/pixel results in a field of view of . The dispersion of the red-channel grism is 8.8 nm/mm and results in spectra with 1.6 Å/pix. The instrumental broadening is typically 6 Å full-width-half-maximum (FWHM), as checked on the 6300.3 Å sky line. We obtained exposures of 3-5 minutes, repeated typically three-six times per run (to remove the cosmic rays), but several galaxies were re-observed in more than one run (see Table LABEL:data2). The seeing at Loiano is typically 1.5 - 2.5 arcsec. The slit was mostly set in the E-W direction, except when it was positioned along the galaxy major axis or along the direction connecting two adjacent objects to accomodate both objects in one exposure. The wavelength was calibrated using frequent exposures of a He-Ar hollow-cathode lamp. We used several sky lines to check a posteriori the wavelength calibration. The spectrograph response was obtained by daily exposures of the star Feige-34.
| Year | Feb | Mar | Nspec |
| 2005 | 9,10,11 | 9,11,12 | 45 |
| 2006 | 26 | 23 | 24 |
| 2007 | 13,15,16 | 17,18 | 29 |
| 2008 | 5 | 3 | 10 |
| 2009 | 18,19,21 | 26,27 | 54 |
| 2010 | 8 | - | 10 |
| 2011 | 7,8,9,10 | 6,7,8 | 133 |
| 2012 | 23,24 | 14,15,16,17 | 74 |
| 2013 | 6,8,9 | 12,15 | 53 |
The spectra were reduced using the IRAF-STSDAS333IRAF is the Image Analysis and Reduction Facility made available to the astronomical community by the National Optical Astronomy Observatories, which are operated by AURA, Inc., under contract with the U.S. National Science Foundation. STSDAS is distributed by the Space Telescope Science Institute, which is operated by the Association of Universities for Research in Astronomy (AURA), Inc., under NASA contract NAS 5–26555. packages, following reduction procedures identical to Gavazzi et al. (2011) that are not repeated here. In summary, the flux and wavelength-calibrated 1-D spectra were extracted in apertures of 5.8 arcsec, normalized to the intensity of the continuum under , transformed to rest-frame velocity using the redshift provided by NED, and measured to obtain the intensity and EW of the and [NII] lines.
The presence of a strong telluric absorption feature near 6866 Å hampers the detection of [SII] lines at redshift near . Therefore, these lines are not analyzed444The same telluric feature would overlap with H near , which is larger than the largest redshift in our sample.. In the presence of broad permitted lines, the measurements of the EW and FWHM of the broad and narrow emission lines were obtained using the fitting procedure discussed in Section 5.
4 Spectral classification
The classification of the nuclear activity based on optical spectra was performed following the methods of Gavazzi et al. (2011) based on the WHAN diagram (Cid Fernandes et al. 2010, 2011). In short, the WHAN classification scheme is based on the strength of the line (, corrected for underlying stellar absorption, Ho et al. 1997) and the ratio between the flux of [NII] and . As in Gavazzi et al. (2011), we adopt a mean underlying stellar absorption at of 1.3 , irrespective of luminosity. 555Because and [NII] are close one another and since we use fluxes normalized to the continuum under , the same correction for stellar absorption is applied to the fluxes as to the EWs.
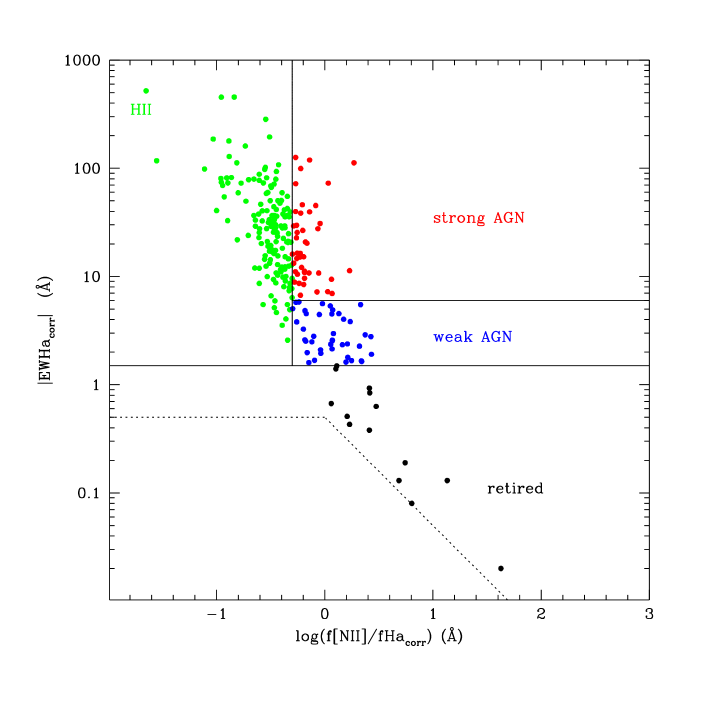
Figure 3 shows the WHAN diagram with the six adopted spectral classification thresholds. These thresholds (whose detailed description can be obtained from Gavazzi et al. 2011) allow to separate HII region-like nuclei (marked HII in Table LABEL:data2) from strong AGNs (sAGN), weak AGNs or LINERs (wAGN), and fake AGNs (dubbed as ”retired nuclei” or RET whose ionization mechanism is provided by their old stellar population). Passive nuclei (PAS) display no star formation activity. Their spectra show either H in absorption or undetected [NII]. Four Seyfert 1 galaxies are classified by visual inspection of the individual spectra for the presence of broad permitted lines (see Section 5).
Table LABEL:data1 gives the parameters of the 376 independently observed galaxies as follows:
Column 1: serial number;
Column 2: Galaxy name. The first three digits of the label give the year of observation.
L00 marks those spectra that are a median of two or more spectra obtained in different runs.
Then the catalog name and serial number: Arecibo galaxy catalog (AGC) (Haynes et al.2011), SDSS (DR7, Abazajian et al.2009);
catalog of galaxies and clusters of galaxies (CGCG) (Zwicky et al. 1968), Uppsala galaxy catalog (UGC) (Nilson 1973),
new galaxy catalog (NGC) (Dreyer 1888)
and index catalog (IC) (Dreyer 1908), Virgo cluster catalog (VCC) (Binggeli et al.1985), Markarian (MRK) (Markarian 1967), Herschel Reference Survey
(HRS) (Boselli et al 2010) designations;
Column 3 and 4: J2000 celestial coordinates;
Column 5: heliocentric redshift, as listed by NED;
Column 6: redshift independent distance in Mpc, as listed by NED. When this is unavailable, the
galactocentric Hubble-flow distance is listed;
Column 7: -band (AB) magnitude from SDSS when available. Otherwise, the total (Vega) magnitude
in the Johnson R, V or B band (as specified in parenthesis) from NED is used;
Column 8: a cross indicates the availability of a nuclear spectrum in NED;
Column 9: a cross indicates the availability of a fiber nuclear spectrum in SDSS.
Table LABEL:data2 summarizes the classification of spectra as follows:
Column 1: serial number;
Column 2: Galaxy name;
Column 3: number of individual exposures;
Column 4: duration of the individual exposures;
Column 5: slit aperture in arcsec;
Column 6: slit orientation (counterclockwise from N) in the various runs (yy);
Column 7: measured EW of 6548.1 [NII] line (dubbed [NII]1)(negative EW values represent emission);
Column 8: measured EW of the (narrow) H line;
Column 9: measured EW of 6583.6 [NII] line (dubbed [NII]2);
Column 10: R.M.S noise of the individual spectra determined between 6400 and 6500 Å;
Column 11: six bins nuclear activity classification.
We note that the EW and FWHM of the narrow H and of the two [NII] lines in Seyfert 1 galaxies have been computed applying the procedure described in Sect. 5 to consider the underlying broad H component. Adding all 160 spectra of HII-like nuclei, we obtain a template spectrum with a high signal-to-noise ratio (2370 at H). A ratio of is obtained, which is consistent with the theoretical value of 3.0 obtained by Osterbrock & Ferland (2006).
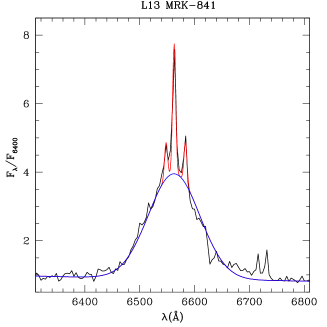
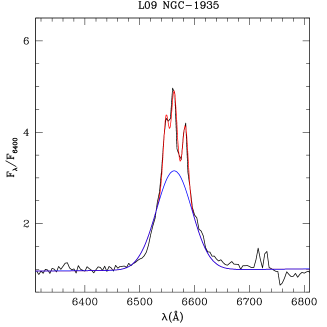
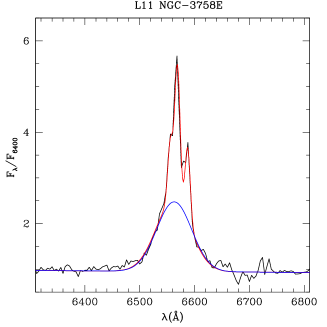
5 Broad line measurements
Four (L09 UGC-1935, L12 MRK-0079, L11 NGC-3758E, and L13 MRK-0841) of the 376 galaxies show the presence of a broad H line. To properly estimate the EW and FWHM of these broad lines and of the narrow H and [NII] lines, both the broad and narrow components have to be fit at the same time. We perform a very simple minimum -square fit, assuming that the underlying continuum follows a power-law profile and that every single broad and narrow line is well described by a single Gaussian profile. As a disclaimer, we note that the FWHM of the broad H lines can be slightly affected by a poor treatment of the underlying continuum, which does not include any specific galactic feature and where the very low flux tails of the lines are not fitted as well as possible by assuming two broad Gaussian, a Lorentzian, or a Voigt profile. The EW is almost unaffected by these small approximations. A high precision measurement of the FWHM of the broad H is beyond the scope of this analysis.
The fitting procedure has a total of nine free parameters: two describe
the power-law continuum, four are related to the narrow [NII] and H
lines, and three describe the broad H line. More
specifically, these include
the normalization and exponent of the power
low continuum;
the three normalizations of the narrow
H and [NII] lines and their FWHM, which are assumed to be the same for
every narrow line;
the normalization, FWHM, and peak
frequency of the broad H line. We let the peak frequency vary to
best fit the line profile, although no significant shifts have been
found.
| Obj | EWH | FWHM |
|---|---|---|
| Å | ||
| L09 UGC-1935 | -178.2 | 3480 |
| L12 MRK-0079 | -297.7 | 3706 |
| L11 NGC-3758E | -128.0 | 3426 |
| L13 MRK-0841 | -408.3 | 5042 |
The numerical values of the FWHM and EW obtained for the broad lines are reported in Table 2. For these four Seyfert 1 galaxies, the full fits with the fits of only the broad component are superimposed to the original spectra in Figure 6.
Acknowledgements.
G. Gavazzi thanks his first year master students for their assistence during many observing nights at Loiano. We thank Giorgio Calderone for discussions on the measurements of the broad-line systems. We are grateful to Paolo Franzetti and Alessandro Donati for their contribution to GoldMine, the Galaxy On Line Database (Gavazzi et al. 2003) extensively used in this work (http://goldmine.mib.infn.it). We thank Barry Madore for useful comments on the manuscript. We also thank the coordinator of the TAC, Valentina Zitelli for the generous time allocation. This research has made use of the NASA/IPAC Extragalactic Database (NED) which is operated by the Jet Propulsion Laboratory, California Institute of Technology, under contract with the National Aeronautics and Space Administration. The present study made extensive use of the DR7 of SDSS. Funding for the Sloan Digital Sky Survey (SDSS) and SDSS-II has been provided by the Alfred P. Sloan Foundation, the Participating Institutions, the National Science Foundation, the U.S. Department of Energy, the National Aeronautics and Space Administration, the Japanese Monbukagakusho, and the Max Planck Society, and the Higher Education Funding Council for England. The SDSS Web site is http://www.sdss.org/. The SDSS is managed by the Astrophysical Research Consortium (ARC) for the Participating Institutions. The Participating Institutions are the American Museum of Natural History, Astrophysical Institute Potsdam, University of Basel, University of Cambridge, Case Western Reserve University, The University of Chicago, Drexel University, Fermilab, the Institute for Advanced Study, the Japan Participation Group, The Johns Hopkins University, the Joint Institute for Nuclear Astrophysics, the Kavli Institute for Particle Astrophysics and Cosmology, the Korean Scientist Group, the Chinese Academy of Sciences (LAMOST), Los Alamos National Laboratory, the Max-Planck-Institute for Astronomy (MPIA), the Max-Planck-Institute for Astrophysics (MPA), New Mexico State University, Ohio State University, University of Pittsburgh, University of Portsmouth, Princeton University, the United States Naval Observatory, and the University of Washington.References
- Abazajian et al. (2009) Abazajian, K. N., et al. 2009, ApJS, 182, 543
- Baldwin et al. (1981) Baldwin, J. A., Phillips, M. M., & Terlevich, R. 1981, PASP, 93, 5
- Binette et al. (1994) Binette, L., Magris, C. G., Stasińska, G., & Bruzual, A. G. 1994, A&A, 292, 13
- Binggeli et al. (1985) Binggeli, B., Sandage, A., & Tammann, G. A. 1985, AJ, 90, 1681
- Blanton et al. (2003) Blanton, M. R., Hogg, D. W., Bahcall, N. A., et al. 2003, ApJ, 592, 819
- Blanton et al. (2005) Blanton, M. R., et al. 2005a, AJ, 129, 2562
- Blanton et al. (2005) Blanton, M. R., Lupton, R. H., Schlegel, D. J., Strauss, M. A., Brinkmann, J., Fukugita, M., & Loveday, J. 2005b, ApJ, 631, 208
- Blanton et al. (2005) Blanton, M. R., Eisenstein, D., Hogg, D. W., Schlegel, D. J.,& Brinkmann, J. 2005c, ApJ, 629, 143
- Boselli et al. (2010) Boselli, A., Eales, S., Cortese, L., et al. 2010, PASP, 122, 261
- Capetti & Baldi (2011) Capetti, A., & Baldi, R. D. 2011, A&A, 529, A126
- Cid Fernandes et al. (2010) Cid Fernandes, R., Stasińska, G., Schlickmann, M. S., Mateus, A., Vale Asari, N., Schoenell, W., & Sodré, L. 2010, MNRAS, 403, 1036
- Cid Fernandes et al. (2011) Cid Fernandes, R., Stasińska, G., Mateus, A., & Vale Asari, N. 2011, MNRAS, 413, 1687
- Decarli et al. (2007) Decarli, R., Gavazzi, G., Arosio, I., Cortese, L., Boselli, A., Bonfanti, C., & Colpi, M. 2007, MNRAS, 381, 136
- Dreyer (1888) Dreyer, J. L. E. 1888, MmRAS, 49, 1
- Dreyer (1908) Dreyer, J. L. E. 1908, MmRAS, 59, 105
- Gavazzi et al. (2003) Gavazzi, G., Boselli, A., Donati, A., Franzetti, P., & Scodeggio, M. 2003, A&A, 400, 451
- Gavazzi et al. (2011) Gavazzi, G., Savorgnan, G., & Fumagalli, M. 2011, A&A, 534, A31
- Gualandi & Merighi (2001) Gualandi R., & Merighi, R. Thecnical report 2001, Bologna Astronomical Observatory
- Haynes et al. (2011) Haynes, M. P., Giovanelli, R., Martin, A. M., et al. 2011, AJ, 142, 170
- Ho et al. (1997) Ho, L. C., Filippenko, A. V., & Sargent, W. L. W. 1997, ApJS, 112, 315
- Markarian (1967) Markarian, B. E. 1967, Astrofizika, 3, 55
- Nilson (1973) Nilson, P. 1973, Acta Universitatis Upsaliensis. Nova Acta Regiae Societatis Scientiarum
- Osterbrock & Ferland (2006) Osterbrock, D. E., & Ferland, G. J. 2006, Astrophysics of gaseous nebulae and active galactic nuclei, 2nd. ed. by D.E. Osterbrock and G.J. Ferland. Sausalito, CA: University Science Books, 2006,
- Reines et al. (2013) Reines, A.E., Greene J.E., Geha M. 2013, arxiv 1308.0328
- Sarzi et al. (2010) Sarzi, M., et al. 2010, MNRAS, 402, 2187
- Stasińska et al. (2008) Stasińska, G., Vale Asari, N., Cid Fernandes, R., Gomes, J. M., Schlickmann, M., Mateus, A., Schoenell, W., & Sodré, L., Jr. 2008, MNRAS, 391, L29
- Trinchieri & di Serego Alighieri (1991) Trinchieri, G., & di Serego Alighieri, S. 1991, AJ, 101, 1647
- York et al. (2000) York, D. G., Adelman, J., Anderson, J. E., Jr., et al. 2000, AJ, 120, 1579
- Zwicky et al. (1961-1968) Zwicky, F., Herzog, E., & Wild, P. 1961-68, Pasadena: California Institute of Technology (CIT), —c1961-68,
| ID | Obj | RA | Dec | Dist | NED | SDSS | ||
|---|---|---|---|---|---|---|---|---|
| hh:mm:ss,ss | dd:pp:ss.s | Mpc | mag | |||||
| (1) | (2) | (3) | (4) | (5) | (6) | (7) | (8) | (9) |
| 1 | L11-M33-HII | 01:34:33.19 | +30:47:00.4 | -0.000597 | 0.88 | - | ||
| 2 | L05-CGCG-522-004 | 01:47:16.15 | +35:33:47.9 | 0.015591 | 78.3 | 12.32 (V) | x | |
| 3 | L05-CGCG-522-093 | 01:58:35.20 | +38:43:06.8 | 0.016878 | 71.2 | 15.21 (V) | x | |
| 4 | L05-CGCG-522-104 | 02:00:59.71 | +38:47:04.7 | 0.018880 | 79.4 | 15.15 (V) | x | |
| 5 | L11-NGC-0784 | 02:01:16.93 | +28:50:14.1 | 0.000660 | 4.62 | 12.16 - | x | |
| 6 | L05-CGCG-522-106 | 02:03:44.83 | +38:15:31.4 | 0.019227 | 62.3 | 13.09 (V) | x | |
| 7 | L09-NGC-0891 | 02:22:33.41 | +42:20:56.9 | 0.001761 | 10.2 | 7.86 (R) | x | |
| 8 | L00-NGC-0925 | 02:27:16.88 | +33:34:45.0 | 0.001845 | 8.57 | 9.55 (R) | x | |
| 9 | L09-UGC-1935 | 02:28:14.47 | +31:18:41.9 | 0.016652 | 52.3 | 14.64 | ||
| 10 | L00-NGC-1068 | 02:42:40.71 | -00:00:47.8 | 0.003793 | 13.5 | 10.62 | x | |
| 11 | L00-NGC-1275 | 03:19:48.16 | +41:30:42.1 | 0.017559 | 68.2 | 11.61 (R) | x | |
| 12 | L09-UGC-2855 | 03:48:20.73 | +70:07:58.4 | 0.004003 | 17.1 | 11.11 (R) | ||
| 13 | L11-NGC-1507 | 04:04:27.21 | -02:11:18.9 | 0.002879 | 11.1 | 11.90 (R) | x | |
| 14 | L11-NGC-1569 | 04:30:49.05 | +64:50:52.6 | -0.000347 | 2.89 | 10.69 (R) | x | |
| 15 | L11-NGC-1637 | 04:41:28.17 | -02:51:28.6 | 0.002392 | 10.7 | 11.01 (R) | x | |
| 16 | L06-NGC-1961 | 05:42:04.64 | +69:22:42.3 | 0.013122 | 55.6 | 10.99 (V) | x | |
| 17 | L13-UGC-3343 | 05:45:24.64 | +72:21:22.4 | 0.003636 | 18.8 | 11.96 (I) | ||
| 18 | L12-NGC-2146 | 06:18:37.71 | +78:21:25.3 | 0.002979 | 22.4 | 9.83 (R) | x | |
| 19 | L07-NGC-2273 | 06:50:08.65 | +60:50:44.9 | 0.006138 | 30.9 | 10.52 (R) | x | |
| 20 | L13-UGC-3691 | 07:08:01.28 | +15:10:42.3 | 0.007348 | 36.5 | 12.60 (B) |
| ID | Obj | N | Texp | ap | PA | EW[NII]1 | EWH | EW[NII]2 | rms | class |
|---|---|---|---|---|---|---|---|---|---|---|
| s | ” | deg | Cnts | |||||||
| (1) | (2) | (3) | (4) | (5) | (6) | (7) | (8) | (9) | (10) | (11) |
| 1 | L11-M33-HII | 3 | 180 | 2.0 | 90 | -35.86 | -1314.0 | -125.6 | 0.09 | HII |
| 2 | L05-CGCG-522-004 | 1 | 600 | 2.0 | 30 | -0.53 | -0.49 | -2.92 | 0.04 | wAGN |
| 3 | L05-CGCG-522-093 | 1 | 600 | 2.0 | 120 | -2.42 | -9.18 | -5.849 | 0.19 | sAGN |
| 4 | L05-CGCG-522-104 | 3 | 900 | 2.0 | 90 | -2.32 | -13.39 | -8.115 | 0.11 | sAGN |
| 5 | L11-NGC-0784 | 4 | 300 | 2.0 | 0 | - | -86.61 | - | 0.25 | HII |
| 6 | L05-CGCG-522-106 | 3 | 600 | 2.0 | 150 | -0.69 | -3.23 | -3.052 | 0.04 | wAGN |
| 7 | L09-NGC-0891 | 3 | 300 | 2.5 | 90 | -3.94 | -36.45 | -15.47 | 0.35 | HII |
| 8 | L00-NGC-0925 | 7 | 300 | 2.0 | 85 (09,13) | -2.73 | -45.23 | -11.88 | 0.14 | HII |
| 9 | L09-UGC-1935 | 3 | 420 | 2.0 | 74 | -17.60 | -21.6 | -17.0 | 0.04 | SEY1 |
| 10 | L00-NGC-1068 | 4 | 470 | 2.0 | 90 (10,11) | -67.30 | -111.2 | -209.1 | 0.01 | sAGN |
| 11 | L00-NGC-1275 | 6 | 300 | 2.0 | 90 (12,13) | -43.25 | -71.56 | -78.51 | 0.04 | sAGN |
| 12 | L09-UGC-2855 | 3 | 300 | 2.0 | 105 | -2.69 | -23.55 | -11.48 | 0.12 | HII |
| 13 | L11-NGC-1507 | 4 | 180 | 2.0 | 10 | -3.60 | -79.16 | -8.82 | 0.13 | HII |
| 14 | L11-NGC-1569 | 2 | 180 | 2.0 | 90 | - | -116.1 | -3.28 | 0.03 | HII |
| 15 | L11-NGC-1637 | 2 | 300 | 2.0 | 10 | -7.53 | -37.21 | -23.05 | 0.03 | sAGN |
| 16 | L06-NGC-1961 | 3 | 300 | 2.0 | 90 | -6.05 | -10.01 | -19.20 | 0.01 | sAGN |
| 17 | L13-UGC-3343 | 3 | 360 | 2.5 | 79 | -3.74 | -71.89 | -9.31 | 0.17 | HII |
| 18 | L12-NGC-2146 | 3 | 300 | 2.0 | 90 | -7.94 | -53.66 | -24.78 | 0.04 | HII |
| 19 | L07-NGC-2273 | 1 | 180 | 2.0 | 90 | -8.89 | -29.57 | -27.93 | 0.04 | sAGN |
| 20 | L13-UGC-3691 | 3 | 600 | 2.5 | 63 | - | -8.71 | -4.38 | 0.23 | HII |