Probing the Upper Scorpius mass function in the planetary-mass regime ††thanks: Based on observations collected with the ESO VISTA telescope under programme number 089-C.0102(ABC).
Abstract
We present the results of a deep near-infrared survey of 13.5 square degrees in the Upper Scorpius (USco) OB association. We photometrically selected 100 cluster member candidates with masses in the range 30–5 Jupiters, according to state-of-the-art evolutionary models. We identified 67 candidates as bona-fide members, based on complementary photometry and astrometry. We also extracted five candidates detected with VISTA at only. One is excluded using deep optical -band imaging, while two are likely non-members, and three remain as potential members. We conclude that the USco mass function is more likely decreasing in the planetary-mass regime (although a flat mass function cannot yet be discarded), consistent with surveys in other regions.
keywords:
Stars: low-mass stars and brown dwarfs — techniques: photometric — Infrared: Stars — surveys — stars: luminosity function, mass function1 Introduction
The quest for young low-mass objects in the planetary-mass regime aims at addressing two fundamental questions in our understanding of star formation: what is the lowest mass fragment that star formation processes can form? and what is the shape of the initial mass function (IMF; Salpeter, 1955; Miller & Scalo, 1979; Scalo, 1986) below the deuterium-burning limit? Finding planetary-mass objects can help distinguishing among the different star formation models proposed during the past decades. The earliest theoretical prediction by Kumar (1969) suggested a minimum mass of one Jupiter mass (MJup) whereas 3D opacity-limited hierarchical fragmentation yielded a range between 7 and 10 MJup (Low & Lynden-Bell, 1976; Rees, 1976; Silk, 1977; Boss, 1988). More recent calculations place that limit around (or below) 3–5 MJup (Boyd & Whitworth, 2005; Whitworth & Stamatellos, 2006; Forgan & Rice, 2011; Rogers & Wadsley, 2012).
Several surveys have been carried out over the past years to identify bona-fide L and T dwarfs in young star-forming regions to probe the planetary-mass regime and investigate the shape of the substellar mass function. Old field L dwarfs with ages greater than 1 Gyr have typically effective temperatures in the 2200–1400 K range and (model-dependent) masses around 85–50 MJup (Basri et al., 2000; Leggett et al., 2000; Kirkpatrick, 2005), whereas old T dwarfs have temperatures below 1400 K (Burgasser et al., 2006) and masses below 50 MJup (Kirkpatrick, 2005). By comparison, 10 Myr-old L and T dwarfs would have masses in the 20–4 MJup and 4 MJup, respectively (Kirkpatrick, 2005). The best studied region for young L and T dwarfs is Orionis, where deep photometric surveys complemented by optical and near-infrared spectroscopy have been conducted (Zapatero Osorio et al., 2000; Barrado y Navascués et al., 2001; Martín et al., 2001; Caballero et al., 2007; Bihain et al., 2009; Peña Ramírez et al., 2011; Peña Ramírez et al., 2012). The mass function in this region keeps rising in a linear scale (dN/dMM-α; Kroupa, 2002) from early-type stars (19 solar masses) all the way down to the planetary-mass regime (13 MJup) with a possible turn-over below 5 MJup (Peña Ramírez et al., 2012). In NGC 1333, Scholz et al. (2012) estimated that the number of 5–15 MJup members should be less than ten, implying a decreasing mass function in the planetary-mass regime and a possible cut-off below 6 MJup. Alves de Oliveira et al. (2012) confirmed spectroscopically the first L dwarfs in the Ophiuchus molecular cloud with masses between 10 and 4 MJup, resulting in a mass function in agreement with other regions (Bastian et al., 2010) and the field (Chabrier, 2003, 2005). Moreover, Spezzi et al. (2012) reported two potential T–type candidates in the core of the Serpens cloud with masses of a few Jupiter masses if true members. Similarly Burgess et al. (2009) identified one mid-T–type candidate in IC 348 with a mass between 5 and 1 MJup but spectroscopy is mandatory to confirm their nature. This T-type candidate is consistent with the extrapolation of the substellar IMF in IC 348 (Alves de Oliveira et al., 2013). A few other L and T dwarf candidates have been announced in older clusters (e.g. Casewell et al., 2007; Bouvier et al., 2008; Hogan et al., 2008; Boudreault & Lodieu, 2013) but state-of-the-art models anticipate masses in the midst of the substellar regime (30–50 MJup; Baraffe et al., 1998; Chabrier et al., 2000) because of their older ages (125 Myr for the Pleiades and 600 Myr for Praesepe and the Hyades; Stauffer et al., 1998; Perryman et al., 1998; Fossati et al., 2008).
Upper Scorpius (hereafter USco) is part of the nearest OB association to the Sun, Scorpius Centaurus. The combination of its distance (145 pc; de Bruijne et al., 1997), young age (5 or 10 Myr depending on the authors; Preibisch & Zinnecker, 1999; Pecaut et al., 2012; Song et al., 2012), and proper motion (mean value of 25 mas/yr; de Bruijne et al., 1997; de Zeeuw et al., 1999), makes it an ideal place to look for brown dwarfs and isolated planetary-mass objects to test the theory of the fragmentation limit (Kumar, 1969; Low & Lynden-Bell, 1976; Rees, 1976). The bright end of the USco population has been examined in X-rays (Walter et al., 1994; Kunkel, 1999; Preibisch et al., 1998), astrometrically (de Bruijne et al., 1997; de Zeeuw et al., 1999), and spectroscopically (Preibisch & Zinnecker, 2002). The low-mass and substellar population has been investigated over the past decade in great details with the advent of modern detectors permitting wide and/or deep surveys (Ardila et al., 2000; Martín et al., 2004; Slesnick et al., 2006; Lodieu et al., 2006; Lodieu et al., 2007; Slesnick et al., 2008; Dawson et al., 2011; Lodieu et al., 2011; Dawson et al., 2012; Lodieu, 2013). More recently, we published five potential T–type candidates (Lodieu et al., 2011), discovery not supported by subsequent optical and near-infrared imaging (Lodieu et al., 2013).
In this paper, we present a deep ( = 20.5 mag 100% completeness) and wide (13.5 square degrees) near-infrared survey of the central region of the USco association conducted with the Visible and Infrared Survey Telescope for Astronomy (VISTA; Emerson, 2001; Emerson et al., 2004) located in Paranal, Chile. In Section 2 we describe the observations, data reduction, and image stacking procedure. In Section 3 we describe complementary datasets from the United Kingdom InfraRed Telescope (UKIRT) Infrared Deep Sky Survey (UKIDSS; Lawrence et al., 2007) Galactic Clusters Survey (GCS) and optical imaging from the 6.5-m Magellan telescope. In Section 4 we detail the photometric selection of member candidates in the USco association. In Section 5 we discuss the shape of the mass function in the planetary-mass regime, comparing the numbers of candidates with our previous determination from the UKIDSS GCS.
2 The deep survey
2.1 Near-infrared imaging
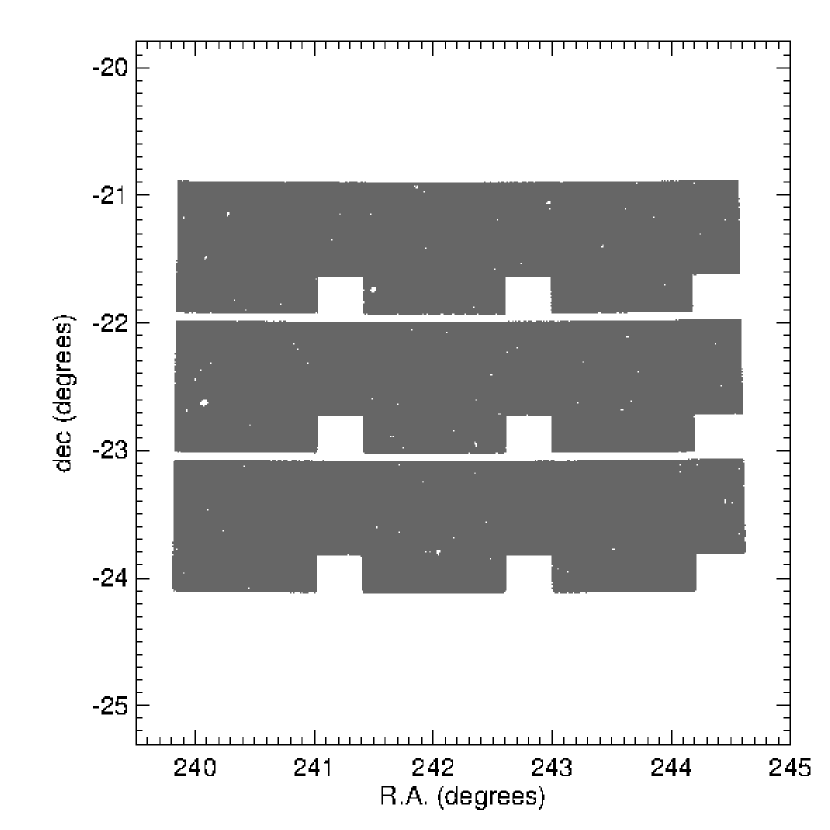
We performed a near-infrared survey of 13.5 square degrees in USco (Fig. 1) with the VISTA InfraRed CAMera (VIRCAM; Dalton et al., 2006) mounted on VISTA telescope (Emerson, 2001; Emerson et al., 2004) in Paranal, Chile. We choose this part of USco because a subset of this region was imaged as part of the UKIDSS GCS Science verification (Lodieu et al., 2007) and contains many low-mass brown dwarf members confirmed spectroscopically (Lodieu et al., 2011). VIRCAM contains 67 million pixels of mean size 0.339 arcsec, offering an instantaneous field-of-view of 0.6 square degrees. Six “paw-print” observations are mosaicked together to produce a tile with an area of 1.65 square degrees. We imaged USco in the filters in service mode between April and May 2012 (see logs of observations in Table LABEL:tab_USco_VISTA:log_obs). In this paper we use only observing blocks completed as part of our ESO (European Southern Observatory) program 089.C-102(ABC) that complied with our original request (grade A or B according to ESO observing logs): clear sky, grey time with the moon further away than 30 degrees from our target to avoid reflection on the telescope, seeing better than 1.2 arcsec, and airmass less than 1.5 (Table LABEL:tab_USco_VISTA:log_obs).
We employed a similar strategy for all three passbands. We set the detector on-source integrations (DIT) to 50 sec, 60 sec, and 24 sec in , , and , respectively, with six pawprint positions and five jitter positions to create a sky frame (no microstepping). We repeated the DIT twice in the case of and also repeated the full observing blocks. The total exposure times amount for 100 min, 30 min, and 12 min in , , and , respectively.
| Tile | R.A. | Dec | Z | Y | J | |||||||||
|---|---|---|---|---|---|---|---|---|---|---|---|---|---|---|
| Date | Seeing | Ell | ZP | Date | Seeing | Ell | ZP | Date | Seeing | Ell | ZP | |||
| hh:mm:ss.ss | ∘:′:′′ | yymmdd | arcsec | mag | yymmdd | arcsec | mag | yymmdd | arcsec | mag | ||||
| 1_1_1 | 16:02:05.18 | 23:41:04.6 | 120428 | 0.974 | 0.040 | 23.761 | 120415 | 1.302 | 0.029 | 23.471 | 120420 | 0.955 | 0.079 | 23.752 |
| 1_1_2 | 16:08:27.20 | 23:41:04.6 | 120517 | 0.989 | 0.052 | 23.762 | 120419 | 1.000 | 0.042 | 23.460 | 120420 | 0.944 | 0.048 | 23.738 |
| 1_1_3 | 16:14:43.50 | 23:41:04.6 | 120516 | 0.905 | 0.052 | 23.754 | 120417 | 0.821 | 0.061 | 23.466 | 120428 | 0.883 | 0.064 | 23.753 |
| 1_2_1 | 16:02:05.18 | 22:35:33.0 | 120430 | 0.885 | 0.053 | 23.770 | 120417 | 0.960 | 0.042 | 23.432 | 120421 | 0.703 | 0.060 | 23.766 |
| 1_2_2 | 16:08:27.20 | 22:35:33.0 | 120430 | 0.836 | 0.064 | 23.774 | 120416 | 0.769 | 0.058 | 23.478 | 120430 | 0.899 | 0.048 | 23.757 |
| 1_2_3 | 16:14:46.40 | 22:35:33.0 | 120516 | 0.867 | 0.054 | 23.754 | 120419 | 0.775 | 0.054 | 23.463 | 120428 | 0.951 | 0.049 | 23.738 |
| 1_3_1 | 16:02:05.18 | 21:30:01.2 | 120517 | 0.935 | 0.050 | 23.766 | 120417 | 0.777 | 0.059 | 23.478 | 120422 | 0.778 | 0.056 | 23.746 |
| 1_3_2 | 16:08:27.20 | 21:30:24.8 | 120516 | 1.012 | 0.044 | 23.777 | 120416 | 0.769 | 0.055 | 23.479 | 120422 | 0.781 | 0.061 | 23.744 |
| 1_3_3 | 16:14:49.66 | 21:29:53.3 | 120516 | 0.971 | 0.042 | 23.768 | 120418 | 0.832 | 0.053 | 23.473 | 120422 | 0.762 | 0.056 | 23.736 |
2.2 Data reduction
The data reduction and processing was done as part of the VISTA Data Flow System (VDFS; Emerson et al., 2004), which involves initial quality control at Garching by ESO, observing block (OB) processing and monthly photometric calibration at Cambridge by the Cambridge Astronomical Survey Unit (CASU) 111See http://casu.ast.cam.ac.uk/surveys-projects/vista/technical/ for the latest details and multi-night processing, matching to external data sets and archiving in Edinburgh by Wide-Field Astronomy Unit (WFAU; Cross et al., 2012).
The initial data reduction of the VISTA images involves the following processes222More details at http://apm49.ast.cam.ac.uk/surveys-projects/vista/technical/data-processing:
-
•
Reset correction - similar to bias removal
-
•
Dark correction - removal of dark current, using exposures taken through a dark filter
-
•
Linearity correction - take out non-linearities in the detector response
-
•
Flat field correction - remove small scale QE variations using twilight flats
-
•
Sky background correction - remove 2D sky background
-
•
Destripe - remove stripe pattern from readout channels. Use detector symmetry
-
•
Jitter stacking - combine individual, but offset, exposures to remove defects
-
•
Catalogue generation - extractor finds sources that have more than 4 connected pixels at a threshold of above the sky noise.
-
•
Astrometric and photometric calibration - Uses the 2MASS all sky catalogue to get an astrometric and photometric calibration. Enhancements, such as zeropoint offsets between detectors and the scattered light (illumination) correction are found later, using a month of data. VISTA data has not been accurately calibrated to the Vega system, as in the case of UKIRT-WFCAM. Instead it was decided to leave the photometry in the VISTA system and provide colour equations, see Hodgkin et al. (2013, in prep).
-
•
Tile generation - 6 pawprints are mosaicked together to form a 1.5 sq. degree tile. The catalogue generation is done from a different tile, created after filtering each pawprint with a nebulosity filter to remove structure on scales , to produce smooth backgrounds. Additional steps of grouting, to remove effects of mosaicing together pawprints with different PSFs and reclassification are necessary to produce the best tile catalogues.
All of the individual OBs in the VISTA data are processed in this way. Automated quality control was run to deprecate poor quality frames. More than of all science frames in this programme passed with over of the deprecated frames coming from OBs which were incomplete or otherwise were set to be reobserved (ESOGRADE C/D/R). At WFAU, OB tiles are grouped into the individual programmes and then processed programme by programme (Cross et al., 2012) matching data across filters and epochs. The main steps are:
-
•
Create tile-pawprint tables linking tile detections to pawprint detections.
-
•
Create deep stacks and tiles. This was necessary for some -band data which was split over two OBs.
-
•
Band merge deepest data in each band to produce
n089c102Sourcetable, which is seamed to create a list of unique objects - •
-
•
Create best-match and variability tables, so that light-curves can be generated for sources. This was done for the -band with the 2-epochs, with some sources (in overlap regions) having up to eight observations.
2.3 Image stacking and tiling
The creation of deep pawprint stacks and deep tiles from data across many OBs uses the same software (developed by CASU 333http://apm49.ast.cam.ac.uk/surveys-projects/software-release) as was used in the OB stacking and tile creation, except that is bound into the VISTA Science archive software, which selects all the data in the same pointing and filter that passes the quality control, rather than using data with the same OB and group identifiers. The processing of deep stacks and tiles is described in detail in Cross et al. (2012). Deep tiles are not made by stacking OB tiles, but are created by mosaicing 6 deep pawprint stacks which are in turn created by stacking OB pawprint stacks. This processing sequence gives the best image quality. Photometric calibration of deep pawprint stacks is done by comparing to the component OB stacks; these having been observed in the same filter avoids any colour selection or colour terms that are necessary when comparing with 2MASS. Similarly deep tiles are calibrated by comparing to the component deep pawprints.
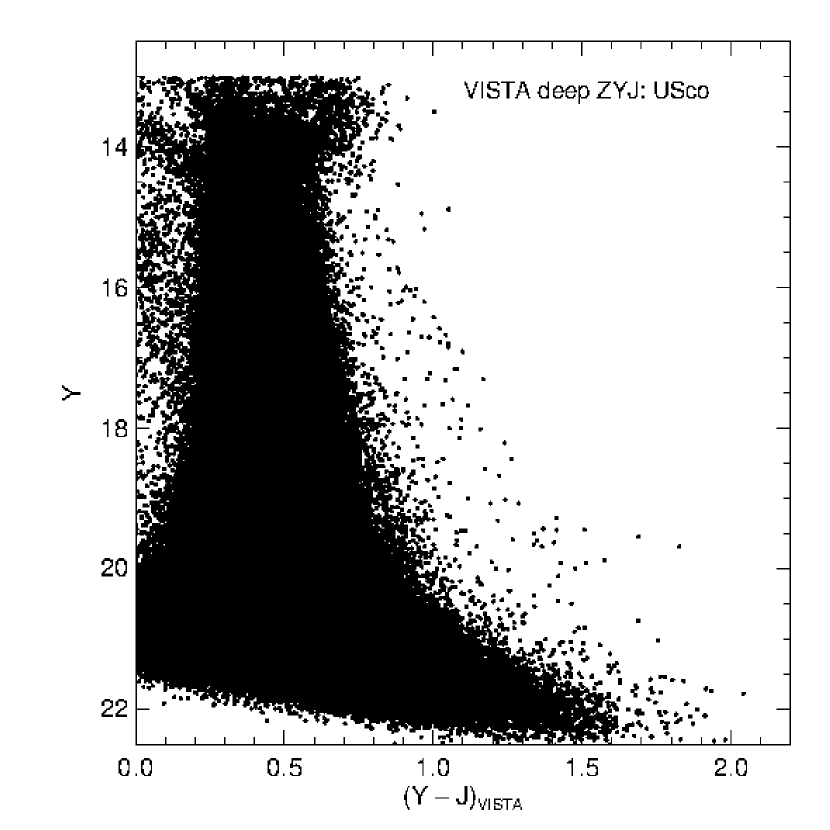
The (,) colour-magnitude diagram for all high-quality point sources after the stacking process is shown in Fig. 2. We estimate the depth of our final combined images from the point where the linear fit to the histograms of the numbers of sources as a function of magnitude diverge. We derive 100% completeness limits of 22.0 mag, 21.2 mag, and 20.5 mag in , , and , respectively. The saturation limits are 14.0 mag, 14.6 mag, and 14.3 mag in , , and , respectively.
3 Complementary datasets
3.1 The UKIDSS GCS as first epoch
The UKIDSS project, defined in Lawrence et al. (2007), consists of several sub-projects, including the GCS whose main scientific goal is to study the shape and universality of the mass function in the low-mass and substellar regimes. UKIDSS uses the UKIRT Wide Field Camera (WFCAM; Casali et al., 2007). The photometric system is described in Hewett et al. (2006), and the calibration is described in Hodgkin et al. (2009). The pipeline processing and science archive are described in Irwin et al. (2004) and Hambly et al. (2008), respectively. In this section, we use the GCS data to complement our deep VISTA survey with and photometry and proper motions from the tenth data release (14 January 2013). The 5 completeness limits of the UKIDSS GCS are typically = 20.2 mag, = 19.8 mag, = 19.3 mag, = 18.4 mag, and = 18.1 mag (e.g. Figure 2 of Lodieu et al., 2012; Dye et al., 2006), implying that our VISTA survey is 1.2–1.8 mag deeper than the GCS depending on the filter. The proper motions computed as part of the latest GCS data release take into account the different epochs of observations in all the filters (Collins & Hambly, 2012), providing proper motions accurate to 5–10 mas/yr.
3.2 Magellan/IMACS -band imaging
A number of regions of Upper Sco were observed in the -band during May 2009 with the Inamori Magellan Areal Camera and Spectrograph (IMACS) and the 6.5m Magellan Baade telescope. Total integration times of 90 min were built-up through a number of 300s sub-exposures. IMACS is a wide-field imaging system (or multiobject spectrograph) in which light from the Gregorian secondary of the telescope is fed to one of two cameras, short (f/2.5) or long (f/4.3). The short camera, used for these observations, is constructed around a mosaic of eight 20484096 pixel CCDs and covers a 27.5’27.5’ (0.20 arcsec pixels) area of sky per pointing. However, it suffers from strong vignetting at distances more that 15’ from the field center.
The data frames were reduced using the Cambridge Astronomical Survey Unit CCD reduction toolkit (Irwin & Lewis, 2001) to follow standard steps, namely, subtraction of the bias, flat-fielding, astrometric calibration, and co-addition. We performed aperture photometry on the reduced images using a circular window with a diameter of 1.5 the full width half maximum of the mean point spread function (0.6-0.7 arcsec). Finally, we cross-correlated our optical photometry with our catalogue of near-infrared data and transformed our instrumental magnitudes onto approximately the VISTA -band natural system.
4 Photometric selection of member candidates in USco
4.1 Contents of the VISTA catalogue
We wrote a Structure Query Language sent to the VISTA Science archive (Cross et al., 2012) to retrieve all good-quality point sources present in the VISTA catalogue. We imposed quality criteria set by the ppErrBits parameters (less than 256) as well as point source criteria determined by the Class and ClassStat parameters. We considered only sources fainter than = 13 mag and = 12 mag although saturation limits are fainter by at least one magnitude. We also allowed for -band non detection to improve our completeness at the faint end.
Our deep VISTA survey overlaps with the coverage from the GCS DR10. Our SQL query includes a cross-match of both catalogues using a matching radius of 3 arcsec. Hence, every source in the VISTA catalogue is associated with an object in the GCS catalogue if there is one within this matching radius. The final catalogue provides photometry (two epochs in ) for 1,098,027 point sources444we plan to make this catalogue available to the community via Vizier at the Centre de Données de Strasbourg, along with their proper motions and associated errors from the GCS DR10.
These proper motions and their associated errors are measured from the multiple epochs available from the GCS, calculating a mean epoch and a making linear least-square fit on the errors of the positions with standard error propagation. A factor for the noise floor has been added to correct for the fact that the centroid errors are not getting better with brighter magnitudes but instead reach a plateau. The procedure is detailed at length in Collins & Hambly (2012).
4.2 Deep survey
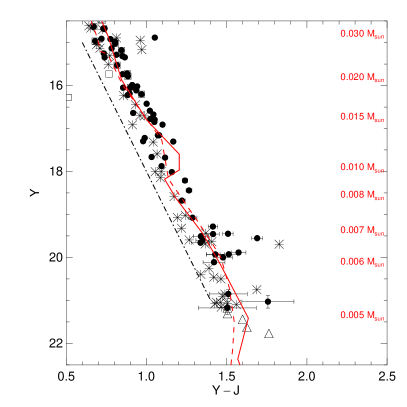
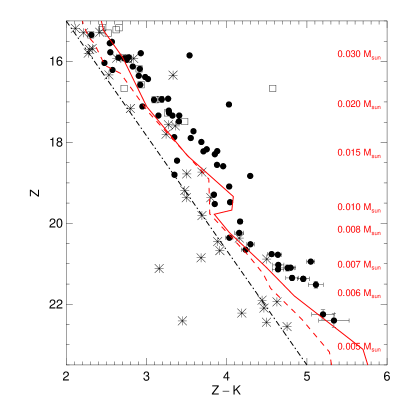
We applied photometric cuts in two colour-magnitude diagrams to select member candidates in the 13.5 square degrees surveyed in USco, based on the location of known USco members located in the VISTA coverage (open squares in Fig. 3), which are confirmed photometrically, astrometrically, and spectroscopically (Lodieu et al., 2011; Lodieu, 2013). We recovered 37 known members from our previous work, including 12 fainter than = 14.6 mag (open square in Figs 3 & 4; Lodieu et al., 2011).
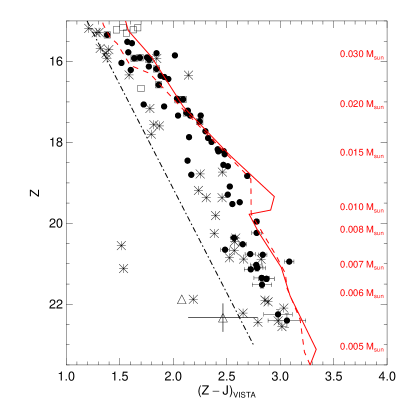
We restrain our photometric selection to sources fainter than = 14.6 mag (unsaturated objects) and brighter than the 100% completeness limits of our survey in and only. We started our photometric selection in the (,) colour-magnitude diagram (Fig. 3) because it offers the greatest sensitivity to substellar members. We kept only sources to the right of the lines (dot-dashed lines in Fig. 3) defined by:
-
•
(,) = (0.6,15.0) to (1.4,21.0)
-
•
(,) = (1.0,14.0) to (2.75,23.0)
The selection returned 109 candidates, number reduced to 101 when applying the photometric cuts in the (,) diagram. In Fig. 3 we overplotted the BT-Settl models (Allard et al., 2012) for the UKIDSS filter set (Hewett et al., 2006) although our survey uses the VISTA filters. However, those three VISTA filters are identical to the filters installed on UKIRT/WFCAM at the 1% level 555http://apm49.ast.cam.ac.uk/surveys-projects/vista/technical/filter-set.
4.3 Improving the photometric selection
In this section we improve on our three-band photometric selection using proper motions and near-infrared photometry and proper motions from the UKIDSS GCS DR10 to confirm (or otherwise) photometric candidates identified in the previous section.
We selected point sources brighter than = 18.5 mag whose errors on the proper motions are within 4 of the mean USco proper motion (i.e. more than 99.99% completeness), centered at (6, 20) mas/yr. Fainter sources were kept because they will be fainter in UKIDSS than VISTA, yielding large errors on the source centroid. This selection yielded 6617 = 83 candidates.
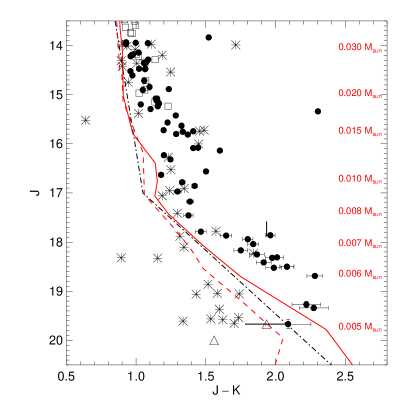
Second, we took advantage of the additional - and -band imaging from the UKIDSS GCS DR10 to improve on our photometric and astrometric selections. The (,) and (,) diagrams involving and photometry from VISTA and photometry from GCS DR10 are displayed in Fig. 3. We applied the following photometric cuts (dot-dashed lines in Fig. 3):
-
•
(,) = (2.0,15.0) to (5.0,23.5)
-
•
(,) = (0.85,13.5) to (1.05,17.0)
-
•
(,) = (1.05,13.5) to (2.9,20.5)
This selection returned 67 candidates (Table 2), which represent our final sample of bona-fide USco members in 13.5 square degrees down to a depth of = 20.5 mag, corresponding to 5 MJup according to the BT-Settl models at 5 Myr (Allard et al., 2012). We plot these new members as filled dots in the colour-magnitude and colour-colour diagrams displayed in Figs 3 and 4. The candidates classified as photometric and/or astrometric non members are plotted as asterisks in Figs 3–4 and listed in Table 3.
We point out that the BT-Settl models at 5 Myr (or 10 Myr) have trouble reproducing the observed USco sequence in the (,) colour-magnitude diagram below the deuterium-burning limit. Moreover, the predicted colours are too blue, as seen in the (,) diagram (Fig. 3). However, the kink predicted by the models at the deuterium-burning limit is clearly observed in the USco sequence, demonstrating that we are clearly reaching sources with masses in the planetary-mass regime, independently of the inherent uncertainties in the assignment of masses at young ages (Baraffe et al., 2002; Hillenbrand & White, 2004).
4.4 -band drop-outs
We searched for -band drop-outs, selecting all sources lying to the right of a line running from (,) = (1.0, 20.0) to (1.75, 22.0) in that diagram. This query returned 30 candidates. After inspecting the VISTA images, we rejected 25 of them because we can see a detection in the -band images at the position of the object in spite of the magnitude in this passband not being catalogued. The remaining five candidates are listed in Table 4.
We found -band magnitudes from the GCS DR10 for two of five candidates with drop-outs (Table 4). One of them (16:11:48.9221:05:28.6) has two -band measurements (Table 4), indicating a possible intrinsic variability. Its colour span the 1.78–2.09 mag range, placing it close to the 10 Myr isochrone in the (,) diagram but to the blue of the cluster sequence. The other source with a -band detection would be bluer, with = 1.56 mag, suggesting that it not a member unless the sequence turns to the blue if we reach the L/T transition (models predict effective temperatures in the 1400–1200 K range for a 5 MJup object at 5–10 Myr). The other three candidates are undetected in the -band, implying colours bluer than 1.6–1.8 mag assuming a 5 completeness limit of 18.2 mag for the GCS -band depth.
We note that all five candidates lie outside the GTC/OSIRIS coverage discussed in Lodieu et al. (2013). However, we detected two of these five sources in deep Magellan/IMACS data. One candidate (16:13:06.5522:55:32.7, is clearly detected on the IMACS images at 0.145 arcsec from the VISTA detection. We derived a magnitude of 21.878, implying a colour of 2.08 mag (Table 4), placing this object clearly to the blue part of the cluster sequence. Hence, we discard this object as a member of USco. The second candidate (16:12:51.8323:16:50.0) lies in the region of the detector which suffered strong vignetting, yielding large error bar on the photometry. We estimate its magnitude to 21.98–22.68, implying a colour in the 2.14–2.79 mag (Table 4). This object also lies to the blue of the cluster sequence but we cannot fully discard it until we obtain a better estimate of its magnitude. At this stage, we are unable to discard the other candidates because they could be L/T transition members in USco: deeper optical imaging and near-infrared spectroscopy can confirm this argument as well as their nature.

.
| R.A. | Dec. | err | err | err | err | 1 err | 2 err | err | err |
|---|---|---|---|---|---|---|---|---|---|
| 15:59:36.38 | 22:14:15.9 | 19.5230.014 | 18.2100.013 | 16.9700.009 | 16.3410.028 | 15.6720.024 | 15.6380.015 | 0.05 8.58 | 19.40 8.58 |
| 15:59:48.01 | 22:27:16.5 | 15.8990.002 | 14.9190.002 | 14.1440.001 | 13.6100.003 | 13.1250.003 | 13.1470.002 | 1.48 6.83 | 14.09 6.83 |
| … | … | … | … | … | … | … | … | … | … |
| 16:17:00.53 | 22:12:53.9 | 18.1700.007 | 16.7780.004 | 15.7540.004 | 15.0840.008 | 14.4190.007 | 14.4680.005 | 2.37 6.99 | 24.16 6.99 |
| 16:17:02.61 | 20:54:49.4 | 15.5480.002 | 14.6730.001 | 13.9340.001 | 13.4400.003 | 13.0050.003 | 13.0020.002 | 3.39 4.44 | 18.62 4.44 |
| R.A. | Dec. | err | err | err | err | 1 err | 2 err | err | err |
|---|---|---|---|---|---|---|---|---|---|
| 15:59:37.56 | 22:54:16.3 | 16.3380.003 | 15.1660.002 | 14.1950.001 | 13.5540.003 | 13.0070.002 | 13.0110.002 | 225.61 6.82 | 214.84 6.82 |
| 15:59:57.99 | 21:54:22.4 | 22.4100.159 | 20.9030.109 | 19.4290.074 | 19.4270.331 | 18.9630.385 | 17.8480.126 | 40.79 9.66 | 29.17 9.66 |
| … | … | … | … | … | … | … | … | … | … |
| 16:18:25.46 | 23:40:53.5 | 17.7970.007 | 16.9150.005 | 16.0020.004 | 15.0510.007 | 14.5530.008 | 14.5250.006 | 11.99 2.27 | 19.74 2.27 |
| 16:18:25.65 | 23:42:45.4 | 15.2780.002 | 14.6980.001 | 13.9710.001 | 13.2230.002 | 12.8610.002 | 12.8670.002 | 3.73 2.19 | 1.63 2.19 |
| R.A. | Dec. | err | err | err |
|---|---|---|---|---|
| hh:mm:ss.ss | ∘:′:′′ | mag | mag | mag |
| 16:11:48.92 | 21:05:28.6 | 21.1730.152 | 19.6690.096 | 17.8870.108a |
| 16:13:06.55 | 22:55:32.7 | 21.3030.155 | 19.7980.090 | 18.2b |
| 16:12:51.83 | 23:16:50.0 | 21.4370.203 | 19.8380.095 | 18.2c |
| 16:16:21.04 | 23:55:20.1 | 21.6240.241 | 19.9980.109 | 18.4380.167 |
| 16:10:27.63 | 23:05:54.3 | 21.7670.438 | 20.0040.145 | 18.2 |
5 Discussion on the mass function
Before looking at the shape of the USco mass function in the planetary-mass regime, we discuss the mass estimates and place our work into context.
Masses at young ages (10 Myr) are difficult to measure and can be very uncertain (Baraffe et al., 2002) and depend also on the models considered during the analysis (Hillenbrand & White, 2004). The lack of spectroscopy for the lowest and youngest brown dwarf candidates identified photometrically to date in star-forming regions and clusters hampers our ability to estimate masses accurately. To estimate the depth of our VISTA survey, we rely on the latest BT-Settl models (Allard et al., 2012), assuming a distance of 145 pc and ages of 5 and 10 Myr for USco. According to these models, a 5 MJup brown dwarf with an effective temperature of 1400–1200 K in USco has apparent magnitudes of 23.1–23.9 mag, 21.4–22.1 mag, and 19.8–20.6 mag, respectively (depending on the age chosen). These -band values are consistent with our 100% completeness limit so we are sensitive to 5 MJup brown dwarfs in USco. However, the - and -band magnitude of a 5 MJup brown dwarf in USco are fainter than our completeness limits, implying that we are complete down to 6 MJup ( = 20.16 mag and = 21.79 mag).
In terms of magnitude, our survey is shallower than the deep VISTA survey in Orionis ( = 21 mag vs 20.5 mag) by Peña Ramírez et al. (2012). However, both surveys have very similar depths in terms of mass because Ori is further away than USco (352 pc vs 145 pc), resulting in a 5 MJup having = 20.53 mag in Ori and = 20.57 Myr for USco, assuming 10 Myr ( = 19.77 mag at 5 Myr in USco). The coolest spectroscopically-confirmed member of Ori, sOri 65 ( = 21.10.1; = 20.30.1 mag; L3.5; Zapatero Osorio et al., 2000; Sherry et al., 2004; Scholz & Jayawardhana, 2008; Peña Ramírez et al., 2012) is close to our 100% completeness so we predict that our VISTA survey is sensitive to mid-L dwarfs in USco, considering the similarities between both surveys. Nonetheless, we cannot discard that we are sensitive to L/T transition objects because of the similar apparent magnitudes observed for field brown dwarfs across the mid-L to mid-T regime (e.g. Leggett et al., 2010).
To address the shape of the USco mass function in the planetary-mass regime (Salpeter, 1955; Miller & Scalo, 1979; Scalo, 1986), we divided our sample into two mass bins of equal size in a logarithmic scale. We counted the number of candidates in the 20–10 MJup and 10–5 MJup bins, resulting in a ratio of 24/22 = 1.09 (27/16 = 1.69), respectively, using the -band filter and assuming an age of 5 Myr for USco (values in brackets are for 10 Myr). If we consider the -band filter instead, the ratios become 25/21 = 1.19 (5 Myr) and 30/16 = 1.88 (10 Myr), respectively. These ratios are upper limits because our survey is complete down to 6 MJup and incomplete in the 6–5 MJup interval. Therefore, we conclude that the USco mass function is more likely to decrease in the planetary-mass regime although a flat mass function cannot be discarded for an age of 5 Myr until proper motions or near-infrared spectroscopy is obtained for all candidates. Our conclusions agree with the possible turn-over of the mass function in the planetary-mass regime observed in Ori (Peña Ramírez et al., 2012) and NGC 1333 (Scholz et al., 2012) but at odds with the rising mass function seen in Oph (Marsh et al., 2010; Barsony et al., 2012).
Our future goal would be to reach 1 MJup to test the various theoretical models proposing discrepant minimum masses: self-gravitating disk fragmentation or gravitationally unstable disks lead to minimum masses of 3–5 MJup whereas fragmentation of a shock-compressed layer suggests minimum masses below 3 MJup, in agreement with the original prediction by Kumar (1969). The latest evolutionary BT-Settl models predict absolute magnitudes 1.5 to 2 mag fainter for a 3 MJup compared to a 5 MJup brown dwarfs at 5 or 10 Myr, consistent with differences predicted by the COND models (Baraffe et al., 2002). Similarly, the COND models predict that a 1 MJup object in USco would be 3 mag fainter than a 3 MJup in , implying that we would need a survey down to 25 mag, depth very difficult to achieve from the ground over a wide area (at least six square degrees are needed for statistical purposes)666The 5-year UltraVISTA public survey aims at reaching 5 depths of 26 mag, 25.5 mag in the Vega system over 1.5 square degrees (McCracken et al., 2012). Although not ideal for large-scale surveys, near and mid-infrared capabilities of the James Webb Space Telescope seem the only option to address the issue of the fragmentation limit by the end of the decade.
Acknowledgments
NL was funded by the Ramón y Cajal fellowship number 08-303-01-02 and the national program AYA2010-19136 funded by the Spanish ministry of Science and Innovation.
This work is based on observations made with the ESO VISTA telescope at the Paranal Observatory under programme ID 089.C-0102(ABC) in service mode and in visitor mode with the 6.5-m Magellan telescope at Las Campanas Observatory Carnegie Institution of Washington.
This work is based in part on data obtained as part of the UKIRT Infrared Deep Sky Survey (UKIDSS). We thank our colleagues at the UK Astronomy Technology Centre, the Joint Astronomy Centre in Hawaii, the Cambridge Astronomical Survey and Edinburgh Wide Field Astronomy Units for building and operating WFCAM and its associated data flow system.
This research has made use of the Simbad and Vizier (Ochsenbein et al., 2000) databases, operated at the Centre de Données Astronomiques de Strasbourg (CDS), and of NASA’s Astrophysics Data System Bibliographic Services (ADS).
References
- Allard et al. (2012) Allard F., Homeier D., Freytag B., 2012, Royal Society of London Philosophical Transactions Series A, 370, 2765
- Alves de Oliveira et al. (2012) Alves de Oliveira C., Moraux E., Bouvier J., Bouy H., 2012, A&A, 539, A151
- Alves de Oliveira et al. (2013) Alves de Oliveira C., Moraux E., Bouvier J., Duchêne G., Bouy H., Maschberger T., Hudelot P., 2013, A&A, 549, A123
- Ardila et al. (2000) Ardila D., Martín E., Basri G., 2000, AJ, 120, 479
- Baraffe et al. (1998) Baraffe I., Chabrier G., Allard F., Hauschildt P. H., 1998, A&A, 337, 403
- Baraffe et al. (2002) Baraffe I., Chabrier G., Allard F., Hauschildt P. H., 2002, A&A, 382, 563
- Barrado y Navascués et al. (2001) Barrado y Navascués D., Zapatero Osorio M. R., Béjar V. J. S., Rebolo R., Martín E. L., Mundt R., Bailer-Jones C. A. L., 2001, A&A, 377, L9
- Barsony et al. (2012) Barsony M., Haisch K. E., Marsh K. A., McCarthy C., 2012, ApJ, 751, 22
- Basri et al. (2000) Basri G., Mohanty S., Allard F., Hauschildt P. H., Delfosse X., Martín E. L., Forveille T., Goldman B., 2000, ApJ, 538, 363
- Bastian et al. (2010) Bastian N., Covey K. R., Meyer M. R., 2010, ARA&A, 48, 339
- Bihain et al. (2009) Bihain G., et al. 2009, A&A, 506, 1169
- Boss (1988) Boss A. P., 1988, ApJ, 331, 370
- Boudreault & Lodieu (2013) Boudreault S., Lodieu N., 2013, MNRAS
- Bouvier et al. (2008) Bouvier J., et al. 2008, A&A, 481, 661
- Boyd & Whitworth (2005) Boyd D. F. A., Whitworth A. P., 2005, A&A, 430, 1059
- Burgasser et al. (2006) Burgasser A. J., Geballe T. R., Leggett S. K., Kirkpatrick J. D., Golimowski D. A., 2006, ApJ, 637, 1067
- Burgess et al. (2009) Burgess A. S. M., Moraux E., Bouvier J., Marmo C., Albert L., Bouy H., 2009, A&A, 508, 823
- Caballero et al. (2007) Caballero J. A., et al. 2007, A&A, 470, 903
- Casali et al. (2007) Casali M., et al. 2007, A&A, 467, 777
- Casewell et al. (2007) Casewell S. L., Dobbie P. D., Hodgkin S. T., Moraux E., Jameson R. F., Hambly N. C., Irwin J., Lodieu N., 2007, MNRAS, 378, 1131
- Chabrier (2003) Chabrier G., 2003, PASP, 115, 763
- Chabrier (2005) Chabrier G., 2005, in E. Corbelli, F. Palla, & H. Zinnecker ed., The Initial Mass Function 50 Years Later Vol. 327 of Astrophysics and Space Science Library, The Initial Mass Function: from Salpeter 1955 to 2005. p. 41
- Chabrier et al. (2000) Chabrier G., Baraffe I., Allard F., Hauschildt P., 2000, ApJ, 542, 464
- Collins & Hambly (2012) Collins R., Hambly N., 2012, in ”Ballester P., Egret D., eds, Astronomical Data Analysis Software and Systems XXI Vol. in press, of Astronomical Society of the Pacific Conference Series, Calculating proper motions in the WFCAM Science Archive for the UKIRT Infrared Deep Sky Surveys
- Cross et al. (2012) Cross N. J. G., et al. 2012, A&A, 548, A119
- Cutri et al. (2003) Cutri R. M., et al. 2003, 2MASS All Sky Catalog of point sources, 2246
- Dalton et al. (2006) Dalton G. B., et al. 2006, in Society of Photo-Optical Instrumentation Engineers (SPIE) Conference Series Vol. 6269 of Presented at the Society of Photo-Optical Instrumentation Engineers (SPIE) Conference, The VISTA infrared camera
- Dawson et al. (2011) Dawson P., Scholz A., Ray T. P., 2011, A&A
- Dawson et al. (2012) Dawson P., Scholz A., Ray T. P., Marsh K. A., Wood K., Natta A., Padgett D., Ressler M. E., 2012, MNRAS
- de Bruijne et al. (1997) de Bruijne J. H. J., Hoogerwerf R., Brown A. G. A., Aguilar L. A., de Zeeuw P. T., 1997, in ESA SP-402: Hipparcos - Venice ’97 Improved Methods for Identifying Moving Groups. pp 575–578
- de Zeeuw et al. (1999) de Zeeuw P. T., Hoogerwerf R., de Bruijne J. H. J., Brown A. G. A., Blaauw A., 1999, AJ, 117, 354
- Dye et al. (2006) Dye S., et al. 2006, MNRAS, 372, 1227
- Emerson (2001) Emerson J. P., 2001, in R. Clowes, A. Adamson, & G. Bromage ed., The New Era of Wide Field Astronomy Vol. 232 of Astronomical Society of the Pacific Conference Series, VISTA - Project Status of the Visible and Infrared Survey Telescope for Astronomy.. p. 339
- Emerson et al. (2004) Emerson J. P., Sutherland W. J., McPherson A. M., Craig S. C., Dalton G. B., Ward A. K., 2004, The Messenger, 117, 27
- Forgan & Rice (2011) Forgan D., Rice K., 2011, MNRAS, 417, 1928
- Fossati et al. (2008) Fossati L., Bagnulo S., Landstreet J., Wade G., Kochukhov O., Monier R., Weiss W., Gebran M., 2008, A&A, 483, 891
- Hambly et al. (2008) Hambly N. C., et al. 2008, MNRAS, 384, 637
- Hambly et al. (2001) Hambly N. C., et al. 2001, MNRAS, 326, 1279
- Hewett et al. (2006) Hewett P. C., Warren S. J., Leggett S. K., Hodgkin S. T., 2006, MNRAS, 367, 454
- Hillenbrand & White (2004) Hillenbrand L. A., White R. J., 2004, ApJ, 604, 741
- Hodgkin et al. (2009) Hodgkin S. T., Irwin M. J., Hewett P. C., Warren S. J., 2009, MNRAS, 394, 675
- Hogan et al. (2008) Hogan E., Jameson R. F., Casewell S. L., Osbourne S. L., Hambly N. C., 2008, MNRAS, 388, 495
- Irwin & Lewis (2001) Irwin M., Lewis J., 2001, New Astronomy Review, 45, 105
- Irwin et al. (2004) Irwin M. J., et al. 2004, in Quinn P. J., Bridger A., eds, Optimizing Scientific Return for Astronomy through Information Technologies. Edited by Quinn, Peter J.; Bridger, Alan. Proceedings of the SPIE, Volume 5493, pp. 411-422 (2004). VISTA data flow system: pipeline processing for WFCAM and VISTA. pp 411–422
- Kirkpatrick (2005) Kirkpatrick J. D., 2005, ARA&A, 43, 195
- Kroupa (2002) Kroupa P., 2002, Science, 295, 82
- Kumar (1969) Kumar S. S., 1969, in Kumar S. S., ed., Low-Luminosity Stars The nature of low-mass ’dark’ companions. p. 255
- Kunkel (1999) Kunkel M., 1999, Ph.D. Thesis, Julius-Maximilians-Universität Würzburg
- Lawrence et al. (2007) Lawrence A., et al. 2007, MNRAS, 379, 1599
- Leggett et al. (2010) Leggett S. K., et al. 2010, ApJ, 710, 1627
- Leggett et al. (2000) Leggett S. K., et al. 2000, ApJL, 536, L35
- Lodieu (2013) Lodieu N., 2013, MNRAS
- Lodieu et al. (2012) Lodieu N., Deacon N. R., Hambly N. C., 2012, MNRAS, p. 2699
- Lodieu et al. (2011) Lodieu N., Dobbie P. D., Hambly N. C., 2011, A&A, 527, A24
- Lodieu et al. (2011) Lodieu N., Hambly N. C., Dobbie P. D., Cross N. J. G., Christensen L., Martin E. L., Valdivielso L., 2011, MNRAS, 418, 2604
- Lodieu et al. (2006) Lodieu N., Hambly N. C., Jameson R. F., 2006, MNRAS, 373, 95
- Lodieu et al. (2007) Lodieu N., Hambly N. C., Jameson R. F., Hodgkin S. T., Carraro G., Kendall T. R., 2007, MNRAS, 374, 372
- Lodieu et al. (2013) Lodieu N., Ivanov V. D., Dobbie P. D., 2013, MNRAS, 430, 1784
- Low & Lynden-Bell (1976) Low C., Lynden-Bell D., 1976, MNRAS, 176, 367
- Marsh et al. (2010) Marsh K. A., Plavchan P., Kirkpatrick J. D., Lowrance P. J., Cutri R. M., Velusamy T., 2010, ApJ, 719, 550
- Martín et al. (2004) Martín E. L., Delfosse X., Guieu S., 2004, AJ, 127, 449
- Martín et al. (2001) Martín E. L., Zapatero Osorio M. R., Barrado y Navascués D., Béjar V. J. S., Rebolo R., 2001, ApJL, 558, L117
- McCracken et al. (2012) McCracken H. J., et al. 2012, A&A, 544, A156
- Miller & Scalo (1979) Miller G. E., Scalo J. M., 1979, ApJS, 41, 513
- Ochsenbein et al. (2000) Ochsenbein F., Bauer P., Marcout J., 2000, A&AS, 143, 23
- Peña Ramírez et al. (2012) Peña Ramírez K., Béjar V. J. S., Zapatero Osorio M. R., Petr-Gotzens M. G., Martín E. L., 2012, ApJ, 754, 30
- Peña Ramírez et al. (2011) Peña Ramírez K., Zapatero Osorio M. R., Béjar V. J. S., Rebolo R., Bihain G., 2011, A&A, 532, A42
- Pecaut et al. (2012) Pecaut M. J., Mamajek E. E., Bubar E. J., 2012, ApJ, 746, 154
- Perryman et al. (1998) Perryman M. A. C., et al. 1998, A&A, 331, 81
- Preibisch et al. (1998) Preibisch T., Guenther E., Zinnecker H., Sterzik M., Frink S., Roeser S., 1998, A&A, 333, 619
- Preibisch & Zinnecker (1999) Preibisch T., Zinnecker H., 1999, AJ, 117, 2381
- Preibisch & Zinnecker (2002) Preibisch T., Zinnecker H., 2002, AJ, 123, 1613
- Rees (1976) Rees M. J., 1976, MNRAS, 176, 483
- Rogers & Wadsley (2012) Rogers P. D., Wadsley J., 2012, MNRAS, 423, 1896
- Salpeter (1955) Salpeter E. E., 1955, ApJ, 121, 161
- Scalo (1986) Scalo J. M., 1986, Fundamentals of Cosmic Physics, 11, 1
- Scholz & Jayawardhana (2008) Scholz A., Jayawardhana R., 2008, ApJL, 672, L49
- Scholz et al. (2012) Scholz A., Jayawardhana R., Muzic K., Geers V., Tamura M., Tanaka I., 2012, ApJ, 756, 24
- Sherry et al. (2004) Sherry W. H., Walter F. M., Wolk S. J., 2004, AJ, 128, 2316
- Silk (1977) Silk J., 1977, ApJ, 214, 152
- Skrutskie et al. (2006) Skrutskie M. F., et al. 2006, AJ, 131, 1163
- Slesnick et al. (2006) Slesnick C. L., Carpenter J. M., Hillenbrand L. A., 2006, AJ, 131, 3016
- Slesnick et al. (2008) Slesnick C. L., Hillenbrand L. A., Carpenter J. M., 2008, ApJ, 688, 377
- Song et al. (2012) Song I., Zuckerman B., Bessell M. S., 2012, AJ, 144, 8
- Spezzi et al. (2012) Spezzi L., Alves de Oliveira C., Moraux E., Bouvier J., Winston E., Hudelot P., Bouy H., Cuillandre J.-C., 2012, A&A, 545, A105
- Stauffer et al. (1998) Stauffer J. R., Schultz G., Kirkpatrick J. D., 1998, ApJL, 499, 219
- Walter et al. (1994) Walter F. M., Vrba F. J., Mathieu R. D., Brown A., Myers P. C., 1994, AJ, 107, 692
- Whitworth & Stamatellos (2006) Whitworth A. P., Stamatellos D., 2006, A&A, 458, 817
- Zapatero Osorio et al. (2000) Zapatero Osorio M. R., Béjar V. J. S., Martín E. L., Rebolo R., Barrado y Navascués D., Bailer-Jones C. A. L., Mundt R., 2000, Science, 290, 103