Density dependence of the symmetry energy from neutron skin thickness in finite nuclei
Abstract
The density dependence of the symmetry energy around saturation density, characterized by the slope parameter , is studied using information provided by the neutron skin thickness in finite nuclei. An estimate for is obtained from experimental data on neutron skins extracted from antiprotonic atoms. We also discuss the ability of parity-violating elastic electron scattering to obtain information on the neutron skin thickness in 208Pb and to constrain the density dependence of the nuclear symmetry energy. The size and shape of the neutron density distribution of 208Pb predicted by mean-field models is briefly addressed. We conclude with a comparative overview of the values predicted by several existing determinations.
pacs:
21.10.Gv, 21.65.Ef, 21.60.-n, 25.30.Bf, 26.60.-cSymmetry energy. Neutron density. Neutron skin thickness. Parity-violating electron scattering.1 Introduction
The nuclear symmetry energy is a fundamental quantity in nuclear physics and astrophysics because it governs important properties of very small entities like atomic nuclei ( m) and of very large objects like neutron stars ( m) Steiner et al. (2005). The symmetry energy represents the energy cost per particle of changing all the protons into neutrons in symmetric nuclear matter. In nuclear physics the symmetry energy has important consequences for studies of the neutron distribution in stable and exotic nuclei Alex Brown (2000); Typel and Brown (2001); Furnstahl (2002); Horowitz and Piekarewicz (2001); Todd-Rutel and Piekarewicz (2005); Dieperink et al. (2003); Steiner and Li (2005); Gaidarov et al. (2012), heavy-ion collisions (HIC) Khoa et al. (1996); Gaitanos et al. (2004); Baran et al. (2005); Li et al. (2008); Shetty et al. (2007); Famiano et al. (2006); Tsang et al. (2009), giant and pygmy resonances Trippa et al. (2008); Klimkiewicz et al. (2007); Roca-Maza et al. (2012); Carbone et al. (2010); Roca-Maza et al. (2013a), etc. The symmetry energy is also relevant for some aspects of fundamental physics because it has implications for atomic parity non-conserving observables involved in low-energy tests of the Standard Model and new physics Guéna et al. (2005); Sil et al. (2005). In astrophysics the symmetry energy is very important for understanding different properties of neutron stars, supernova explosions, and stellar nucleosynthesis Steiner et al. (2005); Lattimer and Prakash (2007); Klähn et al. (2006); Loan et al. (2011).
The Equation of State (EOS) in asymmetric nuclear matter can be expressed as
| (1) |
where is the total nucleon density and defines the relative asymmetry parameter. In Eq. (1), is the energy per particle in asymmetric nuclear matter and is the symmetry energy which is defined as
| (2) |
To a good accuracy can be estimated as the difference between the EOS of pure neutron matter and symmetric nuclear matter, i.e.,
| (3) |
It is both common and insightful to expand the EOS of asymmetric nuclear matter around the saturation density using a few meaningful bulk parameters, as in
| (4) |
and
| (5) |
where the density shift is defined as . The energy per particle and incompressibility in symmetric nuclear matter at saturation density fm-3 are well constrained by the measured data on densities, masses and collective excitations of nuclei. They are around MeV and MeV Dutra et al. (2012). The symmetry energy coefficient is defined as . Experimental informations from nuclear masses, heavy-ion reactions, giant resonances, and observational properties of neutron stars, constrain in a range between 30 and 35 MeV Tsang et al. (2012); Lattimer and Lim (2013). These values are, in general, predicted also by successful nuclear mean-field models.
However, the density dependence of the symmetry energy, characterized by the parameters
| (6) |
and
| (7) |
is much less certain and the predicted values differ largely among different nuclear models (see e.g. Ref. Li et al. (2008)). This is a consequence of the fact that data of stable nuclei, used in the fits of the parameters of the models, do not constrain in a very precise way the isovector sector of the effective nuclear interaction. The value predicted by successful mean-field models covers a wide range roughly between 20 MeV and 120 MeV. To extract this quantity from available experimental data is not an easy task and usually some model assumptions have to be made in order to connect the data with the parameter .
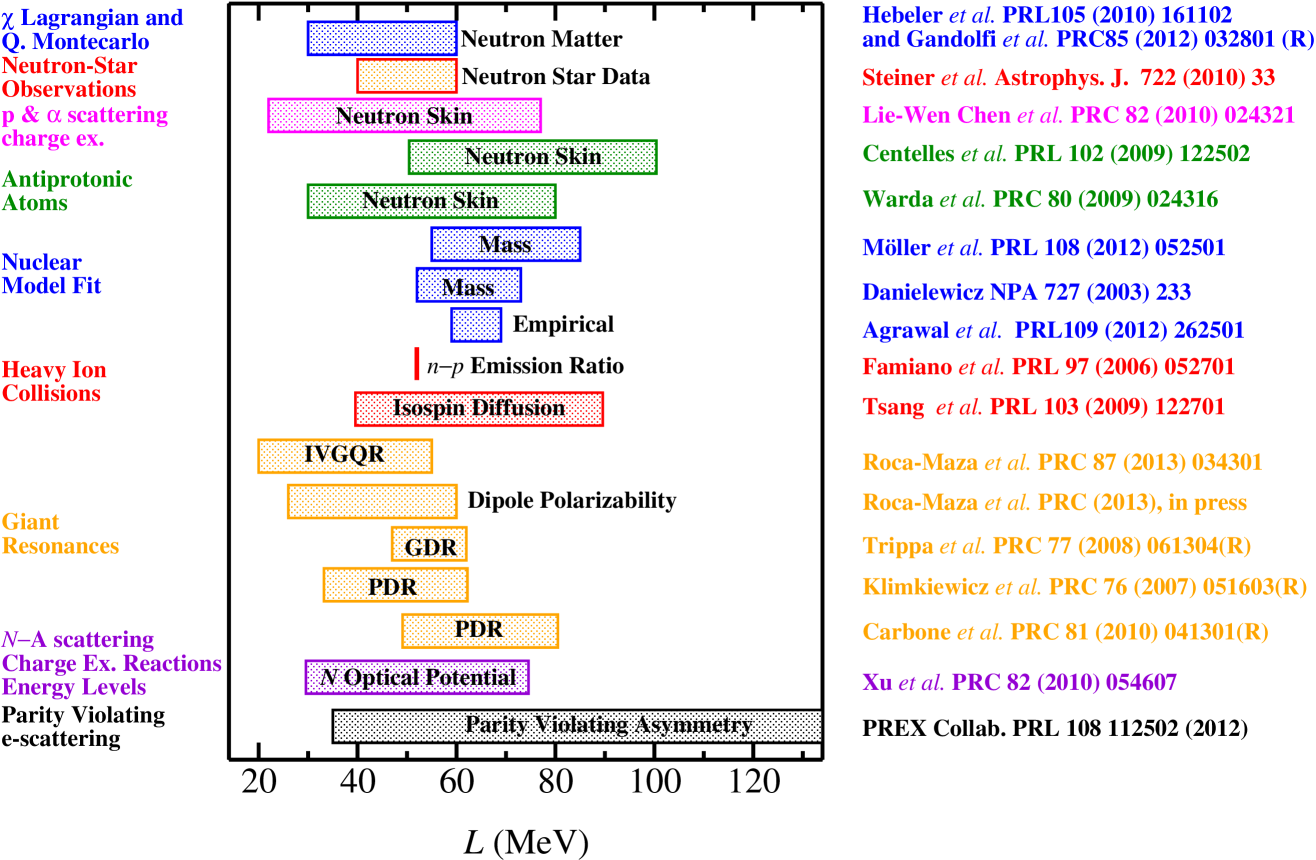
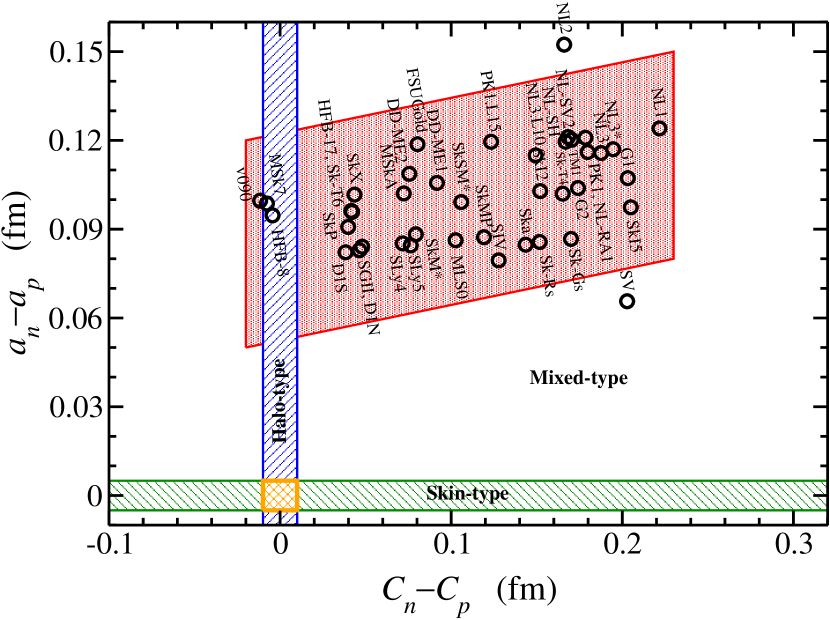
A sample of different experimental results and theoretical calculations used to estimate is displayed in Fig. 1. We will overview them in some more detail later in Section 5. For in-depth accounts of several of the methods and determinations shown in Fig. 1, see the related contributions in the present volume (also see Refs. Tsang et al. (2012); Lattimer and Lim (2013)). Fig. 1 illustrates that although very different observables and methods have been used to extract and different values have been obtained, there is a common range, approximately between 45 and 70 MeV, where the different estimates of have a large overlap. Such a range can be considered as a reliable estimate of the parameter. This range of values agrees also with the range reported in Ref. Dutra et al. (2012).
On the basis of our findings in recent years Centelles et al. (2009); Warda et al. (2009, 2010); Centelles et al. (2010); Roca-Maza et al. (2011), in the next sections we will discuss two of these estimates of the parameter. Namely, we will study the constraints that can be derived from the analysis of neutron skins in antiprotonic atoms, and the constraints that may be provided by parity-violating elastic electron scattering in a heavy neutron-rich nucleus such as 208Pb. We also discuss the size and shape of the neutron density distribution of 208Pb predicted by mean-field models and its dependence with the symmetry energy. A summary and outlook are given to conclude the paper.
2 Insights into the neutron skin thickness from the nuclear droplet model
2.1 Theory
The neutron skin thickness (NST) of a nucleus is conventionally defined as the difference between the neutron and proton rms radii of the nucleus:
| (8) |
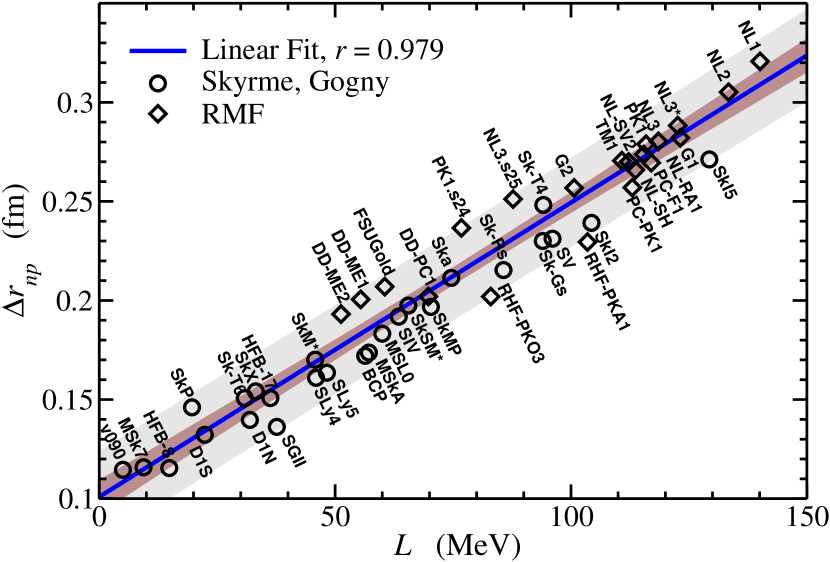
It is known from almost fifteen years ago that in a heavy nucleus such as 208Pb the NST calculated with successful mean-field models that reproduce the binding energy and charge radius of this nucleus is linearly correlated with the slope of the symmetry energy at saturation computed with the same model Alex Brown (2000); Typel and Brown (2001); Furnstahl (2002). This correlation can be clearly seen in Fig. 2, where Hartree-Fock or Hartree calculations of the NST of 208Pb with different Skyrme, Gogny and relativistic mean-field models is displayed as a function of the parameter defined in Eq. (6), which is proportional to the slope of the symmetry energy at saturation. The linear fit of the results of Fig. 2 gives
| (9) |
Information about the models of the figure is provided in Section 3.2.
A possible explanation of the correlation between and on the basis of the nuclear Droplet Model (DM) Myers and Swiatecki (1969, 1974); Myers (1977) has been reported in Ref. Centelles et al. (2009). In the DM, the symmetry energy coefficient of a nucleus with mass number is obtained as Myers and Swiatecki (1969, 1974); Myers (1977)
| (10) |
where is the bulk symmetry energy coefficient defined previously. The corresponding symmetry energy contribution to a finite nucleus is given by Myers and Swiatecki (1969, 1974); Myers (1977)
| (11) |
where is the overall relative neutron excess. The quantity , where is the nuclear radius, is a correction due to the Coulomb interaction Myers and Swiatecki (1969, 1974); Myers (1977).
The coefficient of Eq. (10) is called the surface stiffness coefficient. It measures the resistance of neutrons against separation from protons to form the neutron skin. In the context of the DM and under the assumption that a finite nucleus is a leptodermous finite Fermi system, having a wide bulk part and a narrow surface region where the density rapidly drops to zero, nuclear surface properties such as e.g. the coefficient can be extracted from semi-infinite nuclear matter calculations Myers and Swiatecki (1969, 1974); Myers (1977); Farine et al. (1981); Brack et al. (1985); Kolehmainen et al. (1985); Treiner and Krivine (1986). The semi-infinite geometry is free of finite-size effects, Coulomb, and shell effects. Quantal or semiclassical extended Thomas-Fermi (ETF) calculations of asymmetric semi-infinite nuclear matter (ASINM) can be performed to compute Farine et al. (1981); Brack et al. (1985); Kolehmainen et al. (1985); Treiner and Krivine (1986); Centelles et al. (1998); Estal et al. (1999). Here we perform ETF calculations of ASINM, since the semiclassical ETF method does not present Friedel oscillations found in the densities of a Hartree-Fock or Hartree calculation of ASINM Centelles and nas (1993); Danielewicz and Lee (2009). A semiclassical approach does not have quantal shell effects and hence is consistent with the DM concept of an average description of nuclear properties Brack et al. (1985). Details of our ETF calculations are given in Centelles et al. (1998) and in the appendix of Warda et al. (2009). For a comparison of some DM predictions against self-consistent ETF results in finite nuclei, see Section 2.3 below.
A link between finite nuclei observables, described by the DM, and certain quantities such as and that define the EOS in nuclear matter around saturation, may be obtained from the following empirical consideration Centelles et al. (2009); Warda et al. (2009). The DM symmetry energy coefficient of a heavy nucleus like 208Pb equals the value of the symmetry energy in infinite matter at a subsaturation density near 0.1 fm-3 when computed in mean-field models. More recently, this relation has been discussed by Liu et al. from measured nuclear masses Liu et al. (2010), by Chen et al. in the Skyrme-Hartree-Fock theory Chen (2011); Zhang and Chen (2013), and by Dong et al. in a variety of mean-field interactions Dong et al. (2012, 2013). For several nuclear models, we display in Table 1 the bulk symmetry energy coefficient , the DM symmetry energy coefficient (10), and the value of the density that fulfils for . Of course, though it is around 0.1 fm-3, there is a certain variation in the value of where the condition is fullfilled exactly.
| Model | (MeV) | (MeV) | (fm-3) |
|---|---|---|---|
| NL3 | 37.4 | 25.8 | 0.103 |
| NL-SH | 36.1 | 26.0 | 0.105 |
| FSUGold | 32.6 | 25.4 | 0.099 |
| TF | 32.6 | 24.2 | 0.094 |
| SLy4 | 32.0 | 25.3 | 0.100 |
| SkX | 31.1 | 25.7 | 0.103 |
| SkM* | 30.0 | 23.2 | 0.101 |
| SIII | 28.2 | 24.1 | 0.093 |
| SGII | 26.8 | 21.6 | 0.104 |
Within the DM the NST of a nucleus is given by Myers and Swiatecki (1980)
| (12) |
The quantity is the distance between the neutron and proton mean surface locations. The correction is due to the Coulomb interaction, and and are the surface widths of the neutron and proton density profiles. Eq. (12) shows that the NST in a heavy nucleus may be formed by two basic mechanisms. One of them is due to the separation between the neutron and proton mean surfaces, which is a bulk effect. The other way to form the NST is a surface effect due to the fact that the widths of the neutron and proton surfaces may be different.
In the DM the bulk contribution to the NST can be written as
| (13) | |||||
where use is made of Eq.(10) to establish the second equality. From the first equality in (13), it is seen that the leading contribution to in a large nucleus is the term . Thus, the DM suggests a correlation between and in heavy nuclei. The second equality in (13) shows that the DM establishes a direct relation between the surface symmetry energy coefficient and the bulk part of the NST . The standard version of the DM assumes fm Myers and Swiatecki (1969, 1974); Myers (1977). Taking into account the relation between the symmetry energy in infinite matter and the symmetry energy coefficient of a finite nucleus in the DM model ( at a subsaturation density ), we can write
| (14) |
The result explicitly shows the imprint of the density dependence of the symmetry energy on the NST. The leading proportionality in Eq.(14) between the bulk part of the NST and the slope parameter of the symmetry energy , explains the observed correlation of with in a heavy nucleus such as 208Pb Alex Brown (2000); Typel and Brown (2001); Furnstahl (2002); Centelles et al. (2009) displayed in Fig. 2. Regarding Eq. (14) it should be pointed out that the corrective term with has a limited influence on the result as far as is small.
2.2 Constraints from empirical data on the neutron skin thickness from antiprotonic atoms
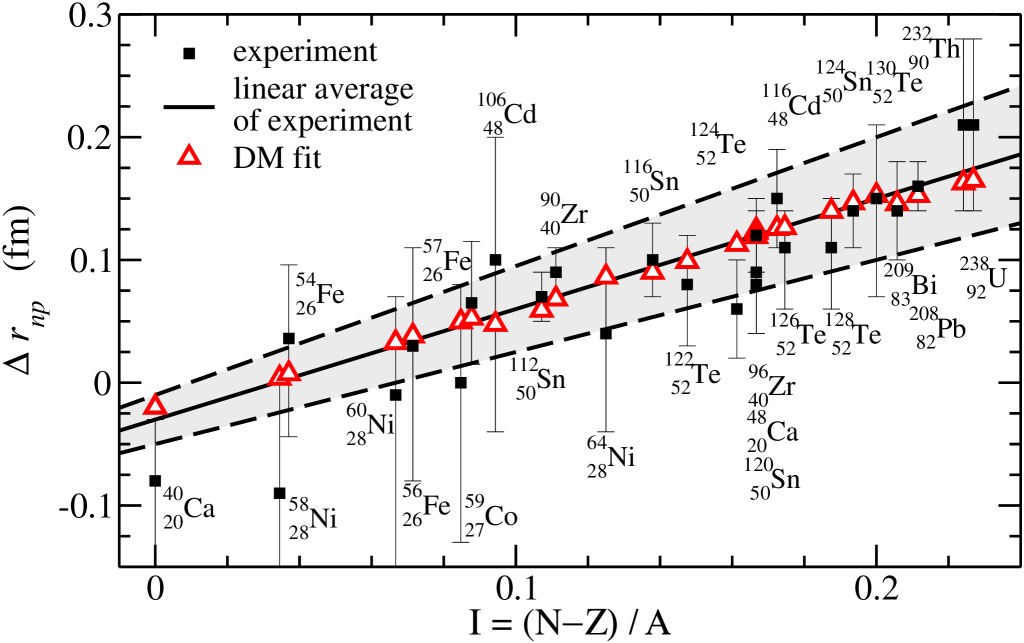
Slow-enough antiprotons can form with an atomic nucleus a hydrogen-like atom. When the antiproton annihilates with a nucleon, pions are produced that may miss the nucleus and a residue is left with a neutron or proton less. From the analysis of the yields, information about the neutron distribution in the nucleus can be derived (cf. Trzcińska et al. (2001); Jastrzȩbski et al. (2004) and references therein). A second method measures antiprotonic X-rays, which allow to find the atomic level widths and shifts due to the strong interaction Trzcińska et al. (2001); Jastrzȩbski et al. (2004); Kłos et al. (2007). Combining the results from the two techniques, the difference between the neutron and proton rms radii can be estimated if the charge density of the nucleus is known Trzcińska et al. (2001); Jastrzȩbski et al. (2004); Kłos et al. (2007). The NST of 26 stable nuclei, ranging from 40Ca to 238U, was extracted from experiments with antiprotons at CERN by Trzcińska et al. Trzcińska et al. (2001); Jastrzȩbski et al. (2004). The data roughly follow a linear trend with the relative neutron excess of the nucleus that can be fitted by Trzcińska et al. (2001); Jastrzȩbski et al. (2004)
| (15) |
It is to be mentioned that the NST values derived from antiprotonic atoms have relatively large uncertainties, as it can be seen in Fig. 2, and sometimes the results deduced from different experiments are not completely concordant with each other Krasznahorkay et al. (2004); Jastrzȩbski et al. (2004). However, the NST data of Refs. Trzcińska et al. (2001); Jastrzȩbski et al. (2004) are the largest available set of values uniformly measured with the same experimental technique all over the periodic table (). Moreover, all of the nuclei are stable isotopes.
We next explore Centelles et al. (2009) the constraints on the density dependence of the symmetry energy by fitting Eq. (12) to the neutron skins measured in Refs. Trzcińska et al. (2001); Jastrzȩbski et al. (2004). To have a large set of skins across the mass table at our avail is very helpful because the result of the fit is driven mainly by the average trend and is less contingent on the data uncertainties. In our fit the explicit dependence of the NST on is provided by Eq. (14). In this analysis we parametrize the symmetry energy as
| (16) |
with the symmetry energy coefficient. This expression has been often used in studies of HIC assuming MeV Chen et al. (2005a, b); Li et al. (2008); Shetty et al. (2007); Famiano et al. (2006). To start with, we set as has been done in the standard DM Myers and Swiatecki (1969, 1974); Myers (1977); Myers and Swiatecki (1980); Świa̧tecki et al. (2005) and in the analysis of data in Ref. Danielewicz (2003). In this way we find MeV () from the fit. The quoted uncertainty is from the window of the linear averages of experiment. The value and its uncertainty obtained from the DM NST formula with a vanishing surface width correction is compatible with the values predicted from isospin diffusion and isoscaling observables in HIC in Refs. Chen et al. (2005a, b); Li et al. (2008); Shetty et al. (2007). In Fig. 3 we display by open triangles the NST predicted by our DM calculation for the 26 nuclei; the results nicely reproduce the average trend of the experimental data.
2.3 Contribution of the nuclear surface to the neutron skin thickness
The results just discussed have been obtained assuming same neutron and proton surface widths (standard version of the DM). However, the analysis of mean-field nucleon densities carried out in Ref. Mizutori et al. (2000) by means of the Helm model, pointed out that the neutron and proton density profiles differ not only in the mean location of their surfaces but also in their surface widths.
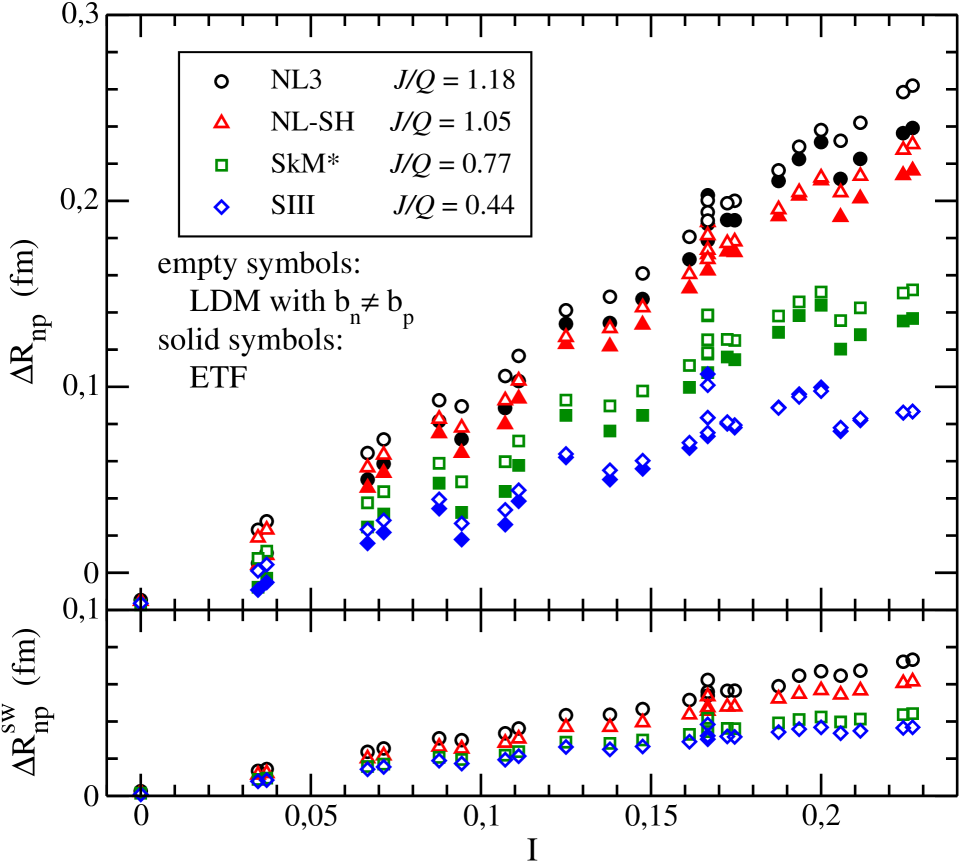
A similar situation occurs when the NST is calculated in the DM including the surface width correction in Eq. (12). First, in Fig. 4 we display by empty symbols the NST predicted by the DM with , for the same nuclei measured in antiprotonic atoms, computed with Eqs. (12) and (13) using the SIII and SkM* Skyrme forces and the NL-SH and NL3 relativistic mean field (RMF) parameter sets. These values are compared in Fig. 4 with the values obtained from self-consistent ETF calculations in finite nuclei Centelles et al. (1990); Centelles and nas (1993) (filled symbols). The reason for comparing DM with ETF instead of with Hartree-Fock or Hartree results, lies on the fact that both, DM and ETF, are free of shell effects that could mask the comparison. We have calculated the ETF values of the NST by using Eq. (8) with the rms radii of the self-consistent ETF neutron and proton densities of each isotope.
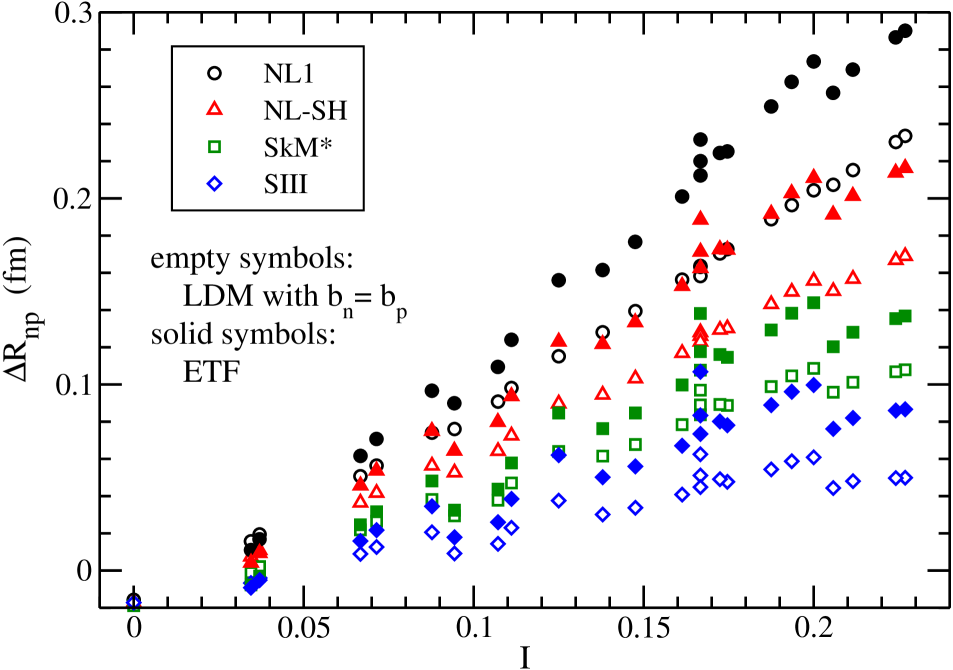
Two conclusions can be underlined from Fig. 4. First, the predictions of the DM with systematically undershoot the ETF values of the NST computed in finite nuclei. Second, for a given nucleus the difference between the ETF value of and the value predicted by the DM with is slightly larger in the RMF parameter sets than in the Skyrme forces. These facts denote that in mean-field models the surface width correction to the DM formula for the NST does not vanish, and that it has some dependence on the value of the ratio.
In order to compute Eq. (12) including the surface width correction, one needs to estimate the values of the and surface widths; we proceed as before and compute and by performing ETF calculations of ASINM Brack et al. (1985); Centelles et al. (1998, 2009); Warda et al. (2009) (see appendix of Warda et al. (2009) for further details). Once and are known, their contribution to the NST is given by (see Eq.(12))
| (17) |
The values of for the nuclei considered in Fig. 4 are displayed in the bottom panel of Fig. 5. We see that shows for each nuclear interaction an increasing linear trend with . We display the DM NST including the correction in the top panel of Fig. 5 by empty symbols. Note that these results correspond to adding , shown in the bottom panel of this figure, to the DM values we have displayed in Fig. 4. We observe in the upper panel of Fig. 5 a quite good agreement between the new DM predictions and the self-consistent ETF values in finite nuclei computed with the same interaction, after including the correction in the DM formula.
The lower panel of Fig. 5 suggests that has, for each nucleus, a certain increasing trend with the ratio. As discussed in more detail in Ref. Warda et al. (2009), it is possible to fit by means of a law , which defines the slope of with respect to . This slope, as a function of the ratio for different interactions, lies inside a band limited by two straight lines, each line corresponding to the equations fm and fm (see Fig. 4 of Ref. Warda et al. (2009)).
In summary, we have shown that to leading order both the bulk part (13) and the surface width term (17) of the DM NST are basically driven by the value of the ratio. This fact suggests to fit the experimental data by means of the following DM inspired ansatz:
| (18) |
where is given by Eq. (13). The second term is the surface width correction parametrized as explained before. With the ansatz (18) we have constrained the ratio by a fit to the skin data in antiprotonic atoms Trzcińska et al. (2001); Jastrzȩbski et al. (2004). Both Eq. (18) and of Eq. (13) depend on the coefficient and the nuclear matter radius . We fix them to the empirical values MeV and fm (the latter corresponds to a saturation density of 0.16 fm-3). We consider fm and fm in Eq. (18) to simulate the upper and lower bounds of the window of the theoretical predictions for in the nuclear mean-field models. More details of the fit can be found in Ref. Warda et al. (2009).
The fits to experiment give with fm and with fm (i.e., a total range ). The quoted uncertainties in correspond to one standard deviation associated with the fit. Both extractions of , for and fm, predict basically the same total values of the NST, which lie close Warda et al. (2009) to the average trend fm Trzcińska et al. (2001); Jastrzȩbski et al. (2004) of the experimental data. However, if one looks at the splitting of the NST into the bulk part and the surface width part , it is different in the two cases.
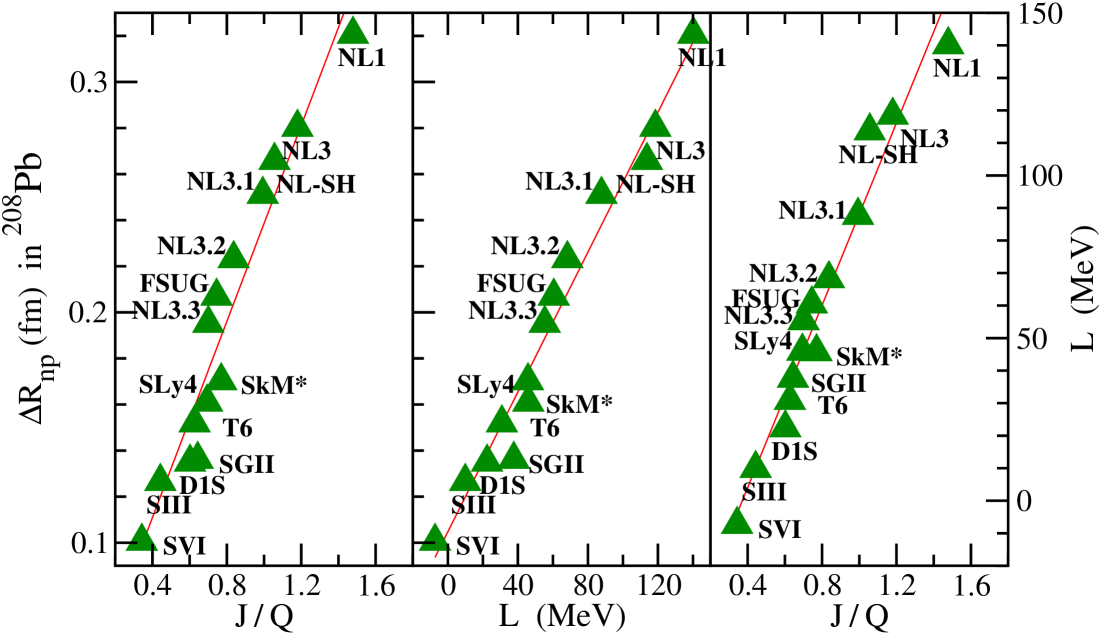
As mentioned, the leading contribution to in large nuclei is the term . Thus, the DM suggests that one can also expect a correlation between and in heavy nuclei. We illustrate this fact in the left panel of Fig. 6. The NST of 208Pb depicted in this figure has been obtained from self-consistent quantal calculations with Skyrme, Gogny, and RMF models Warda et al. (2009). In the same figure the correlation between the NST in 208Pb and the slope of the symmetry energy at saturation , discussed previously, is displayed to illustrate the expected -vs- linear correlation shown in the rightmost panel of Fig. 6. We have checked that a linear fit of against depends rather weakly on the models selected to do the fit. We find that the fit lies in a range between MeV and MeV. Considering this result and the constraint discussed above, we find that is comprised between 31 MeV and 78 MeV. Therefore, our estimate (which takes into account the surface width correction in ) for the parameter basically lies in a range MeV.
3 Parity-violating electron scattering and neutron skin thickness
In the previous section we have studied the constraints on the nuclear symmetry energy that may emerge from consistently measuring the neutron skin thickness in a wide range of nuclei across the mass table with a hadronic probe. The results are very encouraging if improved accuracy could be achieved and, in our opinion, they are supportive of pursuing further systematic experimental determinations of neutron skins with hadronic probes.
In the following, we will address the complementary scenario where one explores the constraints on the nuclear symmetry energy that may be obtained from a high-precision measurement of the neutron skin thickness performed in only one single nucleus (208Pb in our case) by using a leptonic probe.
Indeed, from Fig. 2 we see immediately that the predictions of the nuclear mean-field models for the NST of the heavy neutron-rich nucleus 208Pb vary by almost a factor of 3, and that the slope parameter of the symmetry energy spans more than an order of magnitude between the extreme cases. In spite of such discrepancies, the mean field predictions for and show a strong correlation (which in the previous section we have been able to understand in terms of macroscopic arguments). Thus, an accurate measurement of the NST (or of the neutron radius) of 208Pb, in addition to being of fundamental importance by itself, would provide a unique constraint on the density dependence of the nuclear symmetry energy at saturation. Hence, it may be highly valuable to pursue new experiments to obtain information about the neutron distribution in a heavy nucleus as much as possible free from the uncertainties inherent in the strong interaction.
The Lead Radius Experiment (PREX) collaboration Michaels et al. (2005); Horowitz et al. (2001); Abrahamyan et al. (2012) at the Jefferson Lab has been working with the aforementioned purpose. PREX aims to determine the neutron radius in 208Pb to 1% accuracy by measuring the parity-violating asymmetry () at low momentum transfer in polarized elastic electron scattering performed at a single angle. To reach a 1% accuracy in the neutron radius, the accuracy needed in has been estimated to be of a 3%. The first run of PREX was successfully completed in 2010 and demonstrated the validity of this electroweak technique. The accuracy in , though, was about 9% instead of 3% Abrahamyan et al. (2012) mainly because of limited statistics in the measurement. To attain the 3%-accuracy goal in , a new run PREX-II will be performed Paschke et al. (2012). Recently, the motivations and optimal conditions for measuring the parity violating asymmetry in other nuclei such as 48Ca and 120Sn have been studied in Ref. Ban et al. (2012) and Refs. Liu et al. (2012, 2013). Indeed, a new proposal for performing parity-violating electron scattering (PVES) on 48Ca has been approved at the Jefferson Lab (CREX experiment) Riordan et al. (2013). Moreover, high-precision PVES measurements of neutron radii may become feasible in the future at the new MESA facility in Mainz Sfienti (2013).
For detailed informations on the PREX and CREX experiments and their physics, see the contribution to this volume by Horowitz, Kumar, and Michaels. Here, we summarize some results for completeness. The reported value for from the first run of PREX has been Abrahamyan et al. (2012)
| (19) |
at an average momentum transfer GeV2. Analyzed with some mild model assumptions this value of has been used to extract the following result for the neutron skin thickness in 208Pb Abrahamyan et al. (2012):
| (20) |
A subsequent study has derived the result Horowitz et al. (2012)
| (21) |
where the last uncertainty arises from the uncertainty in the electric strange quark form factor. Both results are much consistent with previous estimates, although the central value is larger than the typical value reported from the existing evidence on of 208Pb Tsang et al. (2012). As mentioned, a new run PREX-II has been scheduled at the Jefferson Lab Paschke et al. (2012) to improve the statistics of the measurement and reach the original 3% accuracy in .
3.1 Theoretical considerations
Electrons can interact with the protons and neutrons of a nucleus by exchanging photons and bosons. Whereas the photons essentially couple to protons, the bosons mostly couple to neutrons. This is due to the fact that the proton weak charge () is very small in comparison with the neutron weak charge (). Namely, (where is the weak mixing angle) Mohr (2011) and . The situation is practically opposite to what happens with the proton and neutron electric charges. Therefore, high-energy elastic electron-nucleus scattering may test not only the electric charge distribution but also the weak charge distribution in a nucleus. The weak interaction introduces a parity-violating term in the scattering amplitude that may be isolated by measuring . Indeed, Donnelly, Dubach and Sick Donnelly et al. (1989) suggested almost 25 years ago that PVES on nuclei could probe the neutron distribution via the electroweak interaction.
The parity-violating asymmetry of ultra-relativistic elastically scattered electrons is defined as the following relative difference Horowitz (1998); Horowitz et al. (2001); Vretenar et al. (2000); Moreno et al. (2010):
| (22) |
where are the elastic electron-nucleus differential cross sections for incident electrons with positive or negative helicity. Depending on their helicity state, electrons interact with the Coulomb () plus the weak () potential or with their difference:
| (23) |
where the weak potential is
| (24) |
with the Fermi constant and the weak charge density.
We solve the scattering problem in the distorted wave Born approximation (DWBA) Roca-Maza et al. (2008, 2011); Centelles et al. (2010) for realistic calculations of the parity violating asymmetry defined in Eq. (22). That is, we perform the exact phase shift analysis of the Dirac equation Salvat et al. (2005); Roca-Maza et al. (2008); Centelles et al. (2010)
| (25) |
for ultra-relativistic electrons. The electric and weak charge distributions of the studied target are the main input for solving Eq. (25). To this end, we use as a benchmark the point-like densities of protons () and neutrons () self-consistently calculated with the nuclear mean-field models shown in Fig. 2. It is to be emphasized that such density distributions are at the core of the nuclear energy density functionals. Thus, in the realm of density functional theory the comparisons against experiment may always be done directly in terms of the calculated .
We obtain the electric charge density distribution of the target nucleus by folding the point-like proton and neutron densities with electromagnetic proton () and neutron () form factors Friedrich and Walcher (2003). For the weak charge density distribution , we fold the point-like densities with the electric form factors for the coupling of the boson to the proton () and the neutron () Centelles et al. (2010); Horowitz et al. (2001); Moreno et al. (2010):
| (26) |
with
| (27) | |||||
| (28) |
where we have neglected strange quark form factor contributions to the weak charge distribution Horowitz et al. (2001). Substituting and in Eq. (26) gives
wherefore it follows that the weak charge density is dominated by the neutron density of the nucleus.
Furnstahl Furnstahl (2002) showed that the neutron form factor of 208Pb at low momentum transfer is strongly correlated with the neutron radius of 208Pb in mean-field models. In fact, in a plane wave Born approximation (PWBA) the parity-violating asymmetry is given by Donnelly et al. (1989); Horowitz (1998); Horowitz et al. (2001)
| (30) |
where is the fine structure constant and and are, respectively, the neutron and proton form factors (Fourier transforms of the point neutron and proton spatial distributions). If one takes the proton form factor of 208Pb at low known from experiment, the correlation between the neutron form factor and the neutron radius of 208Pb Furnstahl (2002) suggests, in view of Eq. (30), a correlation between the parity violating asymmetry and the neutron radius of this nucleus. The latter correlation has been shown in Ref. Ban et al. (2012) in exact DWBA calculations.
Moreover, the fact that the form factors behave as when suggests also a correlation between the parity violating asymmetry and the neutron skin thickness of the target nucleus in the low-momentum transfer regime, since for one has
| (31) |
Here we have written as . For realistic results and comparisons against experiment, however, one cannot use the simple and insightful PWBA and full DWBA calculations have to be performed. Note that the Coulomb distortions can correct the PWBA results by more than 40% of the value found in the PWBA.
3.2 Discussion of results for the parity violating asymmetry in 208Pb
We display in Fig. 7 the relation between the parity violating asymmetry and the neutron skin thickness in 208Pb within the realm of nuclear energy density functionals Roca-Maza et al. (2011). The scattering problem has been solved in exact DWBA calculations for electrons that scatter from lead at an energy of GeV and an angle of , which is close to the operating conditions of PREX.
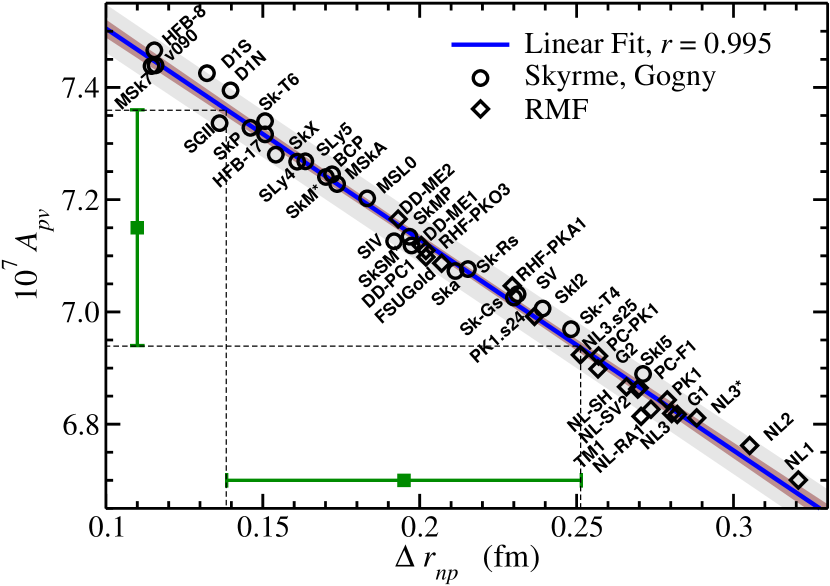
The corpus of 47 nuclear models considered in Fig. 7 is representative of models of very different kind. We have used non-relativistic Skyrme forces (all models of Fig. 7 that start by S and the models HFB-8, HFB-17, v090, MSk7, MSkA, and MSL0), Gogny forces (models D1S and D1N), and the finite-range BCP functional. On the other hand, we have considered relativistic mean-field models based on effective Lagrangians. In this case, in Fig. 7 we have included RMF models with non-linear meson couplings (these are the models with names starting by NL or PK, plus the models FSUGold, G1, G2, and TM1), meson-exchange models with density-dependent couplings (DD-ME and RHF-PK models), and finally, zero-range point-coupling models (DD-PC1, PC-PK1, and PC-PF1 models). The original references to these nuclear models can be found in the papers Centelles et al. (2009, 2010); Carbone et al. (2010); Chen et al. (2010); Baldo et al. (2008).
All of the models that we have allowed in our analysis predict the charge radius of 208Pb to better than 1% with respect to the experimental value (it is the same accuracy level as the 1% goal of PREX for the neutron radius). We have not either included models that fail significantly to predict the observed binding energy of 208Pb. It would be less realistic for constraining the unknown neutron radius of 208Pb to include results for calculated with the neutron densities predicted by models that fail to describe the well-established properties of 208Pb, like its charge radius (one has fm in 208Pb Angeli and Marinova (2013)). Let us remark also that we have not allowed more than two models of the same kind fitted by the same group and protocol in order to minimize potential biass in our conclusions.
It can be seen from Fig. 7 that the nuclear mean-field models predict a highly linear relation between and in 208Pb, in spite of the different theoretical grounds that underly the large variety of considered models. A linear correlation coefficient is found. We also plot in Fig. 7 the 95%-confidence band of the linear regression (colored thin inner band). The so-called confidence band represents the boundary of all of the possible straight lines fitting the results within a 95%-confidence level, see for example Ref. Draper and Smith (1998) for details. The fact that this band is very thin in Fig. 7 is another indicator of the strong linear correlation of the results. Also displayed in Fig. 7 is the so-called prediction band Draper and Smith (1998) at a 95%-confidence level (it is the wider colored band that basically coincides with the envelope of the models in the figure).
We next explore the accuracy in the determination of that can be obtained from a 3% accuracy in (as proposed in PREX-II Paschke et al. (2012)) assuming the correlation predicted by the nuclear energy density functionals. For illustration, we have placed in Fig. 7 an arbitrary value of (viz., 0.715 ppm) with an attached 3% error bar (viz., ppm) as depicted in the figure. Given that the correlation between and is highly linear, the conclusions about the resulting accuracy in will be very similar for other values, at least if they are not very far away. Even though our test central value ppm is not the one measured in the first run of PREX ( ppm), they agree to within the uncertainties.
In Fig. 7, a value ppm corresponds to a point located around the central region of the theoretical predictions for in the considered models. It implies a central value for that lies both within the range between 0.15 and 0.22 fm suggested by the experiments with strong probes Zenihiro et al. (2010); Centelles et al. (2010), and within the range between 0.14 and 0.20 fm suggested by recent constraints on the nuclear EOS derived from observed masses and radii of neutron stars Steiner et al. (2010); Hebeler et al. (2010). While the latter constraints and a majority of studies point toward a fairly thin neutron skin in lead Tsang et al. (2012), it is to be mentioned that ruling out a thick neutron skin as suggested by the central value of the first run of PREX Abrahamyan et al. (2012); Horowitz et al. (2012) could be premature Fattoyev and Piekarewicz (2013).
The 3%-accuracy test value of plotted in Fig. 7 implies through the precise universal correlation displayed in the figure a neutron skin thickness fm for 208Pb. Knowing and the proton radius of 208Pb by unfolding the finite size of the proton charge from the precisely known charge radius of this nucleus Vries et al. (1987); Angeli and Marinova (2013), the neutron radius can be obtained. One can assume for the same uncertainty of ( fm in our test example) because the accurate charge radius of 208Pb Angeli and Marinova (2013) has a negligibly small uncertainty in comparison with and . Therefore, the projected accuracy in is better than fm. This implies an accuracy of about 1% in , which is in total support of the goal of the PREX experiment. It may be underscored that the current analysis allows one to predict the NST and the neutron radius without specific assumptions about the shape of the neutron and proton density profiles.
In Ref. Roca-Maza et al. (2011) we also studied directly the correlation between the values of and of predicted in 208Pb by the mean-field models. For the same models of Fig. 7, the calculated results of and showed a linear trend with a correlation coefficient . That is, the correlation of with is a little less precise than the correlation of with . If we repeat the test that we have done before for , a 3%-accuracy value of placed at 0.715 ppm projects into a neutron radius of fm for 208Pb Roca-Maza et al. (2011) (the experiments involving strong probes suggest a range of roughly 5.52 fm to 5.67 fm for the central value of ). Since the correlation of with is not as strong as the correlation of with , for the 3% accuracy assumed in a little higher uncertainty is derived from the vs correlation than from the vs correlation (i.e, fm uncertainty instead of fm uncertainty, or a 14% more).
3.3 Constraining the slope of the density dependence of the symmetry energy at saturation from PVES
The determination of the density dependence of the nuclear symmetry energy has been identified as one of the most outstanding questions in nuclear physics for its deep implications for a wide variety of problems and phenomena. From the results discussed in the previous subsection and the fact that of a heavy nucleus is strongly correlated with the slope of the symmetry energy at the saturation density (see Fig. 2), we can expect a linear trend of with respect to the parameter in nuclear mean-field models. This expectation is confirmed by the plot shown in Fig. 8. It implies that a measurement of the parity violating asymmetry in 208Pb directly tests the density dependence of the nuclear symmetry energy.
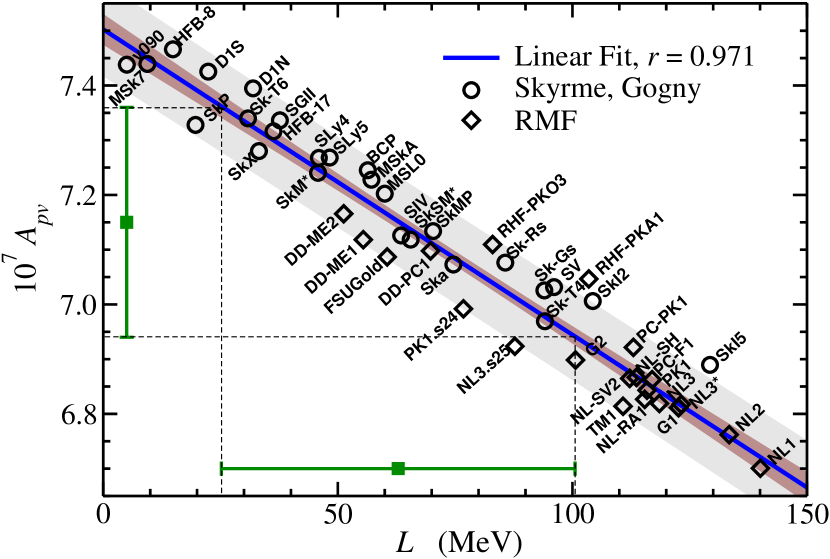
Note that the models with a stiffer symmetry energy around saturation density (models with larger values) have, consequently, a smaller symmetry energy at the subsaturation densities which are relevant for finite nuclei. Such models produce thicker neutron skins, and have smaller values of the parity violating asymmetry as it can be seen from the negative slope of as a function of in Fig. 8.
The linear correlation coefficient of the results for in 208Pb and is again quite high (). From the confrontation of with we find the following linear relation between these two quantities in nuclear models:
| (32) |
One of the main merits of an electroweak extraction of the critical parameter is that it would be mostly free from strong interaction uncertainties.
Assuming as before a 3%-accuracy value of , placed arbitrarily at 0.715 ppm, one finds MeV. This means that a 3%-accuracy in implies roughly a window of MeV in . Though the central value of depends on the assumption of 0.715 ppm, the spread in the determination of associated with a 3%-accuracy measurement of almost does not. Hence, one is bound to conclude that a 3% accuracy in the parity violating asymmetry does not impose a very narrow constraint on . However, the constraint can be of great interest because PREX for the first time probes neutrons in a heavy nucleus with an electroweak probe instead of less clean strong probes.
Let us mention that the high linearity of the correlation between between and (and between and ) found in our theoretical study shows that if could be measured with % accuracy, then could be estimated up to within a narrow window close to MeV accuracy (and within a window of about fm). Such a precise determination of through an electroweak measurement could have lasting impact in diverse areas of nuclear physics and astrophysics. Beyond doubt, a % accuracy in represents a formidable experimental challenge. Hopefully, the PREX-II experiment Paschke et al. (2012) and new facilities such as MESA in Mainz Sfienti (2013) will pave the way in a near future for such a goal.
4 Size and shape of the neutron distribution in 208Pb and symmetry energy
The extraction of the neutron skin thickness from experiment does not indicate in an unambiguous way whether the neutron skin is caused by an extended bulk radius, by a larger surface width of the neutron density, or by a combination of both effects Trzcińska et al. (2001); Świa̧tecki et al. (2005). This is a relevant aspect in experimental characterizations of neutron densities Trzcińska et al. (2001); Jastrzȩbski et al. (2004); Friedman and Gal (2003); Friedman et al. (2005); Friedman (2009). It is also an interesting aspect from a theoretical point of view because in 208Pb it is related with the density dependence of the symmetry energy Centelles et al. (2010).
The analysis of data in different types of experiments (such as electron scattering, nucleon scattering, experiments in exotic antiprotonic and pionic atoms, etc.) often involves parametrized nucleon densities. A popular profile is the two-parameter Fermi (2pF) function
| (33) |
where is central density, is the half-density radius, and is the diffuseness parameter. Albeit simple, a 2pF profile encodes the two most important quantities that characterize the shape of the density distributions, namely the position and thickness of the nuclear surface.
In the literature it has been found useful to distinguish two limiting situations in the formation of a neutron skin in a nucleus assuming 2pF shapes Trzcińska et al. (2001); Jastrzȩbski et al. (2004); Friedman and Gal (2003); Friedman et al. (2005); Friedman (2009). On the one hand, in the so-called halo-type density distributions the 2pF nucleon profiles have and . On the other hand, in the skin-type density distributions the 2pF nucleon profiles have and .
We can analyze whether the theoretical nuclear mean-field models support either (halo or skin) type of density distributions in 208Pb by applying the strategy of Refs. Warda et al. (2010); Centelles et al. (2010). That is, in order to obtain the predictions of the mean-field models for the central radius and diffuseness of the nucleon densities, we fit 2pF functions to the self-consistently calculated nucleon densities of the various models studied in the previous section. There is no unique parametrization of a given density profile with a 2pF function. Following Refs. Warda et al. (2010); Centelles et al. (2010), we fit the parameters of Eq. (33) to reproduce the zeroth, second, and fourth moments of the actual self-consistent mean-field density distributions. This method has been proven to fit accurately the surface region of any realistic density profile given as an input Warda et al. (2010); Centelles et al. (2010).
We display in Fig. 9 the difference between the surface diffuseness of neutrons and protons against the difference between the half-density radii for 208Pb in the present nuclear models. It is seen that models with a stiffer symmetry energy around saturation (i.e., models with larger values of the parameter) have larger values of the difference. The difference , however, is rather insensitive to the stiffness or softness of the symmetry energy Centelles et al. (2010).
Inspection of Fig. 9 shows that the nuclear energy density functionals overall predict density distributions with a mixed character between the halo and skin types. Nevertheless, it is to be observed that the models where the symmetry energy is softer do favor the halo-type densities, like the case of the HFB-8, MSk7, and v090 interactions. In contrast, we can see in Fig. 9 that no model predicts a skin-type distribution for 208Pb, as the difference is in all cases systematically away from a vanishing value. It may be reminded that in Refs. Trzcińska et al. (2001); Jastrzȩbski et al. (2004) the experimental extraction of neutron skins in antiprotonic atoms assumed halo-type density distributions. The theoretical predictions derived from nuclear mean-field models, thus, suggest that such an assumption is more plausible (especially if the symmetry energy is soft) than assuming that the neutron skin is formed by the mechanism of skin-type density distributions where .
The specific values of the and parameters of the 2pF functions describing the neutron mean-field densities of 208Pb can be found in Table III of Ref. Centelles et al. (2010) for many of the nuclear interactions we have considered here. Summarizing our results, we find that the neutron half-density radius spans a range between approximately 6.6 and 7.0 fm. Meanwhile, the neutron surface diffuseness lies in a window that spans at most from 0.5 to 0.6 fm; indeed, the majority of considered nuclear mean-field models predict within 0.545 and 0.565 fm.
As mentioned in the previous section where we discussed parity-violating elastic electron scattering in 208Pb, the parity violating asymmetry in the PREX experiment is obtained at one angle. Hence, assuming the electric charge distribution of 208Pb known from experiment, a determination of the shape of the neutron density of 208Pb parametrized by a 2pF profile requires a second measurement of at another angle Ban et al. (2012). However, we still may get some information from a single determination of the parity violating asymmetry if we describe the neutron density profile by assuming a 2pF function and restrict the neutron surface diffuseness to lie within the window predicted by the nuclear mean-field models.
Working with a 2pF function, the neutron radius can be accurately calculated using the following formula:
| (34) |
(see, e.g., the appendix of Ref. Warda et al. (2010)). For any given value of the neutron radius, if we vary within a prescribed range of values, it will produce a family of 2pF functions having the same neutron radius and different central radii . That is, we obtain a family of different neutron shapes having the same rms radius. We can compute the parity violating asymmetry for that family of 2pF neutron profiles, and then repeat the same exercise with a new value of the neutron radius.
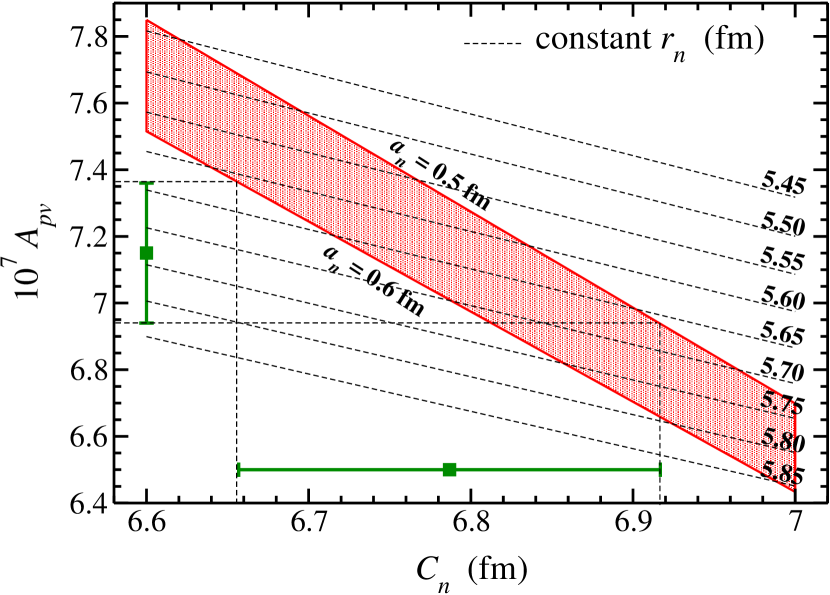
We display in Fig. 10 the calculated parity violating asymmetry by employing the experimental charge density of Ref. Vries et al. (1987) and 2pF neutron densities with the mentioned constraints. The results are plotted as a function of of the 2pF neutron profiles. Note that in Fig. 10 we are not using any densities of mean-field models. (For a calculation of with 2pF neutron and proton profiles with the parameters fitted to the theoretical mean-field densities, see section III.D of Ref. Centelles et al. (2010).) We also show in Fig. 10 the surfaces of constant neutron radius projected in the -vs- plane. As expected, we find a linear correlation between and since the central radius gives the main contribution to the rms radius of a 2pF function in 208Pb (cf. Eq. 34 and Ref. Centelles et al. (2010)).
In analogy to our previous analysis in Section 3, we set on top of Fig. 10 a test value of with a 3% error bar, placed at ppm as we did before in Section 3. From such a test constraint and a neutron surface diffuseness fm, we find a half-density radius fm for the neutron density profile of 208Pb. This implies a neutron rms radius fm (and a NST fm). Therefore, a 3% uncertainty in is projected into a 2% uncertainty in the neutron radius through the present analysis with 2pF neutron shapes. We note that the central values of the current predictions closely coincide with the values extracted in our analysis carried out in Section 3.2 (namely, fm and fm). However, the expected uncertainty is now about twice as large. This uncertainty could be narrowed down if we had not been so conservative in our estimate of and, instead of assuming fm, we had taken between 0.545 and 0.565 fm which is the prediction of a majority of mean-field models Centelles et al. (2010).
5 Discussion of results and comparison with other estimates of the slope of the symmetry energy at saturation
During the last years a major effort has been made in extracting the density dependence of the symmetry energy from experimental measurements and theoretical studies of very different nature. In Fig. 1 of the Introduction we have depicted a sample of such methods and predictions for the slope parameter . Here we aim at a short presentation of some of these studies and to facilitate a comparison of existing constraints (we emphasize that it would be near to impossible to mention in this section all determinations and we apologize for those studies that inadvertently may be absent below). Additional information can be found in the quoted references and in Tsang et al. (2012); Lattimer and Lim (2013). For detailed accounts of several studies mentioned in the following, see the related contributions to the present volume.
On the one side, there exist sophisticated microscopic calculations of the neutron matter EOS based on chiral effective field theory that combined with observed neutron star masses and radii Hebeler et al. (2010) predict –60 MeV. A determination of the EOS of neutron matter from quantum Monte Carlo calculations including realistic two- and three-nucleon forces Gandolfi et al. (2012) is compatible with similar values. The results from microscopic Brueckner-Hartree-Fock calculations including effective three-body forces give MeV Vidaña et al. (2011). These values for the slope of the symmetry energy are consistent with the range around –60 MeV predicted by an empirical EOS constrained exclusively on the basis of astrophysical observations (namely, a heterogeneous data set of six neutron stars) Steiner et al. (2010).
Studies of heavy-ion collisions of neutron-rich nuclei at intermediate energies are powerful sources of information to constrain Baran et al. (2005); Li et al. (2008). Sometimes modeled forms of the symmetry energy, such as Eq. (16), are implied to deduce . Simulations of isospin diffusion data with isospin- and momentum-dependent transport models Tsang et al. (2004); Steiner and Li (2005); Chen et al. (2005a, b); Li et al. (2008) have allowed to estimate in a range between 50 and 110 MeV. Improved quantum molecular dynamics simulations describing both isospin diffusion data and double ratios of neutron and proton spectra, support a similar range of values for a symmetry energy at saturation between 28 and 34 MeV Tsang et al. (2009). Experiments on transverse collective flows of hydrogen and helium isotopes Kohley et al. (2010, 2011) favor similar values of , as well as the predictions from neutron-proton emission data Famiano et al. (2006) ( MeV) and the isotopic-scaling results of Ref. Shetty et al. (2007) ( MeV).
Another source of information comes from the study of binding energies, analog states, and neutron skins. The study of masses Myers and Swiatecki (1996); Myers and Świa¸tecki (1998); Danielewicz (2003); Liu et al. (2010); Möller et al. (2012); Dong et al. (2012); Agrawal et al. (2012) leads to values between roughly 50 and 85 MeV. In particular, the new finite-range droplet model (FRDM) predicts MeV Möller et al. (2012). Similar values of as from nuclear masses are supported by studies of -decay energies ( MeV) Dong et al. (2013), Fermi-energy differences in nuclei ( MeV) Wang et al. (2013), and isospin effects in nuclear charge radii ( MeV) Wang and Li (2013). Excitation energies of isobaric analog states Danielewicz and Lee (2009) point to a range –111 MeV. Information on neutron distributions and skins can be obtained from nucleon elastic scattering. Recently, the neutron density of lead has been measured by polarized proton elastic scattering Zenihiro et al. (2010) giving fm in 208Pb, which suggests –110 MeV through the – correlation (cf. Fig. 2). An estimate of the NST in many nuclei is provided by the information obtained from antiprotonic atoms Trzcińska et al. (2001); Jastrzȩbski et al. (2004); Kłos et al. (2007) discussed in Sections 2.2 and 2.3. Using the neutron skins of 26 stable nuclei found from this technique, we predicted a range –80 MeV for the slope of the symmetry energy. The study of existing neutron skin data in Sn isotopes taken in combination with constraints from heavy-ion collisions leads to MeV Chen et al. (2010). Using the data on the NST in Sn isotopes and isotope binding energy differences, a range MeV has been obtained Zhang and Chen (2013). Most of the mentioned results are seen to be in good agreement among them and also with the value MeV extracted from global nucleon optical potentials Xu et al. (2010).
In order to measure neutron radii and skins, as we have discussed in the previous sections, parity-violating elastic electron scattering is a technique free from most strong interaction uncertainties Donnelly et al. (1989); Horowitz (1998); Horowitz et al. (2001); Vretenar et al. (2000); Moreno et al. (2010). The feasibility of this type of experiments in heavy nuclei has been recently demonstrated by the PREX collaboration Abrahamyan et al. (2012). The first measurement Abrahamyan et al. (2012) had a limited statistics and the analysis of the experimental data is compatible with a wide range of values (cf. Fig. 1). A better accuracy is pursued in a future experiment PREX-II Paschke et al. (2012).
Isovector giant resonances are a further experimental source of information on the symmetry energy. Indeed, in Ref. Trippa et al. (2008) the study of the Giant Dipole Resonance (GDR) in 208Pb was used to constrain the value of the symmetry energy at fm-3 to be within 23.3 and 24.9 MeV. A study on the Giant Quadrupole Resonance (GQR) in 208Pb provides a consistent constraint fm MeV Roca-Maza et al. (2013a). Although the nature of the low-lying dipole strength —the so-called Pygmy Dipole Resonance (PDR)— is still under debate, it has been identified by some authors as one of the observables that can shed light into a better characterization of the properties of the nuclear symmetry energy around saturation. In Ref. Klimkiewicz et al. (2007), the measured low-energy dipole response in neutron-rich Sn and Sb isotopes and available data on 208Pb allowed to derive MeV and a pressure of pure neutron matter at saturation MeV fm-3, implying MeV. The same observable was studied in 68Ni and 132Sn in Ref. Carbone et al. (2010) and MeV was obtained. More recently, experiments using inelastic scattering of polarized protons on 208Pb at very forward angles Tamii et al. (2011) combined with previous measurements on different energy ranges have provided the complete electric dipole response in 208Pb with high accuracy. A theoretical analysis of the experimental data Piekarewicz et al. (2012) leads to fm, which implies –60 MeV based on the strong correlation shown in Fig. 2. A more recent theoretical investigation has found a relation between the and parameters once the experimental value of the polarizability in a heavy nucleus is known. In 208Pb, such a relation is . Assuming a plausible range for of 29–33 MeV Tsang et al. (2012); Lattimer and Lim (2013), the constraint MeV has been obtained Roca-Maza et al. (2013b).
Concluding, all the mentioned techniques predict values of the slope of the symmetry energy at saturation lying in a range between about 20 and 130 MeV. In spite of the discrepancies in the details, the various findings from isospin-sensitive observables, including our study of neutron skins, seem to suggest a rather soft nuclear symmetry energy around saturation. Specifically, a weighted average of the different estimates on shown in Fig. 1 —neglecting the value reported in Ref. Famiano et al. (2006) since no error bar was available— suggests a rather narrow compatible window for the central value of the parameter that lies in the range MeV, though the large uncertainties indicate a standard deviation of about 50 MeV.
6 Summary and outlook
We have reviewed our main findings on the density content of the symmetry energy and the neutron skin thickness in a heavy nucleus such as 208Pb reported in earlier literature Centelles et al. (2009); Warda et al. (2009); Centelles et al. (2010); Roca-Maza et al. (2011). We have discussed possible extractions of such magnitudes from two experimental techniques, one involving the strong interaction and the other one involving the electro-weak interaction.
First, we have used insights from the DM Myers and Swiatecki (1969, 1974); Myers (1977); Myers and Swiatecki (1980) to study the NST of nuclei. In the DM picture the neutron skin consists of two contributions. One of them comes from the separation between the neutron and proton mean surfaces and the other one from the fact that the surface widths of the neutron and proton densities are different. In the DM, is basically driven by the ratio between the symmetry energy at saturation and the surface stiffness coefficient . This ratio is directly related to the symmetry energy coefficient of a finite nucleus Myers and Swiatecki (1969, 1974); Myers (1977). To relate the NST in a nucleus with the density content of the symmetry energy in the EOS, use has been made of a generic relation in mean-field models, where the DM symmetry energy coefficient in a nucleus and the symmetry energy in nuclear matter at a subsaturation density nearly coincide. This relation allows one to recast the expression for of the DM in terms of the slope parameter of the symmetry energy . The result provides a clear-cut insight into the correlation, first established by Brown Alex Brown (2000); Typel and Brown (2001), between the NST in 208Pb and the slope of the symmetry energy at saturation.
The neutron skins of 26 nuclei from 40Ca to 238U measured in antiprotonic atoms Trzcińska et al. (2001); Jastrzȩbski et al. (2004) are the largest set of skins extracted uniformly with the same experimental technique for stable isotopes along the periodic table. These data show an average linear behavior with Trzcińska et al. (2001); Jastrzȩbski et al. (2004). From the fit of the DM formula to the skin data of Refs. Trzcińska et al. (2001); Jastrzȩbski et al. (2004), we found that the ratio lies in a range of 0.6–0.9 and the slope of the symmetry energy is between 30 and 80 MeV. Though the neutron skins derived from antiprotonic atoms are to some extent model dependent and have for some nuclei large uncertainties, we find that the deduced estimate of the density dependence of the symmetry energy is very compatible with other analysis. In particular, it has a large overlap with the predictions from distinct experimental information such as heavy-ion collisions, proton-nucleus scattering, and giant resonances in neutron-rich nuclei. Note that the extraction of almost all of these estimates is largely ruled by the strong interaction and, therefore, model-dependent analyses are to certain extent unavoidable.
Parity-violating electron scattering has drawn considerable attention over the recent past as a possible model-independent probe of neutron distributions. The PREX collaboration Michaels et al. (2005); Horowitz et al. (2001); Abrahamyan et al. (2012) aims to determine the neutron radius in 208Pb with 1% accuracy by measuring the parity-violating asymmetry with 3% accuracy in polarized elastic electron scattering performed on a fixed 208Pb target. See the contribution to this volume by Horowitz, Kumar, and Michaels for a detailed account of PREX (and CREX). Motivated by this landmark experiment, prior to publication of the results of the first run Abrahamyan et al. (2012), we reported a theoretical study about the relation of with the NST of 208Pb and with the density dependence of the symmetry energy Roca-Maza et al. (2011). Here, we reviewed our study of Roca-Maza et al. (2011) and extended it in some aspect. We have computed in DWBA calculations in a comprehensive set of mean-field models that reproduce the experimental charge radius of 208Pb within 1% accuracy. The electric and weak charge density distributions have been obtained from the self-consistent point-like neutron and proton densities of the nuclear models folded with electromagnetic and weak charge form factors. An almost perfect linear correlation () between and of 208Pb is found in the nuclear mean-field models. Also a very good correlation, but a little less linear (), exists between and the neutron radius. The calculations also reveal that a 3% accuracy in leads to 1% accuracy in the neutron radius, hence supporting the goal of PREX.
A 3% accuracy in was unachieved in the first run of PREX but will be within reach of PREX-II Abrahamyan et al. (2012); Paschke et al. (2012). Here, as in Ref. Roca-Maza et al. (2011), we discussed a 3%-accuracy test value placed at ppm. It implies a central value for of 208Pb within the estimates obtained both from a variety of strong probes and from information from observed masses and radii of neutron stars. Although our central value of is not the value measured in the first run of PREX ( ppm), they agree within uncertainties. Our predictions about the accuracy for extracting the neutron radius, neutron skin, and slope of the symmetry energy if is measured to 3% accuracy, remain valid almost independently of the central value of in the analyzed ranges.
We have found a strong correlation between and the slope of the symmetry energy . A relatively large spread of MeV in is predicted if the accuracy of an measurement is at the 3% level. Our study supports that an eventual measurement of with 1% accuracy would allow to constrain of 208Pb and within narrow bounds close to fm and MeV, respectively.
Finally, we discussed some features of the size and shape of the neutron density distribution of 208Pb according to the mean-field models. We concluded by discussing calculations of in 208Pb performed with the experimental charge density and neutron densities parametrized by 2pF shapes, where the neutron surface diffuseness was varied within the range predicted by the theory.
Recently, a new measurement of the electric dipole response in 208Pb has allowed to determine the electric dipole polarizability in this nucleus to 3% accuracy ( fm3) Tamii et al. (2011); see the contribution to this volume by Tamii, von Neumann-Cosel, and Poltoratska. A skin fm in 208Pb was deduced Tamii et al. (2011) via the covariance analysis of Ref. Reinhard and Nazarewicz (2010) within a Skyrme model. In a later study using a wide class of functionals, fm was reported from the data Piekarewicz et al. (2012). A new study of the observable Roca-Maza et al. (2013b) has been inspired by insights from the DM. That is, the DM expression for the dipole polarizability Meyer et al. (1982):
| (35) |
considered together with the DM formula for the neutron skin thickness (cf. Eqs. (12)–(13) in Section 2.1), suggests that the dipole polarizability times the symmetry energy at saturation () is strongly correlated with in 208Pb and with the slope of the symmetry energy Roca-Maza et al. (2013b). These correlations have been confirmed to be very accurate by self-consistent calculations in a large set of nuclear functionals Roca-Maza et al. (2013b). A similarly strong correlation has been shown between and the parity-violating asymmetry in 208Pb Roca-Maza et al. (2013b). Hence, precise measurements of the dipole polarizability and the parity-violating asymmetry in 208Pb, and in other neutron-rich heavy- and medium-mass nuclei, are expected to offer trailblazing opportunities both to constrain a fundamental property of nucleon densities such as the neutron skin thickness and to scrutinize the density dependence of the symmetry energy around nuclear saturation.
Acknowledgments
Our research has been partially funded by the Spanish Consolider-Ingenio 2010 Programme CPAN CSD2007-00042 and by Grants No. FIS2011-24154 from MICINN (Spain) and FEDER, No. 2009SGR-1289 from Generalitat de Catalunya (Spain), and No. DEC-2011/01/B/ST2/03667 from National Science Centre (Poland).
References
- Steiner et al. (2005) A. Steiner, M. Prakash, J. Lattimer, and P. Ellis, Physics Reports 411, 325 (2005), ISSN 0370-1573, URL http://www.sciencedirect.com/science/article/pii/S03701573050%01043.
- Alex Brown (2000) B. Alex Brown, Phys. Rev. Lett. 85, 5296 (2000), URL http://link.aps.org/doi/10.1103/PhysRevLett.85.5296.
- Typel and Brown (2001) S. Typel and B. A. Brown, Phys. Rev. C 64, 027302 (2001), URL http://link.aps.org/doi/10.1103/PhysRevC.64.027302.
- Furnstahl (2002) R. Furnstahl, Nuclear Physics A 706, 85 (2002), ISSN 0375-9474, URL http://www.sciencedirect.com/science/article/pii/S03759474020%08679.
- Horowitz and Piekarewicz (2001) C. J. Horowitz and J. Piekarewicz, Phys. Rev. Lett. 86, 5647 (2001), URL http://link.aps.org/doi/10.1103/PhysRevLett.86.5647.
- Todd-Rutel and Piekarewicz (2005) B. G. Todd-Rutel and J. Piekarewicz, Phys. Rev. Lett. 95, 122501 (2005), URL http://link.aps.org/doi/10.1103/PhysRevLett.95.122501.
- Dieperink et al. (2003) A. E. L. Dieperink, Y. Dewulf, D. Van Neck, M. Waroquier, and V. Rodin, Phys. Rev. C 68, 064307 (2003), URL http://link.aps.org/doi/10.1103/PhysRevC.68.064307.
- Steiner and Li (2005) A. W. Steiner and B.-A. Li, Phys. Rev. C 72, 041601 (2005), URL http://link.aps.org/doi/10.1103/PhysRevC.72.041601.
- Gaidarov et al. (2012) M. K. Gaidarov, A. N. Antonov, P. Sarriguren, and E. M. de Guerra, Phys. Rev. C 85, 064319 (2012), URL http://link.aps.org/doi/10.1103/PhysRevC.85.064319.
- Khoa et al. (1996) D. T. Khoa, W. von Oertzen, and A. Ogloblin, Nuclear Physics A 602, 98 (1996), ISSN 0375-9474, URL http://www.sciencedirect.com/science/article/pii/037594749600%0917.
- Gaitanos et al. (2004) T. Gaitanos, M. D. Toro, S. Typel, V. Baran, C. Fuchs, V. Greco, and H. Wolter, Nuclear Physics A 732, 24 (2004), ISSN 0375-9474, URL http://www.sciencedirect.com/science/article/pii/S03759474030%19511.
- Baran et al. (2005) V. Baran, M. Colonna, V. Greco, and M. D. Toro, Physics Reports 410, 335 (2005), ISSN 0370-1573, URL http://www.sciencedirect.com/science/article/pii/S03701573050%00025.
- Li et al. (2008) B.-A. Li, L.-W. Chen, and C. M. Ko, Physics Reports 464, 113 (2008), ISSN 0370-1573, URL http://www.sciencedirect.com/science/article/pii/S03701573080%01269.
- Shetty et al. (2007) D. V. Shetty, S. J. Yennello, and G. A. Souliotis, Phys. Rev. C 76, 024606 (2007), URL http://link.aps.org/doi/10.1103/PhysRevC.76.024606.
- Famiano et al. (2006) M. A. Famiano, T. Liu, W. G. Lynch, M. Mocko, A. M. Rogers, M. B. Tsang, M. S. Wallace, R. J. Charity, S. Komarov, D. G. Sarantites, et al., Phys. Rev. Lett. 97, 052701 (2006), URL http://link.aps.org/doi/10.1103/PhysRevLett.97.052701.
- Tsang et al. (2009) M. B. Tsang, Y. Zhang, P. Danielewicz, M. Famiano, Z. Li, W. G. Lynch, and A. W. Steiner, Phys. Rev. Lett. 102, 122701 (2009), URL http://link.aps.org/doi/10.1103/PhysRevLett.102.122701.
- Trippa et al. (2008) L. Trippa, G. Colò, and E. Vigezzi, Phys. Rev. C 77, 061304 (2008), URL http://link.aps.org/doi/10.1103/PhysRevC.77.061304.
- Klimkiewicz et al. (2007) A. Klimkiewicz, N. Paar, P. Adrich, M. Fallot, K. Boretzky, T. Aumann, D. Cortina-Gil, U. D. Pramanik, T. W. Elze, H. Emling, et al. (LAND Collaboration), Phys. Rev. C 76, 051603 (2007), URL http://link.aps.org/doi/10.1103/PhysRevC.76.051603.
- Roca-Maza et al. (2012) X. Roca-Maza, G. Pozzi, M. Brenna, K. Mizuyama, and G. Colò, Phys. Rev. C 85, 024601 (2012), URL http://link.aps.org/doi/10.1103/PhysRevC.85.024601.
- Carbone et al. (2010) A. Carbone, G. Colò, A. Bracco, L.-G. Cao, P. F. Bortignon, F. Camera, and O. Wieland, Phys. Rev. C 81, 041301 (2010), URL http://link.aps.org/doi/10.1103/PhysRevC.81.041301.
- Roca-Maza et al. (2013a) X. Roca-Maza, M. Brenna, B. K. Agrawal, P. F. Bortignon, G. Colò, L.-G. Cao, N. Paar, and D. Vretenar, Phys. Rev. C 87, 034301 (2013a), URL http://link.aps.org/doi/10.1103/PhysRevC.87.034301.
- Guéna et al. (2005) J. Guéna, M. Lintz, and M.-A. Bouchiat, Modern Physics Letters A 20, 375 (2005), http://www.worldscientific.com/doi/pdf/10.1142/S0217732305016853, URL http://www.worldscientific.com/doi/abs/10.1142/S0217732305016%853.
- Sil et al. (2005) T. Sil, M. Centelles, X. Viñas, and J. Piekarewicz, Phys. Rev. C 71, 045502 (2005), URL http://link.aps.org/doi/10.1103/PhysRevC.71.045502.
- Lattimer and Prakash (2007) J. M. Lattimer and M. Prakash, Physics Reports 442, 109 (2007), ISSN 0370-1573, ¡ce:title¿The Hans Bethe Centennial Volume 1906-2006¡/ce:title¿, URL http://www.sciencedirect.com/science/article/pii/S03701573070%00452.
- Klähn et al. (2006) T. Klähn, D. Blaschke, S. Typel, E. N. E. van Dalen, A. Faessler, C. Fuchs, T. Gaitanos, H. Grigorian, A. Ho, E. E. Kolomeitsev, et al., Phys. Rev. C 74, 035802 (2006), URL http://link.aps.org/doi/10.1103/PhysRevC.74.035802.
- Loan et al. (2011) D. T. Loan, N. H. Tan, D. T. Khoa, and J. Margueron, Phys. Rev. C 83, 065809 (2011), URL http://link.aps.org/doi/10.1103/PhysRevC.83.065809.
- Dutra et al. (2012) M. Dutra, O. Loureno, J. S. Sá Martins, A. Delfino, J. R. Stone, and P. D. Stevenson, Phys. Rev. C 85, 035201 (2012), URL http://link.aps.org/doi/10.1103/PhysRevC.85.035201.
- Tsang et al. (2012) M. B. Tsang, J. R. Stone, F. Camera, P. Danielewicz, S. Gandolfi, K. Hebeler, C. J. Horowitz, J. Lee, W. G. Lynch, Z. Kohley, et al., Phys. Rev. C 86, 015803 (2012), URL http://link.aps.org/doi/10.1103/PhysRevC.86.015803.
- Lattimer and Lim (2013) J. M. Lattimer and Y. Lim, The Astrophysical Journal 771, 51 (2013), URL http://stacks.iop.org/0004-637X/771/i=1/a=51.
- Centelles et al. (2009) M. Centelles, X. Roca-Maza, X. Viñas, and M. Warda, Phys. Rev. Lett. 102, 122502 (2009), URL http://link.aps.org/doi/10.1103/PhysRevLett.102.122502.
- Warda et al. (2009) M. Warda, X. Viñas, X. Roca-Maza, and M. Centelles, Phys. Rev. C 80, 024316 (2009), URL http://link.aps.org/doi/10.1103/PhysRevC.80.024316.
- Warda et al. (2010) M. Warda, X. Viñas, X. Roca-Maza, and M. Centelles, Phys. Rev. C 81, 054309 (2010), URL http://link.aps.org/doi/10.1103/PhysRevC.81.054309.
- Centelles et al. (2010) M. Centelles, X. Roca-Maza, X. Viñas, and M. Warda, Phys. Rev. C 82, 054314 (2010), URL http://link.aps.org/doi/10.1103/PhysRevC.82.054314.
- Roca-Maza et al. (2011) X. Roca-Maza, M. Centelles, X. Viñas, and M. Warda, Phys. Rev. Lett. 106, 252501 (2011), URL http://link.aps.org/doi/10.1103/PhysRevLett.106.252501.
- Draper and Smith (1998) N. R. Draper and H. Smith, Applied Regression Analysis (3rd. ed. Wiley, New York, 1998).
- Myers and Swiatecki (1969) W. D. Myers and W. Swiatecki, Annals of Physics 55, 395 (1969), ISSN 0003-4916, URL http://www.sciencedirect.com/science/article/pii/000349166990%2024.
- Myers and Swiatecki (1974) W. Myers and W. Swiatecki, Annals of Physics 84, 186 (1974), ISSN 0003-4916, URL http://www.sciencedirect.com/science/article/pii/000349167490%2991.
- Myers (1977) W. Myers, Droplet Model of Atomic Nuclei (Plenum, New York, 1977).
- Farine et al. (1981) M. Farine, J. Côté, and J. M. Pearson, Phys. Rev. C 24, 303 (1981), URL http://link.aps.org/doi/10.1103/PhysRevC.24.303.
- Brack et al. (1985) M. Brack, C. Guet, and H.-B. H. kansson, Physics Reports 123, 275 (1985), ISSN 0370-1573, URL http://www.sciencedirect.com/science/article/pii/037015738690%0785.
- Kolehmainen et al. (1985) K. Kolehmainen, M. Prakash, J. M. Lattimer, and J. R. Treiner, Nuclear Physics A 439, 535 (1985), ISSN 0375-9474, URL http://www.sciencedirect.com/science/article/pii/037594748590%4257.
- Treiner and Krivine (1986) J. Treiner and H. Krivine, Annals of Physics 170, 406 (1986), ISSN 0003-4916, URL http://www.sciencedirect.com/science/article/pii/000349168690%0989.
- Centelles et al. (1998) M. Centelles, M. D. Estal, and X. V. nas, Nuclear Physics A 635, 193 (1998), ISSN 0375-9474, URL http://www.sciencedirect.com/science/article/pii/S03759474980%01675.
- Estal et al. (1999) M. D. Estal, M. Centelles, and X. Viñas, Nuclear Physics A 650, 443 (1999), ISSN 0375-9474, URL http://www.sciencedirect.com/science/article/pii/S03759474990%01062.
- Centelles and nas (1993) M. Centelles and X. V. nas, Nuclear Physics A 563, 173 (1993), ISSN 0375-9474, URL http://www.sciencedirect.com/science/article/pii/037594749390%601S.
- Danielewicz and Lee (2009) P. Danielewicz and J. Lee, Nuclear Physics A 818, 36 (2009), ISSN 0375-9474, URL http://www.sciencedirect.com/science/article/pii/S03759474080%07926.
- Liu et al. (2010) M. Liu, N. Wang, Z.-X. Li, and F.-S. Zhang, Phys. Rev. C 82, 064306 (2010), URL http://link.aps.org/doi/10.1103/PhysRevC.82.064306.
- Chen (2011) L.-W. Chen, Phys. Rev. C 83, 044308 (2011), URL http://link.aps.org/doi/10.1103/PhysRevC.83.044308.
- Zhang and Chen (2013) Z. Zhang and L.-W. Chen, ArXiv e-prints (2013), 1302.5327.
- Dong et al. (2012) J. Dong, W. Zuo, J. Gu, and U. Lombardo, Phys. Rev. C 85, 034308 (2012), URL http://link.aps.org/doi/10.1103/PhysRevC.85.034308.
- Dong et al. (2013) J. Dong, W. Zuo, and J. Gu, Phys. Rev. C 87, 014303 (2013), URL http://link.aps.org/doi/10.1103/PhysRevC.87.014303.
- Myers and Swiatecki (1980) W. Myers and W. Swiatecki, Nuclear Physics A 336, 267 (1980), ISSN 0375-9474, URL http://www.sciencedirect.com/science/article/pii/037594748090%6235.
- Trzcińska et al. (2001) A. Trzcińska, J. Jastrzȩbski, P. Lubiński, F. J. Hartmann, R. Schmidt, T. von Egidy, and B. Kłos, Phys. Rev. Lett. 87, 082501 (2001), URL http://link.aps.org/doi/10.1103/PhysRevLett.87.082501.
- Jastrzȩbski et al. (2004) J. Jastrzȩbski, A. Trzcińska, P. Lubiński, B. Kłos, F. J. Hartmann, T. von Egidy, and S. Wycech, International Journal of Modern Physics E 13, 343 (2004), http://www.worldscientific.com/doi/pdf/10.1142/S0218301304002168, URL http://www.worldscientific.com/doi/abs/10.1142/S0218301304002%168.
- Kłos et al. (2007) B. Kłos, A. Trzcińska, J. Jastrzȩbski, T. Czosnyka, M. Kisieliński, P. Lubiński, P. Napiorkowski, L. Pieńkowski, F. J. Hartmann, B. Ketzer, et al., Phys. Rev. C 76, 014311 (2007), URL http://link.aps.org/doi/10.1103/PhysRevC.76.014311.
- Krasznahorkay et al. (2004) A. Krasznahorkay, H. Akimune, A. van den Berg, N. Blasi, S. Brandenburg, M. Csatlo´s, M. Fujiwara, J. Gulya´s, M. Harakeh, M. Hunyadi, et al., Nuclear Physics A 731, 224 (2004), ISSN 0375-9474, URL http://www.sciencedirect.com/science/article/pii/S03759474030%18712.
- Chen et al. (2005a) L.-W. Chen, C. M. Ko, and B.-A. Li, Phys. Rev. Lett. 94, 032701 (2005a), URL http://link.aps.org/doi/10.1103/PhysRevLett.94.032701.
- Chen et al. (2005b) L.-W. Chen, C. M. Ko, and B.-A. Li, Phys. Rev. C 72, 064309 (2005b), URL http://link.aps.org/doi/10.1103/PhysRevC.72.064309.
- Świa̧tecki et al. (2005) W. J. Świa̧tecki, A. Trzcińska, and J. Jastrzȩbski, Phys. Rev. C 71, 047301 (2005), URL http://link.aps.org/doi/10.1103/PhysRevC.71.047301.
- Danielewicz (2003) P. Danielewicz, Nuclear Physics A 727, 233 (2003), ISSN 0375-9474, URL http://www.sciencedirect.com/science/article/pii/S03759474030%16622.
- Mizutori et al. (2000) S. Mizutori, J. Dobaczewski, G. A. Lalazissis, W. Nazarewicz, and P.-G. Reinhard, Phys. Rev. C 61, 044326 (2000), URL http://link.aps.org/doi/10.1103/PhysRevC.61.044326.
- Centelles et al. (1990) M. Centelles, M. Pi, X. V. nas, F. Garcias, and M. Barranco, Nuclear Physics A 510, 397 (1990), ISSN 0375-9474, URL http://www.sciencedirect.com/science/article/pii/037594749090%058T.
- Michaels et al. (2005) R. Michaels et al. (PREX Collaboration) (2005), URL http://hallaweb.jlab.org/parity/prex/pbup2005.ps.
- Horowitz et al. (2001) C. J. Horowitz, S. J. Pollock, P. A. Souder, and R. Michaels, Phys. Rev. C 63, 025501 (2001), URL http://link.aps.org/doi/10.1103/PhysRevC.63.025501.
- Abrahamyan et al. (2012) S. Abrahamyan, Z. Ahmed, H. Albataineh, K. Aniol, D. S. Armstrong, W. Armstrong, T. Averett, B. Babineau, A. Barbieri, V. Bellini, et al. (PREX Collaboration), Phys. Rev. Lett. 108, 112502 (2012), URL http://link.aps.org/doi/10.1103/PhysRevLett.108.112502.
- Paschke et al. (2012) K. Paschke et al. (2012), pREX-II Proposal to Jefferson Lab., URL http://hallaweb.jlab.org/parity/prex/prexII.pdf.
- Ban et al. (2012) S. Ban, C. J. Horowitz, and R. Michaels, Journal of Physics G: Nuclear and Particle Physics 39, 015104 (2012), URL http://stacks.iop.org/0954-3899/39/i=1/a=015104.
- Liu et al. (2012) J. Liu, Z. Ren, and T. Dong, Nuclear Physics A 888, 45 (2012), ISSN 0375-9474, URL http://www.sciencedirect.com/science/article/pii/S03759474120%01959.
- Liu et al. (2013) J. Liu, Z. Ren, and T. Dong, Nuclear Physics A 900, 1 (2013), ISSN 0375-9474, URL http://www.sciencedirect.com/science/article/pii/S03759474130%00535.
- Riordan et al. (2013) S. Riordan et al. (2013), cREX Proposal to Jefferson Lab., URL http://hallaweb.jlab.org/parity/prex/c-rex2013_v7.pdf.
- Sfienti (2013) C. Sfienti (2013), see talk at the “Workshop to Explore Physics Opportunities with Intense, Polarized Electron Beams up to 300 MeV” and “Calcium Radius Experiment (CREX) Workshop at Jefferson Lab”.
- Horowitz et al. (2012) C. J. Horowitz, Z. Ahmed, C.-M. Jen, A. Rakhman, P. A. Souder, M. M. Dalton, N. Liyanage, K. D. Paschke, K. Saenboonruang, R. Silwal, et al., Phys. Rev. C 85, 032501 (2012), URL http://link.aps.org/doi/10.1103/PhysRevC.85.032501.
- Mohr (2011) P. J. Mohr (2011), URL http://pdg.lbl.gov/2012/reviews/rpp2012-rev-phys-constants.pd%f.
- Donnelly et al. (1989) T. Donnelly, J. Dubach, and I. Sick, Nuclear Physics A 503, 589 (1989), ISSN 0375-9474, URL http://www.sciencedirect.com/science/article/pii/037594748990%4326.
- Horowitz (1998) C. J. Horowitz, Phys. Rev. C 57, 3430 (1998), URL http://link.aps.org/doi/10.1103/PhysRevC.57.3430.
- Vretenar et al. (2000) D. Vretenar, P. Finelli, A. Ventura, G. A. Lalazissis, and P. Ring, Phys. Rev. C 61, 064307 (2000), URL http://link.aps.org/doi/10.1103/PhysRevC.61.064307.
- Moreno et al. (2010) O. Moreno, E. M. de Guerra, P. Sarriguren, and J. M. Udías, Journal of Physics G: Nuclear and Particle Physics 37, 064019 (2010), URL http://stacks.iop.org/0954-3899/37/i=6/a=064019.
- Roca-Maza et al. (2008) X. Roca-Maza, M. Centelles, F. Salvat, and X. Viñas, Phys. Rev. C 78, 044332 (2008), URL http://link.aps.org/doi/10.1103/PhysRevC.78.044332.
- Salvat et al. (2005) F. Salvat, A. Jablonski, and C. J. Powell, Computer Physics Communications 165, 157 (2005), ISSN 0010-4655, URL http://www.sciencedirect.com/science/article/pii/S00104655040%04795.
- Friedrich and Walcher (2003) J. Friedrich and T. Walcher, Eur. Phys. A 17, 607 (2003), URL http://dx.doi.org/10.1140/epja/i2003-10025-3.
- Chen et al. (2010) L.-W. Chen, C. M. Ko, B.-A. Li, and J. Xu, Phys. Rev. C 82, 024321 (2010), URL http://link.aps.org/doi/10.1103/PhysRevC.82.024321.
- Baldo et al. (2008) M. Baldo, P. Schuck, and X. V. nas, Physics Letters B 663, 390 (2008), ISSN 0370-2693, URL http://www.sciencedirect.com/science/article/pii/S03702693080%04383.
- Angeli and Marinova (2013) I. Angeli and K. Marinova, Atomic Data and Nuclear Data Tables 99, 69 (2013), ISSN 0092-640X, URL http://www.sciencedirect.com/science/article/pii/S0092640X120%00265.
- Zenihiro et al. (2010) J. Zenihiro, H. Sakaguchi, T. Murakami, M. Yosoi, Y. Yasuda, S. Terashima, Y. Iwao, H. Takeda, M. Itoh, H. P. Yoshida, et al., Phys. Rev. C 82, 044611 (2010), URL http://link.aps.org/doi/10.1103/PhysRevC.82.044611.
- Steiner et al. (2010) A. W. Steiner, J. M. Lattimer, and E. F. Brown, The Astrophysical Journal 722, 33 (2010), URL http://stacks.iop.org/0004-637X/722/i=1/a=33.
- Hebeler et al. (2010) K. Hebeler, J. M. Lattimer, C. J. Pethick, and A. Schwenk, Phys. Rev. Lett. 105, 161102 (2010), URL http://link.aps.org/doi/10.1103/PhysRevLett.105.161102.
- Fattoyev and Piekarewicz (2013) F. Fattoyev and J. Piekarewicz (2013), nucl-th/1306.6034, URL http://arxiv.org/abs/1306.6034.
- Vries et al. (1987) H. D. Vries, C. D. Jager, and C. D. Vries, Atomic Data and Nuclear Data Tables 36, 495 (1987), ISSN 0092-640X, URL http://www.sciencedirect.com/science/article/pii/0092640X8790%0131.
- Friedman and Gal (2003) E. Friedman and A. Gal, Nuclear Physics A 724, 143 (2003), ISSN 0375-9474, URL http://www.sciencedirect.com/science/article/pii/S03759474030%14763.
- Friedman et al. (2005) E. Friedman, A. Gal, and J. Mareš, Nuclear Physics A 761, 283 (2005), ISSN 0375-9474, URL http://www.sciencedirect.com/science/article/pii/S03759474050%10146.
- Friedman (2009) E. Friedman, Hyperfine Interactions 193, 33 (2009), ISSN 0304-3843, URL http://dx.doi.org/10.1007/s10751-009-0066-x.
- Gandolfi et al. (2012) S. Gandolfi, J. Carlson, and S. Reddy, Phys. Rev. C 85, 032801 (2012), URL http://link.aps.org/doi/10.1103/PhysRevC.85.032801.
- Vidaña et al. (2011) I. Vidaña, A. Polls, and C. m. c. Providência, Phys. Rev. C 84, 062801 (2011), URL http://link.aps.org/doi/10.1103/PhysRevC.84.062801.
- Tsang et al. (2004) M. B. Tsang, T. X. Liu, L. Shi, P. Danielewicz, C. K. Gelbke, X. D. Liu, W. G. Lynch, W. P. Tan, G. Verde, A. Wagner, et al., Phys. Rev. Lett. 92, 062701 (2004), URL http://link.aps.org/doi/10.1103/PhysRevLett.92.062701.
- Kohley et al. (2010) Z. Kohley, L. W. May, S. Wuenschel, A. Bonasera, K. Hagel, R. Tripathi, R. Wada, G. A. Souliotis, D. V. Shetty, S. Galanopoulos, et al., Phys. Rev. C 82, 064601 (2010), URL http://link.aps.org/doi/10.1103/PhysRevC.82.064601.
- Kohley et al. (2011) Z. Kohley, L. W. May, S. Wuenschel, M. Colonna, M. Di Toro, M. Zielinska-Pfabe, K. Hagel, R. Tripathi, A. Bonasera, G. A. Souliotis, et al., Phys. Rev. C 83, 044601 (2011), URL http://link.aps.org/doi/10.1103/PhysRevC.83.044601.
- Myers and Swiatecki (1996) W. Myers and W. Swiatecki, Nuclear Physics A 601, 141 (1996), ISSN 0375-9474, URL http://www.sciencedirect.com/science/article/pii/037594749500%5099.
- Myers and Świa¸tecki (1998) W. D. Myers and W. J. Świa¸tecki, Phys. Rev. C 57, 3020 (1998), URL http://link.aps.org/doi/10.1103/PhysRevC.57.3020.
- Möller et al. (2012) P. Möller, W. D. Myers, H. Sagawa, and S. Yoshida, Phys. Rev. Lett. 108, 052501 (2012), URL http://link.aps.org/doi/10.1103/PhysRevLett.108.052501.
- Agrawal et al. (2012) B. K. Agrawal, J. N. De, and S. K. Samaddar, Phys. Rev. Lett. 109, 262501 (2012), URL http://link.aps.org/doi/10.1103/PhysRevLett.109.262501.
- Wang et al. (2013) N. Wang, L. Ou, and M. Liu, Phys. Rev. C 87, 034327 (2013), URL http://link.aps.org/doi/10.1103/PhysRevC.87.034327.
- Wang and Li (2013) N. Wang and T. Li, Phys. Rev. C 88, 011301 (2013), URL http://link.aps.org/doi/10.1103/PhysRevC.88.011301.
- Xu et al. (2010) C. Xu, B.-A. Li, and L.-W. Chen, Phys. Rev. C 82, 054607 (2010), URL http://link.aps.org/doi/10.1103/PhysRevC.82.054607.
- Tamii et al. (2011) A. Tamii et al., Phys. Rev. Lett. 107, 062502 (2011), URL http://link.aps.org/doi/10.1103/PhysRevLett.107.062502.
- Piekarewicz et al. (2012) J. Piekarewicz et al., Phys. Rev. C 85, 041302 (2012), URL http://link.aps.org/doi/10.1103/PhysRevC.85.041302.
- Roca-Maza et al. (2013b) X. Roca-Maza, M. Centelles, X. Viñas, M. Brenna, G. Colò, B. K. Agrawal, N. Paar, J. Piekarewicz, and D. Vretenar (2013b), 1307.4806, URL nucl-th/http://arxiv.org/abs/1307.4806.
- Reinhard and Nazarewicz (2010) P.-G. Reinhard and W. Nazarewicz, Phys. Rev. C 81, 051303 (2010), URL http://link.aps.org/doi/10.1103/PhysRevC.81.051303.
- Meyer et al. (1982) J. Meyer, P. Quentin, and B. Jennings, Nuclear Physics A 385, 269 (1982), ISSN 0375-9474, URL http://www.sciencedirect.com/science/article/pii/037594748290%1725.