Carrier and polarization dynamics in monolayer MoS2
Abstract
In monolayer MoS2 optical transitions across the direct bandgap are governed by chiral selection rules, allowing optical valley initialization. In time resolved photoluminescence (PL) experiments we find that both the polarization and emission dynamics do not change from 4K to 300K within our time resolution. We measure a high polarization and show that under pulsed excitation the emission polarization significantly decreases with increasing laser power. We find a fast exciton emission decay time on the order of 4ps. The absence of a clear PL polarization decay within our time resolution suggests that the initially injected polarization dominates the steady state PL polarization. The observed decrease of the initial polarization with increasing pump photon energy hints at a possible ultrafast intervalley relaxation beyond the experimental ps time resolution. By compensating the temperature induced change in bandgap energy with the excitation laser energy an emission polarization of 40% is recovered at 300K, close to the maximum emission polarization for this sample at 4K.
pacs:
78.60.Lc,78.66.LiI Introduction
Transition metal dichalcogenides such as MoS2 emerge as an exciting class of atomically flat, two-dimensional materials for electronics Radisavljevic et al. (2011); Wang et al. (2012a), optics Kumar et al. (2013) and optoelectronics Sundaram et al. (2013). In contrast to graphene, monolayer (ML) MoS2 has a direct bandgap Mak et al. (2010); Splendiani et al. (2010) in the visible region of the optical spectrum. Inversion symmetry breaking (usually absent in graphene) together with the spin-orbit interaction leads to a unique coupling of carrier spin and k-space valley physics. The circular polarization ( or ) of the absorbed or emitted photon can be directly associated with selective carrier excitation in one of the two non-equivalent K valleys ( or , respectively) Zhu et al. (2011); Cao et al. (2012); Xiao et al. (2012); Li et al. (2013), where the role of strong excitonic effects merits further investigation in this context Cheiwchanchamnangij and
Lambrecht (2012); Ramasubramaniam (2012); Mak et al. (2013); Crowne et al. (2013). The chiral optical selection rules open up very exciting possibilities of manipulating carriers in valleys with contrasting Berry phase curvatures Xiao et al. (2010), aiming for experimental manifestations of the predicted valley Hall effect Xiao et al. (2012). Also stable spin states have been predicted for valence and conduction states Ochoa and Roldán (2013); Wang and Wu (2013) for this material.
Up to now optical valley initialisation in ML MoS2 is based on the analysis of the large circular polarization degree of the emitted light from the direct bandgap observed in continuous wave (cw) measurements following circularly polarized laser excitation Cao et al. (2012); Mak et al. (2012); Zeng et al. (2012); Sallen et al. (2012); Kioseoglou et al. (2012); Wu et al. (2013). An important drawback seemed to be the drastic decrease of as the temperature is raised to 300K Mak et al. (2012); Zeng et al. (2012); Sallen et al. (2012); Wu et al. (2013). In a simple approach, the stationary (time integrated) polarisation is determined by the initially created polarization , the lifetime of the electron-hole pair and the polarization decay time through Meier and Zakharchenya (1984). We emphasize that the polarization decay time does not correspond directly to the carrier spin flip time as in most semiconductors like GaAs Meier and Zakharchenya (1984), but it includes the scattering time between the two non-equivalent K valleys (K+ or K-) Xiao et al. (2012).
In this letter we present the first time resolved polarization measurements in MoS2 monolayers, providing vital information on the valley dynamics from 4K to room temperature. We determine the key parameters that govern the stationary polarization degree : Using quasi-resonant excitation of the A-exciton transitions, we can infer that the photoluminescence (PL) decays within 4ps. For pulsed laser excitation, we observe a decrease of Pc with increasing laser power. We show that the PL polarisation remains nearly constant in time for experiments from 4K up to 300K, a necessary condition for the success of future Valley Hall effect experiments based on optically initialized k-valley polarization Xiao et al. (2012). In addition, does not vary significantly over this temperature range. These results are surprising when considering the reported decrease of in cw experiments when going from 4K to 300K reported in the literature Mak et al. (2012); Zeng et al. (2012); Sallen et al. (2012); Wu et al. (2013). By tuning the laser following the shift of the A-exciton resonance with temperature we are able to recover at room temperature of the polarization observed at 4K in our sample. The absence of a clear PL polarization decay within our time resolution suggests that the initially injected polarization , which dominates the steady state PL polarization, is responsible for this observation
II Samples and Set-up
MoS2 flakes are obtained by micro-mechanical cleavage of a natural bulk MoS2 crystal Novoselov et al. (2005)(from SPI Supplies, USA) on a Si/90 nm SiO2 substrate. The 1ML region is identified by optical contrast and very clearly in PL spectroscopy Mak et al. (2010). Experiments between T=4 and 300K are carried out in a confocal microscope optimized for polarized PL experimentsSallen et al. (2011). The MoS2 flake is excited by picosecond pulses generated by a tunable frequency-doubled optical parametric oscillator (OPO) synchronously pumped by a mode-locked Ti:Sa laser. The typical pulse and spectral width are 1.6 ps and 3 meV respectively; the repetition rate is 80 MHz. The laser wavelength can be tuned between 500 and 740 nm. The detection spot diameter is m. For time-integrated experiments, the PL emission is dispersed in a spectrometer and detected with a Si-CCD camera. For time-resolved experiments, the PL signal is dispersed by an imaging spectrometer and detected by a synchro-scan Hamamatsu Streak Camera with an overall time resolution of 4 ps. The PL polarization defined as is analyzed by a quarter-wave plate placed in front of a linear polarizer. Here denotes the intensity of the right () and left circularly polarized emission.
III Experimental Results
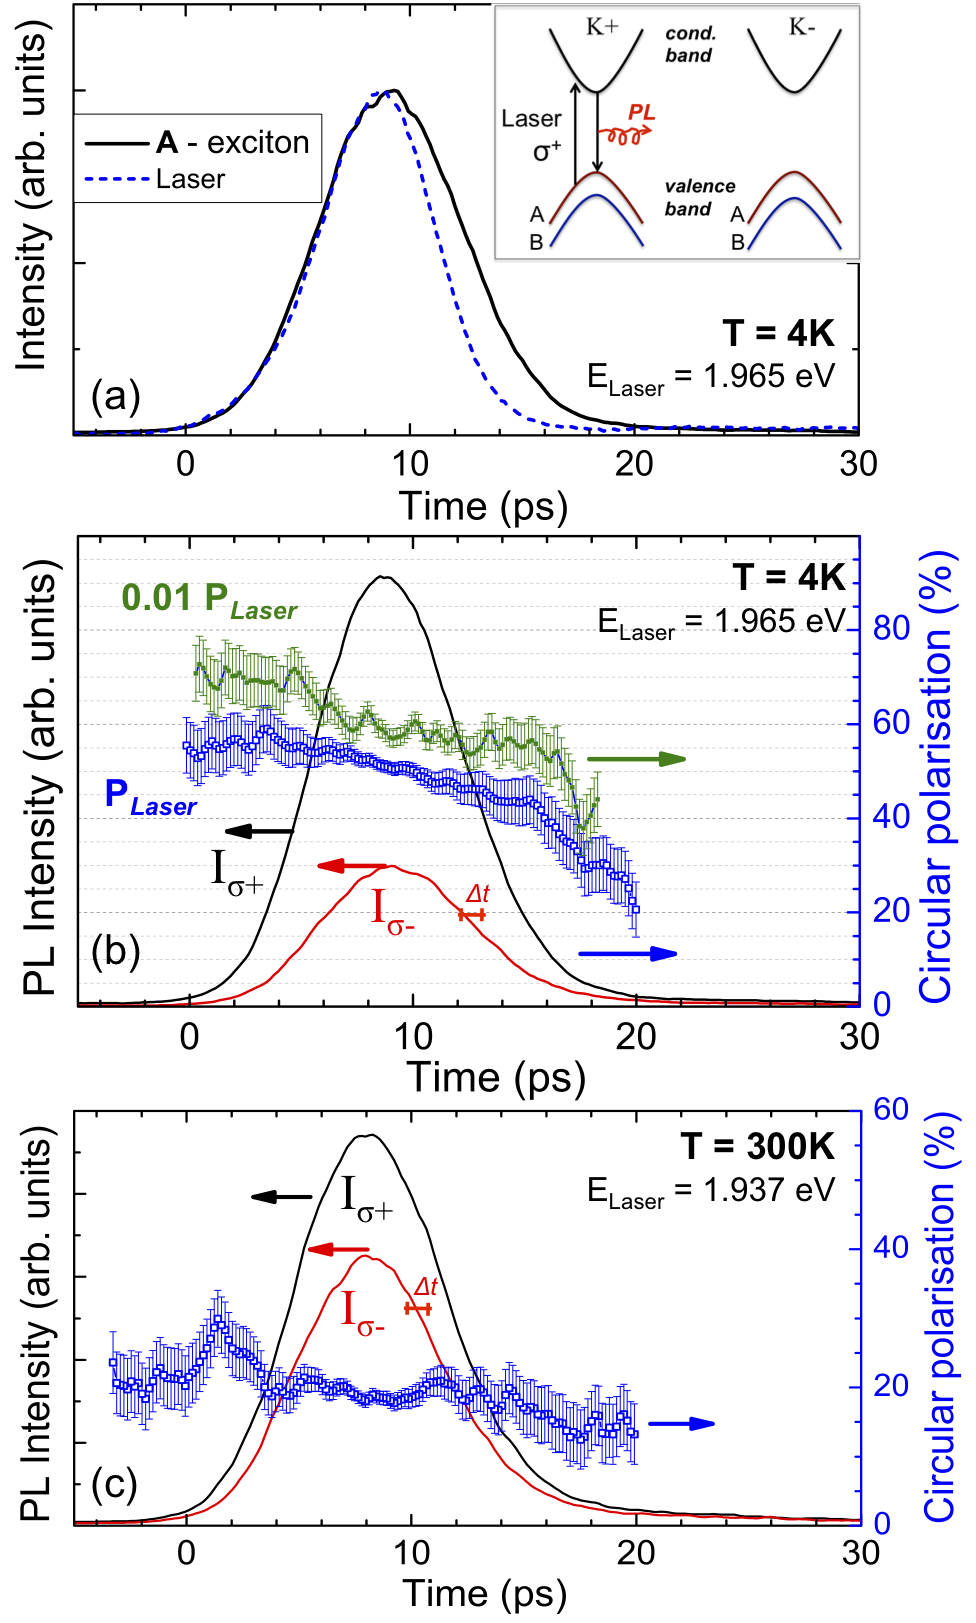
Figure 1a displays the total photoluminescence intensity dynamics at T=4 K following a polarized picosecond excitation laser pulse with an energy E eV, which is within the broad A-exciton absorption line Mak et al. (2012, 2013). The detection energy corresponds to the PL peak energy E eV. The average laser power used for all experiments in figures 1 to 3 is below 1 , well below absorption saturation and in the absence of sample heating effects, as discussed in detail in the supplementary material in sectionVI. We do not observe any variation of the dynamics when the detection energy is varied within the A-exciton spectrum apa . Though the MoS2 PL dynamics is very fast we see in figure 1 that it occurs on a slightly longer time scale compared to the one defined by the temporal resolution of the set-up (compare the MoS2 PL and laser pulse detection in figure 1a). Using a deconvolution based on Gaussian functions we can infer that the MoS2 emission time is about 4.5 ps. We emphasize that this fast PL dynamics is obtained in excitation conditions where exclusively the A-exciton (not B) in the K+ valley is excited (see inset of Fig.1a). Here the energy difference between excitation and detection is about 100 meV. Similarly fast dynamics were recorded in strongly non-resonant excitation conditions with eV Korn et al. (2011); Shi et al. (2013).
In figure 1b, the right () and left () circularly polarized luminescence components have been detected using a polarized laser (measured ). Remarkably the PL circular polarization degree is large and remains almost constant during the short exciton emission, around 50% for a laser excitation power P (blue curve in figure 1b). Lowering the excitation power by two orders of magnitude has a strong impact: the polarization still remains nearly constant, but at a higher value of 60% (green curve in figure 1b). As either the polarization generation at this laser energy is not 100% efficient (due to the optical selection rules) or there exist an ultrafast, initial polarization decay due to intervalley relaxation much shorter than 1ps that we do not resolve. Due to the sequential recording of and polarized kinetics there is an experimental uncertainty of when fixing the time origin of the emission with respect to . This results in an experimental uncertainty when determining the circular PL polarization, as indicated by the error bars in figure 1b. As a result of this time jitter and the short exciton emission time, our experiments do not allow an accurate determination of the spin/valley relaxation time .
The emission at room temperature is very similar to 4K with . Figure 1c shows constant in time for a laser excitation energy E eV. The dependence of as a function of the excitation laser energy will be discussed below. Remarkably the PL circular polarization degree which probes the valley initialization measured in time-resolved experiment is similar to the one obtained in cw experiments as a result of the very short exciton lifetime and the absence of measurable polarization decay within this short emission time.
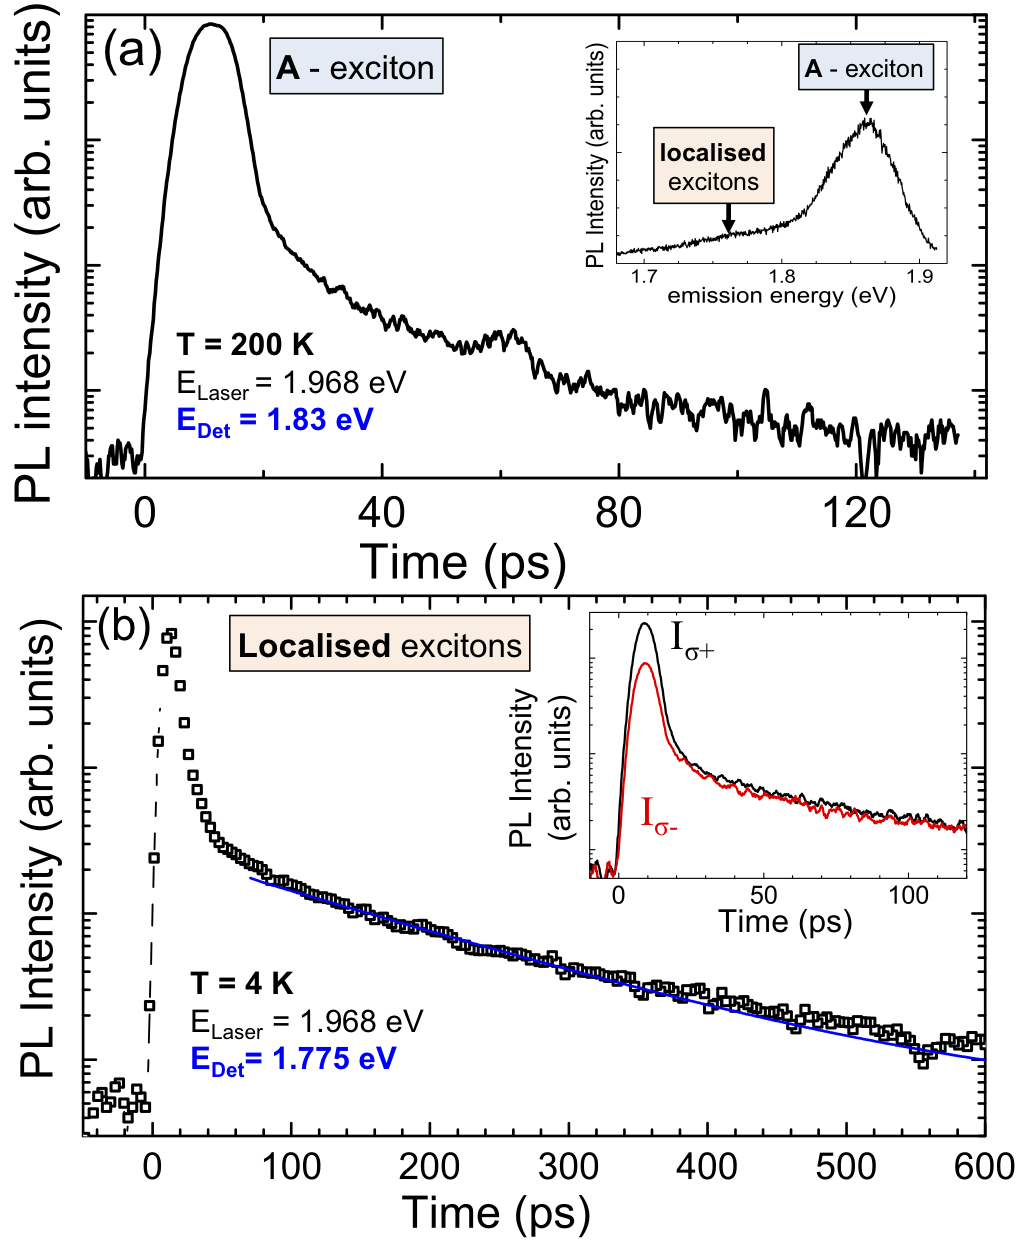
In figure 2a we show that when raising the temperature, in addition to the ps exciton decay a longer lived component is observed. This is similar to the findings of Korn et al. (2011) under highly non-resonant excitation. This measured long lived PL component is essentially unpolarized in figure 2a and the intensity is very weak compared to the short, main PL emission (log. scale). Therefore even at room temperature the short component, see figure 1c, determines Pc. In addition to the main A-exciton also localised excitons emitting at lower energy (E eV) are observed Mak et al. (2012); Korn et al. (2011); Sallen et al. (2012), see inset of figure 2a. The localised exciton emission decays within about 125ps at T=4K (see figure 2b) and is not detectable at higher temperature. The polarization dynamics is shown in the inset of figure 2b: as the A-exciton and the broad, localised exciton emission spectrally slightly overlap, we detect the remaining A-exciton polarization at short times, before detecting the essentially unpolarized emission of the localised excitons. It is important to note that the localised exciton polarization dynamics is expected to be more sensitive to the sample parameters (substrate material, interface defects etc) than the A-exciton emission.
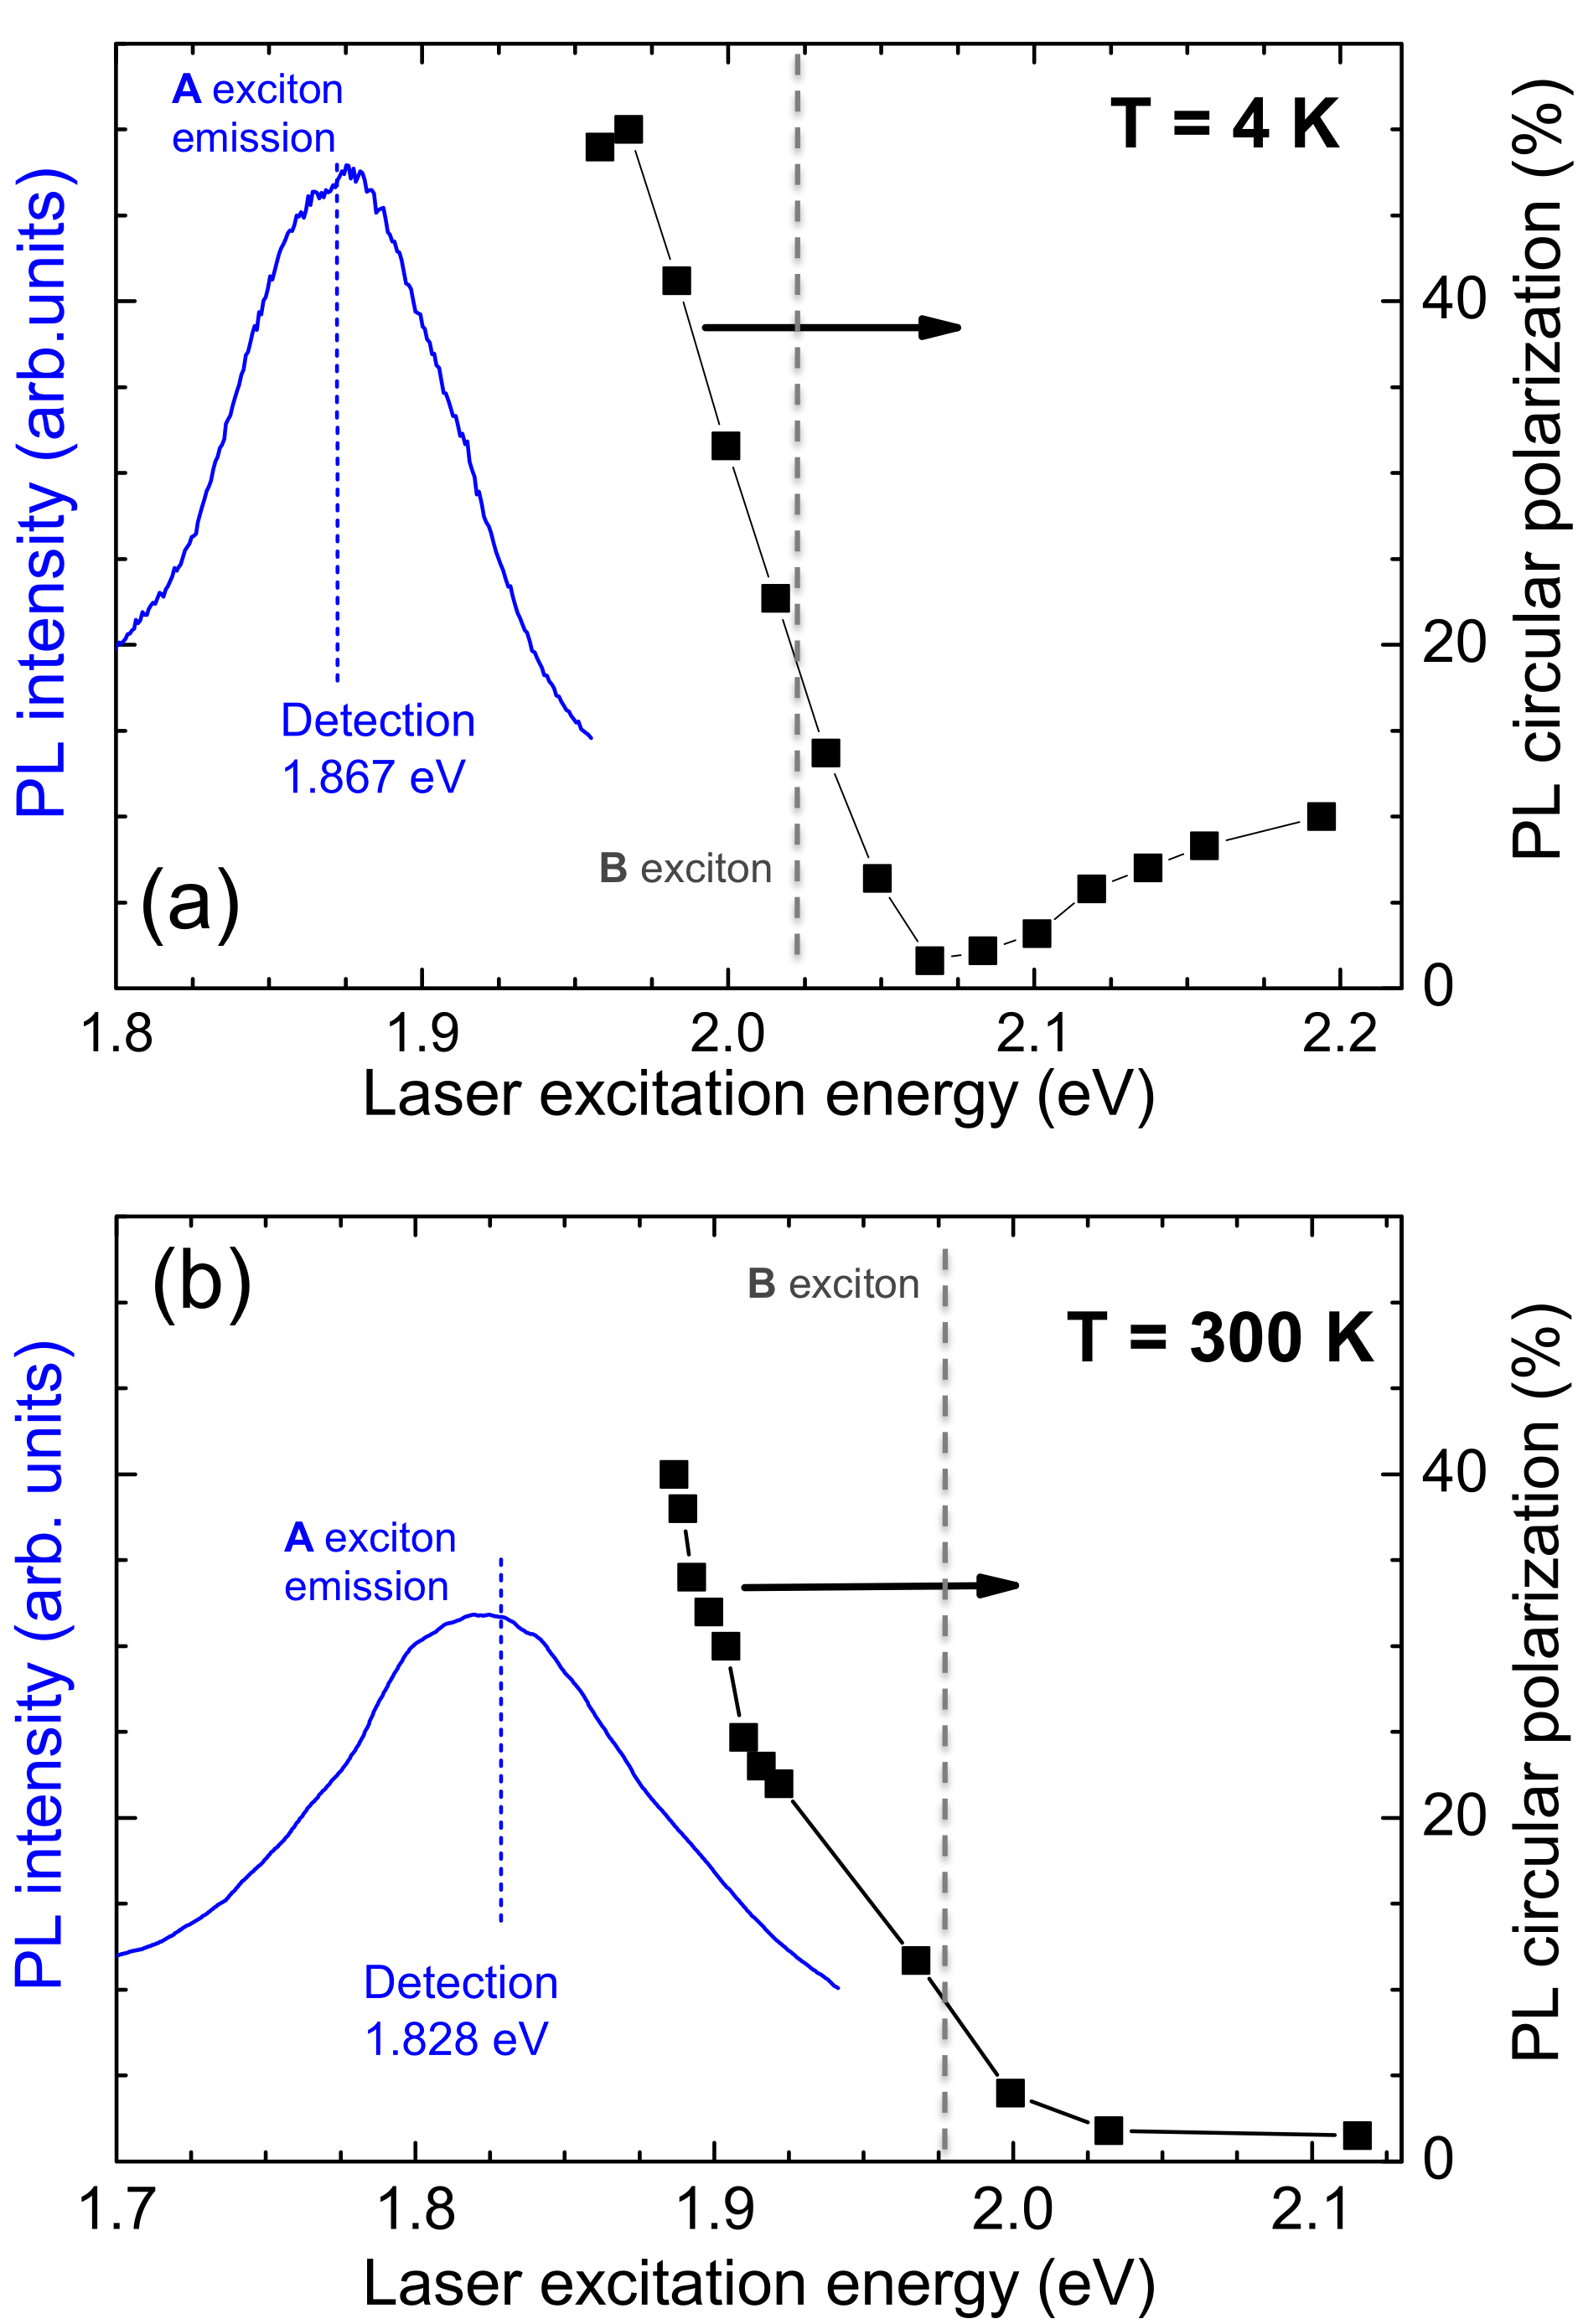
The time resolved measurements in figure 1c show a nearly constant polarization during the exciton PL emission at T=300K. Yet in the literature the time-integrated polarization of the A-exciton PL at room temperature is reported to be considerably lower than at 4K Mak et al. (2012); Sallen et al. (2012); Wu et al. (2013). We confirm these observations in our sample, see supplementary data in sectionVI. Here it is important to take into account the considerable red-shift of the direct bandgap as the temperature increases Korn et al. (2011). We have therefore performed time and polarization resolved photoluminescence excitation (PLE) experiments, see figure 3, to vary the initially generated polarization P0. The time-integrated PL is detected at its peak energy (1.867 eV and 1.828 eV at T=4 K and 300 K respectively). As already observed by different groups Mak et al. (2012); Zeng et al. (2012); Kioseoglou et al. (2012); Sallen et al. (2012) the PL circular polarization degree and thus the valley initialization decrease at T=4 K (figure 3a) when the laser excitation energy increases : it varies for the sample investigated here from for eV down to a value close to zero for eV, similar to the findings by Kioseoglou et al. (2012). Here we observe that slightly increases again up to for eV. Though the polarization minimum is observed roughly in the region where the B-exciton is photogenerated (see the vertical dotted line), its origin needs further clarification since the B-exciton absorbs and emits the same light helicity as the A-exciton in a given K valley Cao et al. (2012); Xiao et al. (2012). The energetically close lying indirect transition from the valley valence band to the conduction band, which is unpolarized, could play a role Kormányos et al. (2013); Zhu et al. (2013). When comparing results obtained on different samples in the literature Mak et al. (2012); Zeng et al. (2012); Sallen et al. (2012); Wu et al. (2013); Kioseoglou et al. (2012), it is important to take into account the laser excitation (power, pulsed or cw) and the exact form of the emission spectrum, see sectionVI.
A key result is presented in figure 3b. We perform the same PLE experiments as in figure 3a, but at room temperature. When the laser is far from resonance, we observe close to zero polarization. Remarkably, as we lower the laser energy and become more and more resonant, the polarization drastically increases, in the same manner as at 4K. For the closest energy to resonance that was achievable in practice with our set-up (filter cut-off for stray laser light), we measure an emission polarization of , close to the maximum observed at 4K of pol . This is very encouraging as optical initialization of valley polarization with a suitable excitation source can therefore be very efficient even at room temperature. Here it would be extremely useful to investigate how the strong Coulomb interaction Cheiwchanchamnangij and
Lambrecht (2012); Ramasubramaniam (2012); Mak et al. (2013); Crowne et al. (2013) influences the polarization at 300K.
IV Discussion
The few time resolved measurements reported in the literature for 1ML MoS2 use highly non-resonant excitation and did not analyse the polarization of the emission Korn et al. (2011); Shi et al. (2013); Wang et al. (2012b). In Mak et al. (2012) and Shi et al. (2013) the authors suggest that non-radiative recombination of the excitons could explain the first, short decay observed from 4K to 300K. We can infer from our time and polarization resolved measurements that the detected polarization in time-integrated experiments is due to the emission during this short time window. If this initial decay is indeed limited by non-radiative processes or an intrinsic exciton lifetime is still an open question. The exciton binding energy is estimated to be in the hundreds of meV range Cheiwchanchamnangij and Lambrecht (2012); Ramasubramaniam (2012); Crowne et al. (2013). Systems with large exciton binding energies such as organic films and carbon nanotubes have intrinsic exciton radiative lifetimes on the order of a few ps Varene et al. (2012); Perebeinos et al. (2005); Watanabe et al. (1997). In our measurements the PL decay time does not change with temperature within our time resolution, we do not observe any activation or any other typical signature of non-radiative processes. For comparison, for high quality GaAs quantum well structures the free Wannier-exciton radiative recombination time increases with temperature Feldmann et al. (1987).
An argument in favour of a radiative exciton decay within a few ps comes from the observation of the B-exciton emission, 150meV higher in energy than the A-exciton Mak et al. (2012); Sallen et al. (2012), as radiative recombination of the B-exciton is in competition with non-radiative decay and relaxation to the A-exciton. Here a theoretical prediction of the intrinsic exciton recombination is needed to guide future experiments in this promising system.
In the future also the influence of the substrate on the polarization dynamics needs to be investigated. Here we used MoS2 MLs on SiO2, the most practical substrate for (opto-)electronic devices. Although time resolved experiments on suspended MoS2 MLs gave similar time-resolved absorption results to experiments using substrates Shi et al. (2013), a comparison with MoS2 on BN where the localised exciton emission was suppressed Mak et al. (2012, 2013) would be important to clarify the nature of the observed PL emission.
The very fast exciton decay time measured here in MoS2 MLs could help explaining several key observations: (i) application of a transverse magnetic fields will only shown an influence on the polarization of the ML PL if the precession time is shorter than 4ps Sallen et al. (2012). (ii) Coherence between valley excitons probed through the observation of stationary, linearly polarized luminescence in related WSe2 devices, which are expected to have similar physical properties Jones et al. (2013).
V Acknowledgements
We acknowledge partial funding from ERC Starting Grant No. 306719, Programme Investissements d’Avenir ANR-11-IDEX-0002-02, reference ANR-10-LABX-0037-NEXT, and CAS Grant No. 2011T1J37, and the National Basic Research Program of China (2009CB930502, 2009CB929301) and National Science Foundation of China [Grants No. 11174338, No. 11225421, No. 10934007 and No. 10911130356 (Spinman)]. Delphine Lagarde and Louis Bouet contributed equally to this work.
VI Supplementary Material
In this supplementary material we present additional, power dependent results obtained under pulsed and a continuous wave excitation conditions at 4K and room temperature in a MoS2 monolayer sample.
Optical spectroscopy of MoS2 monolayers is carried out either with standard continuous wave (cw) lasers such as the HeNe laser (1.96eV) or with tunable pulsed lasers such as a ps frequency-doubled optical parametric oscillator synchronously pumped by a mode-locked Ti:Sa laser (OPO), see main text and the work by Kioseoglou et al. (2012). The laser power used in the experiments is dictated by practical considerations: at low power the signal level has to be sufficient to achieve a high signal-to-noise ratio, at high excitation power structural damage of the MoS2 monolayer has to be avoided. To the best of our knowledge their is no systematic study of the power dependence of the circular polarization degree of the photoluminescence of ML MoS2. In the experiments below we demonstrate that the laser excitation power range used for the results presented in the main text is still within the linear absorption regime (below saturation) and does not induce any measurable sample heating or degradation.
VI.1 Experiments using pulsed Laser excitation
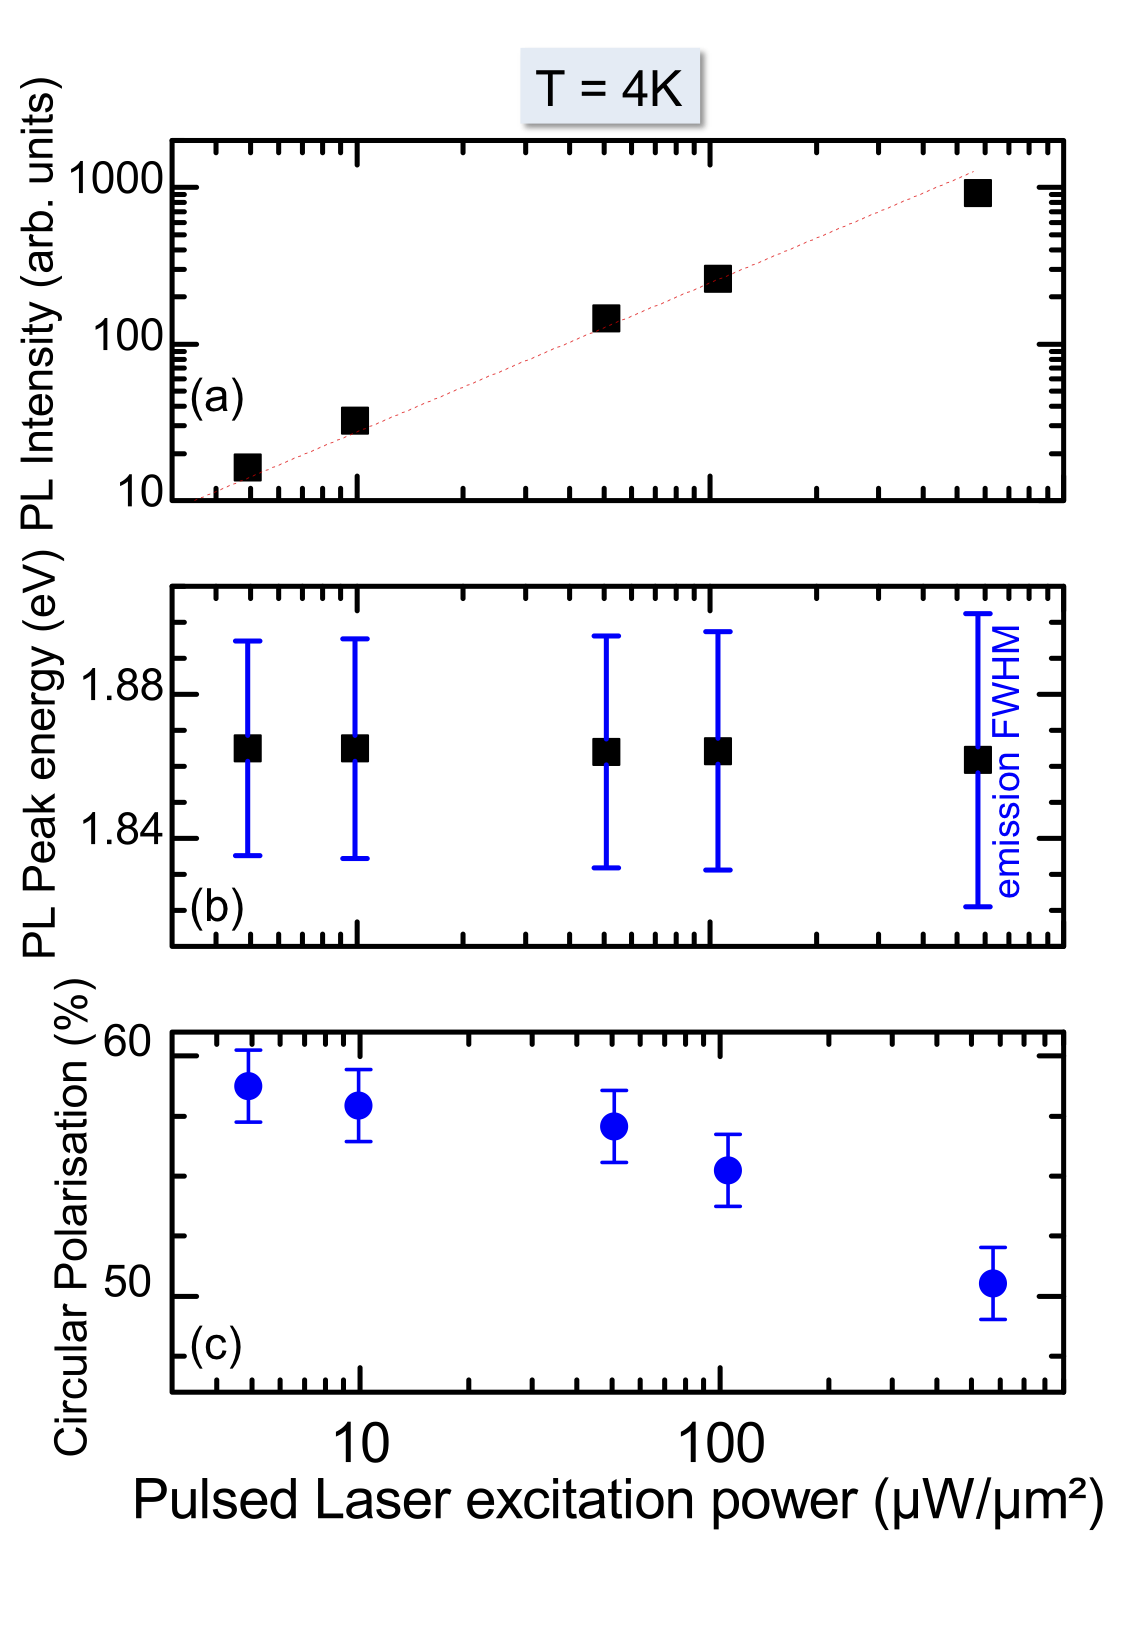
The power of the OPO used in the experiments in the main text was chosen to provide high signal-to-noise ratio time resolved photoluminescence (TRPL) spectra without causing sample damage. In general, time resolved measurements using a streak-camera demand a higher signal level than time-integrated measurements using a sensitive Si-CCD camera. In figure S1(a) we show the PL intensity as a function of laser power over 2 orders of magnitude detected with the streak camera system i.e. under the same conditions as the data in figure 1 of the main text. The absorption is not saturated for the laser power values used in time resolved spectroscopy, see figure 1 of the main text, where P corresponds to the highest power used in figure S1.
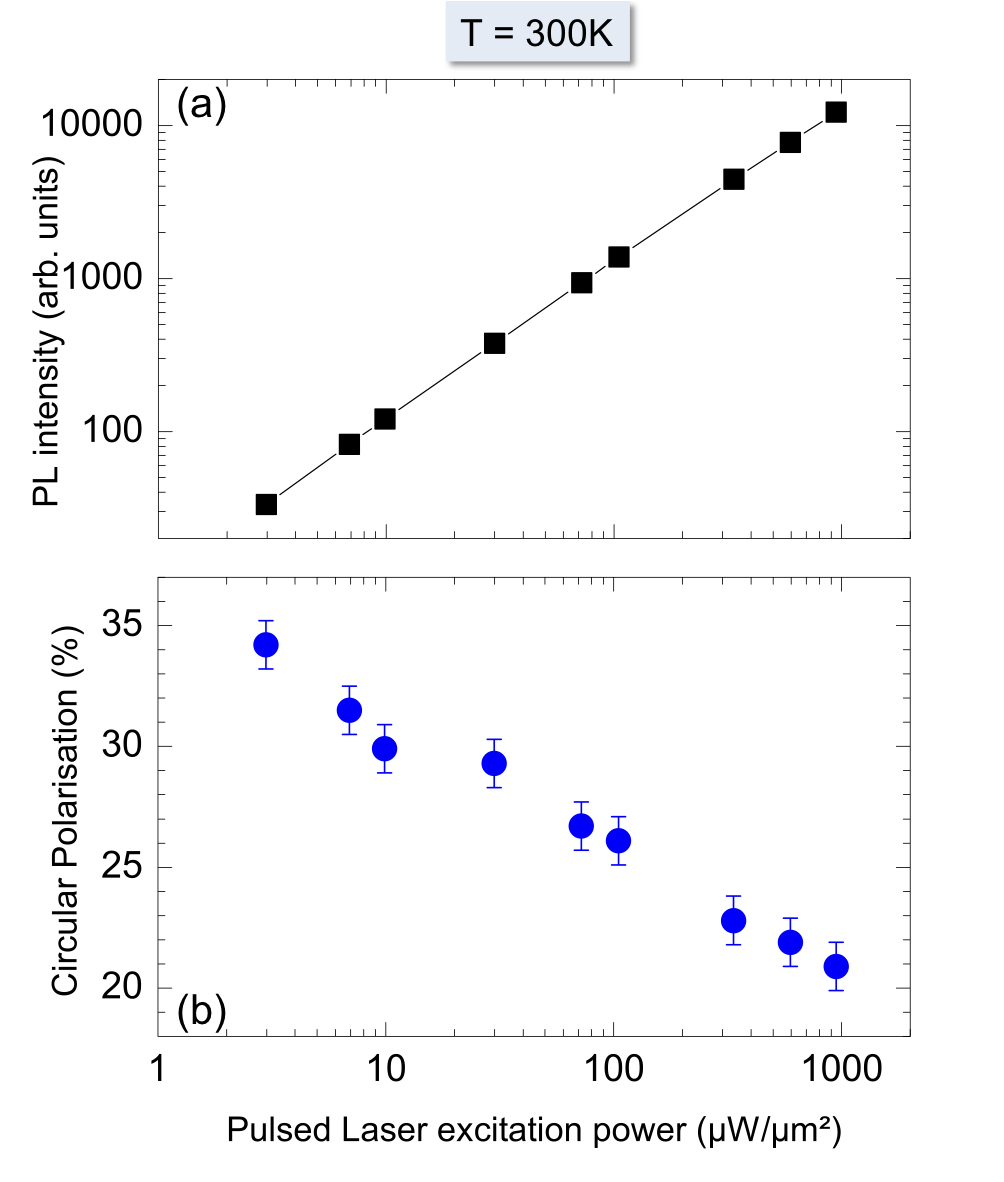
We find as a general trend that the PL polarization decreases as the laser power increases, a shown in figure S1(c). The transition energy is constant for the laser power range investigated, see figure S1(b). We therefore conclude that sample lattice heating is an unlikely cause of this polarization decrease, it is possible that depolarization due to a Dyakonov-Perel type mechanism plays a role.
At a temperature of 300K the optical emission of the MoS2 monolayer is weaker than at 4K. In order to obtain an acceptable signal to noise ratio for the PL at low laser power, we performed the power dependent studies at 300K using a sensitive Si-CCD camera at a detection energy of 1.828 eV for a laser energy of 1.913 eV. In figure S2(a) we confirm that also at 300K we are still working in the linear absorption regime. In figure S1(b) we show a decrease of the circular PL polarization degree as the laser power increases, similar to the trend shown at low temperature.
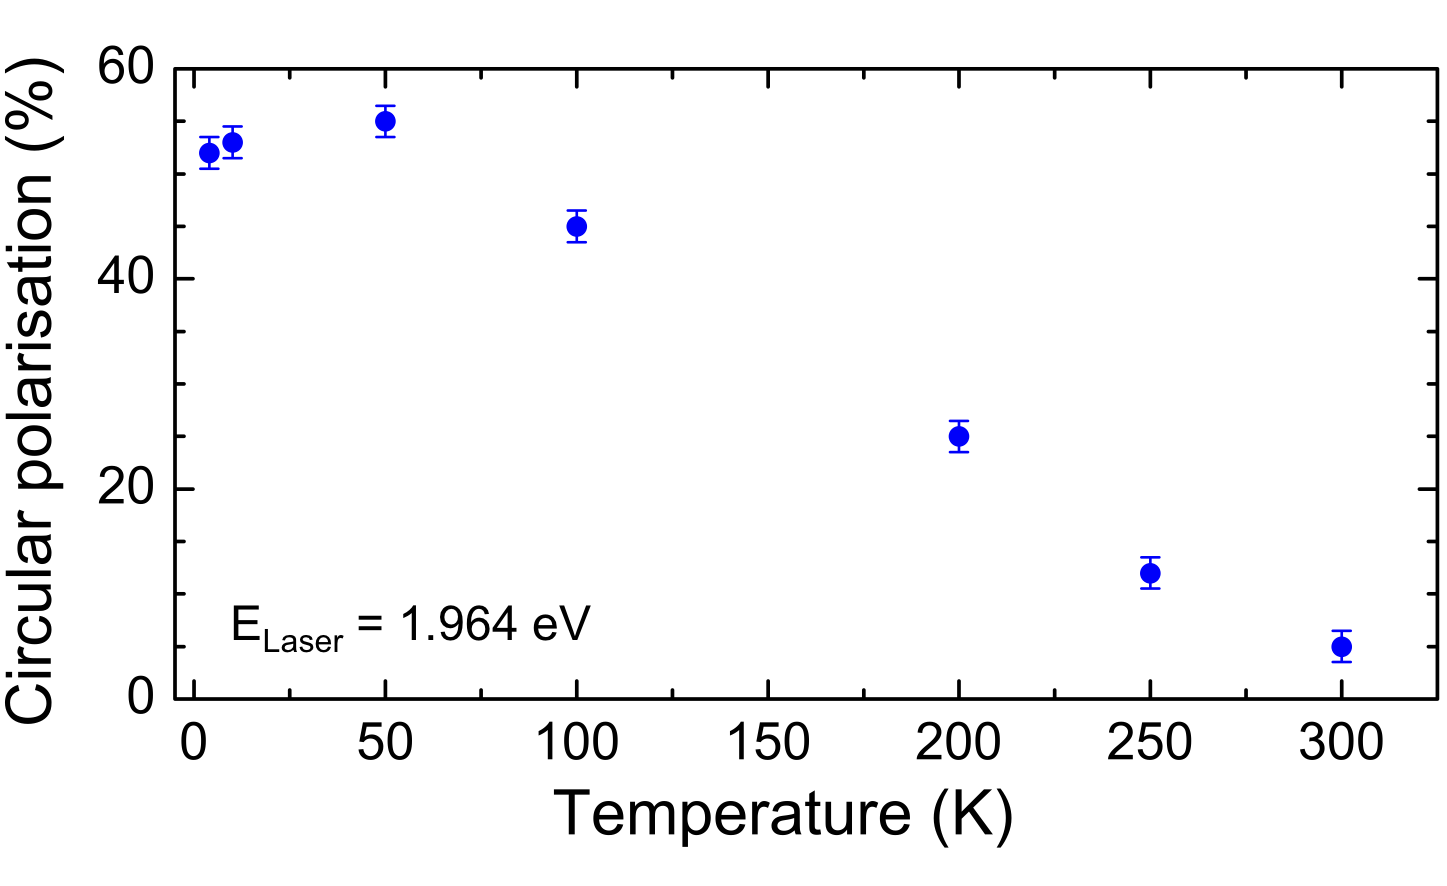
As previously reported in the literature Mak et al. (2012); Zeng et al. (2012); Sallen et al. (2012); Wu et al. (2013), we observe a decrease in our sample of the circular PL polarization as a function of temperature, see figure S3. Here the laser energy is kept constant and does not follow the bandgap shrinking with temperature.
VI.2 Experiments using cw Helium-Neon laser excitation
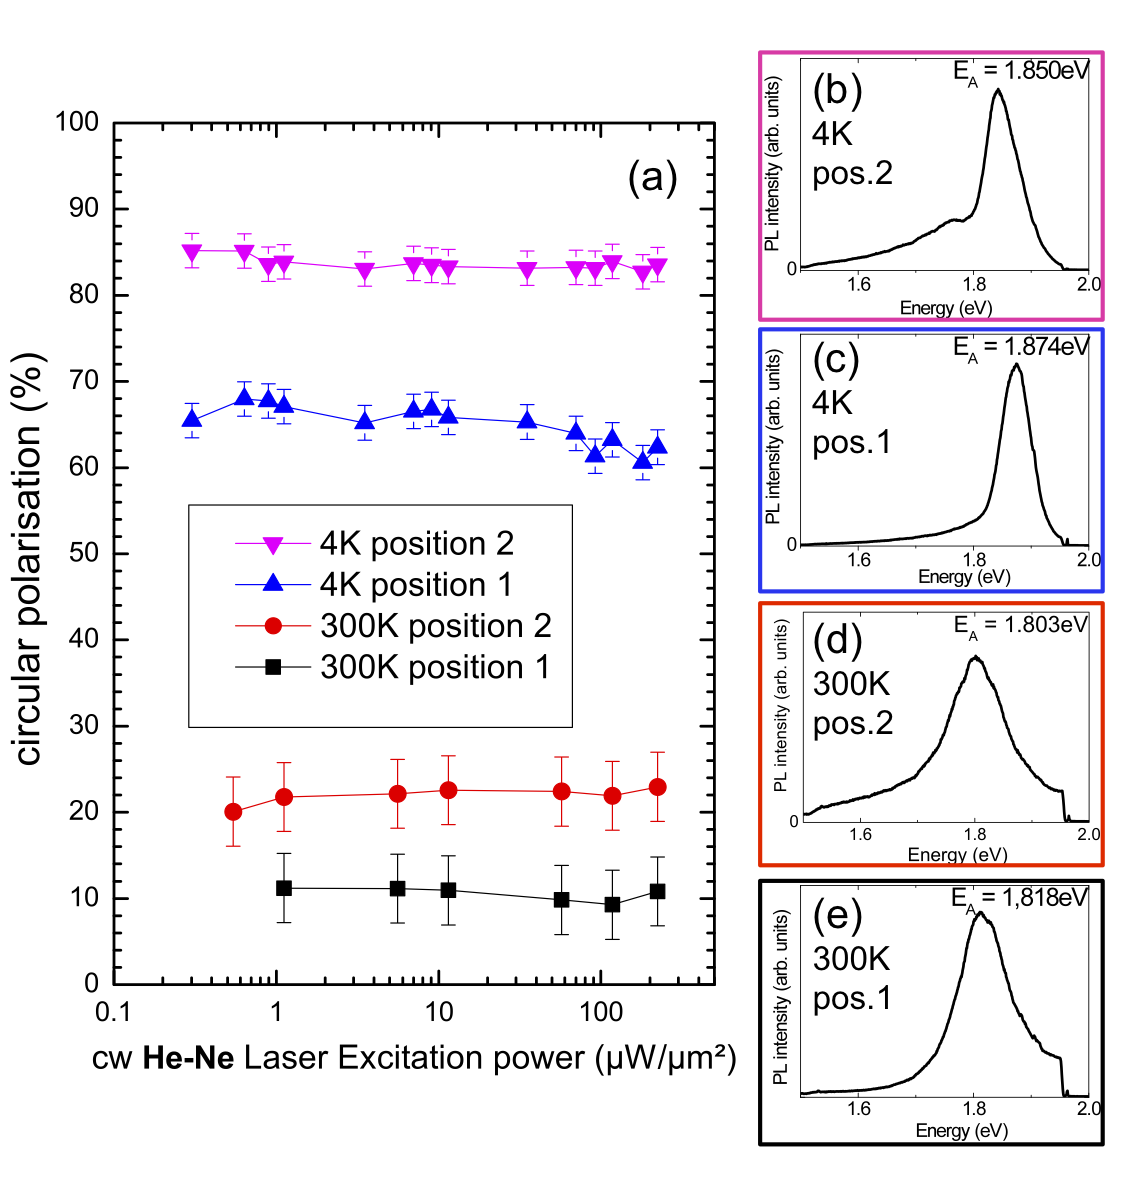
Very high PL polarization under cw HeNe laser excitation at 4K and at 300K has been reported before Mak et al. (2012); Sallen et al. (2012) and is confirmed in figure S4(a). First, the laser emission is spectrally narrower than the pulsed OPO. Second, although the average laser power monitored with a photodiode, which is used to measure the laser power plotted in figure S1 and S2, might be comparable in the experiments, the power is several orders of magnitude lower than the peak power in pulsed operation. Here we use the same set-up as in our previous work Sallen et al. (2012), but a different sample. Over the investigated power range the polarization does not change drastically, in contrast to the measurements with the OPO excitation. This seems to indicate that the generation rate with the OPO at the lowest power is still much higher than the HeNe generation rate at its maximum.
Our confocal microscope is also used for spectroscopy on single semiconductor quantum dots (typical diameter 20nm) Urbaszek et al. (2013) and due the high spatial resolution we are able to investigate different regions of the same MoS2 monolayer as the sample is mounted on piezo-positioners with a step-size in nm-range in a variable temperature cryostat. We find measurable variations of the polarization for different positions in the monolayer: The first type of spectra have a more pronounced A-exciton emission and only a very small contribution of the localized exciton. Analysing the A-exciton emission, we find on the order of 70% at 4K and 10% at 300K, see figure S3. The second type of spectra is about 15 meV red-shifted with a more pronounced contribution of localized excitons. Here the A-exciton emission is more polarized, with on the order of 85% at 4K and 25% at 300K, close to the values reported in Sallen et al. (2012). Please note that we cannot directly compare the PL polarization measured in figures S1 and S2 (OPO excitation) with the results in figure S4 (HeNe excitation at 1.96eV) as the laser energies are different and the polarization changes abruptly for different energies (see main text).
References
- Radisavljevic et al. (2011) B. Radisavljevic, A. Radenovic, J. Brivio, V. Giacometti, and A. Kis, Nature. Nanotech. 6, 147 (2011).
- Wang et al. (2012a) H. Wang, L. Yu, Y. Lee, W. Fang, A. Hsu, P. Herring, M. Chin, M. Dubey, L. Li, J. Kong, et al., in Electron Devices Meeting (IEDM), 2012 IEEE International (2012a), pp. 4.6.1–4.6.4, ISSN 0163-1918.
- Kumar et al. (2013) N. Kumar, S. Najmaei, Q. Cui, F. Ceballos, P. M. Ajayan, J. Lou, and H. Zhao, Phys. Rev. B 87, 161403 (2013), URL http://link.aps.org/doi/10.1103/PhysRevB.87.161403.
- Sundaram et al. (2013) R. S. Sundaram, M. Engel, A. Lombardo, R. Krupke, A. C. Ferrari, P. Avouris, and M. Steiner, Nano Letters 13, 1416 (2013), eprint http://pubs.acs.org/doi/pdf/10.1021/nl400516a, URL http://pubs.acs.org/doi/abs/10.1021/nl400516a.
- Mak et al. (2010) K. F. Mak, C. Lee, J. Hone, J. Shan, and T. F. Heinz, Phys. Rev. Lett. 105, 136805 (2010).
- Splendiani et al. (2010) A. Splendiani, L. Sun, Y. Zhang, T. Li, J. Kim, C.-Y. Chim, G. Galli, and F. Wang, Nano Letters 10, 1271 (2010).
- Zhu et al. (2011) Z. Y. Zhu, Y. C. Cheng, and U. Schwingenschlögl, Phys. Rev. B 84, 153402 (2011).
- Cao et al. (2012) T. Cao, G. Wang, W. Han, H. Ye, C. Zhu, J. Shi, Q. Niu, P. Tan, E. Wang, B. Liu, et al., Nature Communications 3, 887 (2012).
- Xiao et al. (2012) D. Xiao, G.-B. Liu, W. Feng, X. Xu, and W. Yao, Phys. Rev. Lett. 108, 196802 (2012).
- Li et al. (2013) X. Li, F. Zhang, and Q. Niu, Phys. Rev. Lett. 110, 066803 (2013), URL http://link.aps.org/doi/10.1103/PhysRevLett.110.066803.
- Cheiwchanchamnangij and Lambrecht (2012) T. Cheiwchanchamnangij and W. R. L. Lambrecht, Phys. Rev. B 85, 205302 (2012), URL http://link.aps.org/doi/10.1103/PhysRevB.85.205302.
- Ramasubramaniam (2012) A. Ramasubramaniam, Phys. Rev. B 86, 115409 (2012), URL http://link.aps.org/doi/10.1103/PhysRevB.86.115409.
- Mak et al. (2013) K. F. Mak, K. He, Changgu, G. H. Lee, J. Hone, T. F. Heinz, and J. Shan, Nature Materials 12, 207 (2013).
- Crowne et al. (2013) F. J. Crowne, M. Amani, A. G. Birdwell, M. L. Chin, T. P. O’Regan, S. Najmaei, Z. Liu, P. M. Ajayan, J. Lou, and M. Dubey, Phys. Rev. B 88, 235302 (2013), URL http://link.aps.org/doi/10.1103/PhysRevB.88.235302.
- Xiao et al. (2010) D. Xiao, M.-C. Chang, and Q. Niu, Rev. Mod. Phys. 82, 1959 (2010), URL http://link.aps.org/doi/10.1103/RevModPhys.82.1959.
- Ochoa and Roldán (2013) H. Ochoa and R. Roldán, Phys. Rev. B 87, 245421 (2013), URL http://link.aps.org/doi/10.1103/PhysRevB.87.245421.
- Wang and Wu (2013) L. Wang and M. W. Wu, e-print arXiv:1305.3361 (2013).
- Mak et al. (2012) K. F. Mak, K. He, J. Shan, and T. F. Heinz, Nat. Nanotechnol. 7, 494 (2012).
- Zeng et al. (2012) H. Zeng, J. Dai, W. Yao, D. Xiao, and X. Cui, Nat. Nanotechnol. 7, 490 (2012).
- Sallen et al. (2012) G. Sallen, L. Bouet, X. Marie, G. Wang, C. R. Zhu, W. P. Han, Y. Lu, P. H. Tan, T. Amand, B. L. Liu, et al., Phys. Rev. B 86, 081301 (2012), URL http://link.aps.org/doi/10.1103/PhysRevB.86.081301.
- Kioseoglou et al. (2012) G. Kioseoglou, A. T. Hanbicki, M. Currie, A. L. Friedman, D. Gunlycke, and B. T. Jonker, Applied Physics Letters 101, 221907 (pages 4) (2012), URL http://link.aip.org/link/?APL/101/221907/1.
- Wu et al. (2013) S. Wu, C. Huang, G. Aivazian, J. S. Ross, D. H. Cobden, and X. Xu, ACS Nano 7, 2768 (2013), eprint http://pubs.acs.org/doi/pdf/10.1021/nn4002038, URL http://pubs.acs.org/doi/abs/10.1021/nn4002038.
- Meier and Zakharchenya (1984) F. Meier and B. Zakharchenya, Modern Problems in Condensed Matter Sciences (North-Holland, Amsterdam). 8 (1984).
- Novoselov et al. (2005) K. S. Novoselov, D. Jiang, F. Schedin, T. J. Booth, V. V. Khotkevich, S. V. Morozov, and A. K. Geim, Proc. Natl Acad. Sci. USA 102, 10451 (2005).
- Sallen et al. (2011) G. Sallen, B. Urbaszek, M. M. Glazov, E. L. Ivchenko, T. Kuroda, T. Mano, S. Kunz, M. Abbarchi, K. Sakoda, D. Lagarde, et al., Phys. Rev. Lett. 107, 166604 (2011).
- (26) The A exciton emission is most likely dominated by the negatively charged A- emission, with a weaker contribution from the neutral exciton emission A0. The emission of both complexes is strongly polarized due to the chiral optical selection rules in monolayer MoS2 Mak et al. (2013).
- Korn et al. (2011) T. Korn, S. Heydrich, M. Hirmer, J. Schmutzler, and C. Schüller, Applied Physics Letters 99, 102109 (2011).
- Shi et al. (2013) H. Shi, R. Yan, S. Bertolazzi, J. Brivio, B. Gao, A. Kis, D. Jena, H. G. Xing, and L. Huang, ACS Nano 7, 1072 (2013), eprint http://pubs.acs.org/doi/pdf/10.1021/nn303973r, URL http://pubs.acs.org/doi/abs/10.1021/nn303973r.
- Kormányos et al. (2013) A. Kormányos, V. Zólyomi, N. D. Drummond, P. Rakyta, G. Burkard, and V. I. Fal’ko, Phys. Rev. B 88, 045416 (2013), URL http://link.aps.org/doi/10.1103/PhysRevB.88.045416.
- Zhu et al. (2013) C. R. Zhu, G. Wang, B. L. Liu, X. Marie, X. F. Qiao, X. Zhang, X. X. Wu, H. Fan, P. H. Tan, T. Amand, et al., Phys. Rev. B 88, 121301 (2013).
- (31) Substantial broadening, and hence overlap of the transitions at 300K can lower the efficiency of valley polarization generation during absorption.
- Wang et al. (2012b) R. Wang, B. A. Ruzicka, N. Kumar, M. Z. Bellus, H.-Y. Chiu, and H. Zhao, Phys. Rev. B 86, 045406 (2012b), URL http://link.aps.org/doi/10.1103/PhysRevB.86.045406.
- Varene et al. (2012) E. Varene, L. Bogner, C. Bronner, and P. Tegeder, Phys. Rev. Lett. 109, 207601 (2012), URL http://link.aps.org/doi/10.1103/PhysRevLett.109.207601.
- Perebeinos et al. (2005) V. Perebeinos, J. Tersoff, and P. Avouris, Nano Letters 5, 2495 (2005), eprint http://pubs.acs.org/doi/pdf/10.1021/nl051828s, URL http://pubs.acs.org/doi/abs/10.1021/nl051828s.
- Watanabe et al. (1997) K. Watanabe, T. Asahi, H. Fukumura, H. Masuhara, K. Hamano, and T. Kurata, The Journal of Physical Chemistry B 101, 1510 (1997), eprint http://pubs.acs.org/doi/pdf/10.1021/jp9609287, URL http://pubs.acs.org/doi/abs/10.1021/jp9609287.
- Feldmann et al. (1987) J. Feldmann, G. Peter, E. O. Göbel, P. Dawson, K. Moore, C. Foxon, and R. J. Elliott, Phys. Rev. Lett. 59, 2337 (1987), URL http://link.aps.org/doi/10.1103/PhysRevLett.59.2337.
- Jones et al. (2013) A. Jones et al., Nat. Nanotechnol. 8, 634 (2013).
- Urbaszek et al. (2013) B. Urbaszek, X. Marie, T. Amand, O. Krebs, P. Voisin, P. Maletinsky, A. Högele, and A. Imamoglu, Rev. Mod. Phys. 85, 79 (2013), URL http://link.aps.org/doi/10.1103/RevModPhys.85.79.