Stress-induced modification of the boson peak scaling behavior
Abstract
The scaling behavior of the so-called boson peak in glass-formers and its relation to the elastic properties of the system remains a source of controversy. Here, the boson peak in a binary reactive mixture is measured by Raman scattering (i) on cooling the unreacted mixture well below its glass transition temperature and (ii) after quenching to very low temperature the mixture at different times during isothermal polymerization. These different paths to the glassy phase are able to generate glasses with different amounts of residual stresses, as evidenced by the departure of the elastic moduli from a Cauchy-like relationship. We find that the scaling behavior of the boson peak with the properties of the elastic medium — as measured by the Debye frequency — holds for states in which the system is able to release internal stress and breaks down in the presence of residual stresses. These findings provide new insight into the boson peak behavior and are able to reconcile the apparently conflicting results presented in literature.
Keywords: Glass-formers, vibrational density of states, elastic moduli, residual stress, Raman scattering, Brillouin light scattering
![[Uncaptioned image]](/html/1308.0636/assets/x1.png)
I Introduction
It is now well established that the density of vibrational states, , of amorphous materials differs in a characteristic way from that of crystalline ones. Whereas the low frequency in crystals is well predicted by the Debye model, the lack of long-range periodicity is responsible for the universal presence, in amorphous materials, of an excess contribution over the Debye prediction, evidenced as a peak in the reduced — the so-called boson peak (BP). This anomalous feature appears in the signal detected by several techniques, such as inelastic neutron scattering FrickSCIENCE1995 , calorimetry ZellerPRB1971 , nuclear inelastic scattering MonacoPRL2006hyp ; MonacoPRL2006den , Mössbauer AchterholdPRE2002 , Raman SokolovPRB1995 and hyper-Raman spectroscopy SimonPRL2006 ; HehlenJRS2012 . Despite the long-standing interest in this characteristic feature, its origin still remains a source of controversy ParshinPRB2007 ; SchirmacherPRL2007 ; TanakaNATURE2008 ; RuoccoSCIREP2013 ; Zanatta2011 ; Baldi2009 ; Ruffle2010 ; Chumakov2011 .
An approach that conveys information without invoking any model is studying the changes of these excess vibrational modes under the application of external stimuli such as temperature and pressure, or by varying the sample conditions such as the volume available to the system, the thermal history or the number of bonds between the molecules. Without exception, available results are all in agreement Zanatta2011 ; Baldi2009 ; Ruffle2010 ; Chumakov2011 ; Zanatta2010 ; RossiJPCB2012 ; CaponiPRL2009 ; MonacoPRL2006den ; NissPRL2007 ; MonacoPRL2006hyp ; Hong2008 ; CaponiJPCM2007 : the BP shifts towards higher frequencies and decreases in intensity when the sample becomes stiffer (increase of elastic constants). Recently, it has been proposed to quantitatively test the role played by the changes in the elastic properties by scaling the BP data with the Debye frequency, a quantity defined by the elastic medium. The question of whether such a scaling is able to generate a master curve of the data, and hence, the variations of can be explained in terms of elastic medium transformations is still highly debated. So far, the accumulated evidence is apparently in favor of opposite views: on one hand, the BP evolution in sodium silicate glasses (cooled Baldi2009 , compressed Chumakov2011 , hyperquenched MonacoPRL2006hyp and permanently densified samples MonacoPRL2006den ) and in an epoxy-amine mixture during chemical vitrification CaponiPRL2009 is controlled by changes in the system’s elasticity, according to the Debye scaling law; on the other hand, the BP variations in network forming glasses like silica and GeO2 upon cooling Ruffle2010 ; Zanatta2011 ; CaponiPRB2007 , in permanently densified silica Zanatta2010 , and in few polymers under pressure NissPRL2007 ; Hong2008 are stronger than the elastic medium transformation, and the Debye scaling does not work. In light of such controversial results the question we face is the following: Do these results really conflict, or rather there is a general explanation in terms of the elastic properties of the systems?
It is well known that by changing the thermal history or the thermodynamic path to the glass transition the obtained glasses present different elastic properties, both in term of sound velocity and in term of acoustic attenuation LevelutPRB2006 ; CaponiPRB2004 , because of the different amount of internal stresses that develop for the inability of the system to comply with the need to contract under external stimuli WithersRPP2007 ; Tesi ; Kruger2003 ; BallauffPRL2013 . The stress-induced modification of elastic properties in the glass can influence the vibrational dynamics and may have a role in the evolution of the BP. So far this issue has never been considered but here we clearly demonstrate, for the first time, the occurrence of a stress-induced modification in the BP scaling behavior of glasses. Starting from a reactive mixture in the fluid phase, and combining the system’s ability to achieve the glassy phase both by decreasing the temperature (thermal vitrification) and by increasing the number of bonds among the constituent monomers (chemical vitrification CorezziNATURE2002 ; CorezziPRL2005 ; CorezziPRL2006 ), we generate glasses with progressively different, either increasing or decreasing, residual stresses. The introduction of significant levels of internal stress in the system leads to a clear departure of the elastic moduli from the generalized Cauchy relation. Our results from Raman (RS) and Brillouin light scattering (BLS) provide evidence that the scaling of the BP with the properties of the elastic medium — as measured by the Debye frequency — breaks down when the Cauchy-like relationship starts failing, and tends to be recovered when the amount of residual stress is reduced.
II Experiments
Our system is an epoxy-amine mixture of diglycidyl ether of bisphenol-A (DGEBA) and diethylenetriamine (DETA) in the 5:2 stoichiometric ratio. The two monomer types are mutually reactive and polymerize by stepwise addition with a rate of reaction strongly controlled by the temperature. At =275 K the reaction runs out in days. The polymerization proceeds until the particles diffuse and the unreacted sites can become close to each other, then stopping when the average particle diffusion decreases to vanishing levels CorezziJPCB2010 ; CorezziPOLYMER2010 . Therefore, the system spontaneously evolves into a glassy structure (in the reacted mixture K). As shown in ref. CaponiPRL2009, , throughout the isothermal reaction the BP scaling law remains Debye-controlled and the elastic moduli follow (within the errors) the Cauchy-like relation. At any time during the polymerization, however, the system — as a usual glass former — can also be forced to reach the glassy phase by decreasing the temperature. Exploiting this versatility, we have designed the following two experiments to push the system into states with different amounts of residual stress: (i) The first is a cooling experiment of the unreacted mixture from above to well below the glass transition (=231 K). The freshly prepared mixture is progressively cooled from 275 K to 80 K, each temperature step is performed at K min-1. Since the rate of reaction at lower temperature is further reduced, the advancement of reaction is prevented and only the thermal vitrification route remains viable. The system is always in equilibrium above , while the chosen cooling rate is fast enough to induce an increasing amount of unrelaxed stress in the glassy structure when the temperature is decreased below Kruger2003 . (ii) The second is a quench experiment performed during the isothermal polymerization of the mixture. At different times as reaction proceeds at 275 K, the partially polymerized mixture is quenched to 73 K at K min-1 and then brought back to the reaction . The effect of an isothermal polymerization is combined with the effect of cooling in order to obtain at the same glasses with higher polymerization level and decreasing amount of unrelaxed stress.
In all experiments, the two reagents were mixed and stirred for about 2 min, and then transferred in the measurement cell (a cylindrical pyrex vial of inner diameter 10 mm). Raman spectra were acquired in the frequency range cm-1, using a Jobin Yvon U1000 in the HV and VV polarization geometries, where V and H indicate the polarization perpendicular and parallel to the scattering plane. At temperatures lower than 220 K the subtraction of a luminescence background was needed to restore the symmetry of the Stokes and anti-Stokes intensities after reduction by , where is the Bose population factor. The reduced spectra were then normalized to the intensity of the molecular vibration peaks at high frequency ( cm-1). The depolarization ratio, , has the constant value in the frequency range 5-100 cm-1, independent of temperature and consistent with the value that we measured during the polymerization process. The depolarized Raman intensity has been used to obtain a quantity proportional to the reduced density of vibrational states , following the same procedure as in ref. CaponiPRL2009, . In particular, the quasielastic scattering contribution has been described with a Lorentzian tail YannopoulosPRE2002 , subtracted from the total signal, and the remaining vibrational component has been related to through the effective relation , where is the Raman coupling function that we reasonably approximate as for frequencies around the BP maximum SokolovPRB1995 ; SurovtsevPRB2002 ; SurovtsevPRB2003 ; FontanaJPCM2007 ; SchulteVIB2008 and assume not to change appreciably with CaponiPRB2007 ; SokolovPRB1995 .
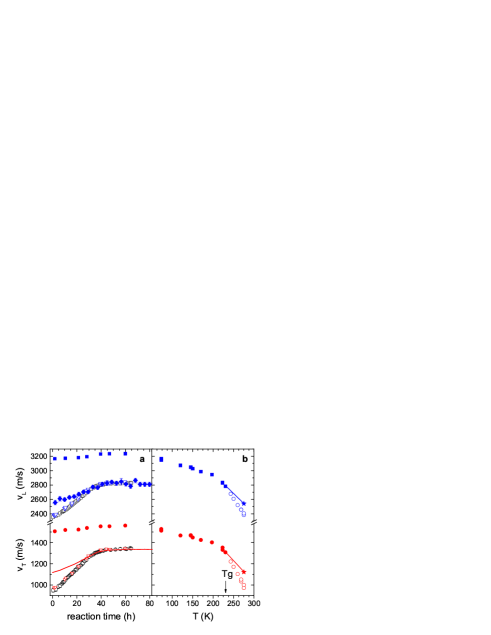
Brillouin spectra were acquired in the –scattering geometry using a Sandercock-type 3+3-pass tandem Fabry-Pérot interferometer, with =532 nm and no selection of the polarization for the scattered light (VU). This configuration allows to detect both longitudinal acoustic modes, which scatter light without change of polarization, and transverse acoustic modes, which scatter light with change of polarization. The corresponding sound velocities have been calculated as , where are the frequencies of the acoustic modes, the refractive index of the sample, and the scattering angle. The resulting values have been processed along with the results of previous BLS and IXS experiments CaponiPRL2009 , in order to obtain the longitudinal and transverse sound velocities in the high-frequency, solid-like limit (details are given in the Appendix).
III Results
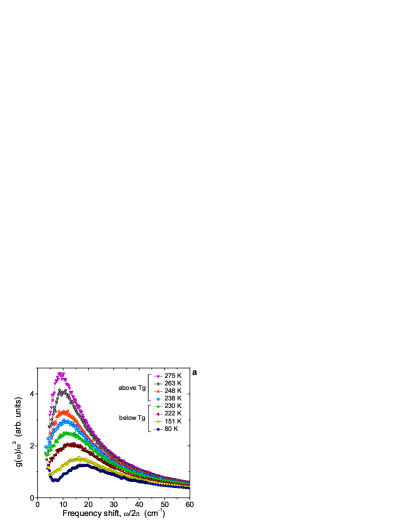
Fig. 1(a) shows the obtained for the unreacted mixture in a wide temperature range, above and below the glass transition. The BP evolution is clearly visible: as the temperature decreases, the BP shifts towards higher frequencies and decreases in intensity. The change is of in frequency position and in height when decreases from 275 to 80 K.
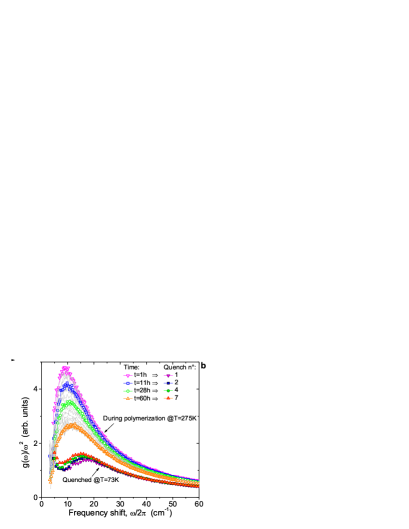
Fig. 1(b) shows the same quantity, , measured during the polymerization at 275 K, and after quenching at 73 K the sample at different extents of polymerization. On increasing the number of covalent bonds under constant and the system changes from liquid to glass and the BP shows qualitatively similar changes to those observed on cooling the unreacted mixture. However, the BP evolution of the quenched states reveals a non-trivial behavior. In fact, each quench produces, as expected, an additional moving of the BP position toward higher frequencies and a significant decrease in height, but this effect has not the same entity at different extents of polymerization. Indeed, the first quench, performed after 1 hour of reaction, doubles the frequency of the BP maximum and reduces of times its intensity; the last quench, performed on the fully polymerized mixture after 60 hours of reaction, only increases of the frequency of the BP maximum and reduces of times its intensity. As a result, the BP measured at 73 K at increasing extents of polymerization shifts to lower frequencies and increases in height, clearly in contrast to the evolution that would be expected in equilibrium at fixed . In the following, we will consider these variations of the BP in relation to the transformation of the elastic medium.
To quantify the elastic medium transformation, we calculate the variations of the Debye frequency:
| (1) |
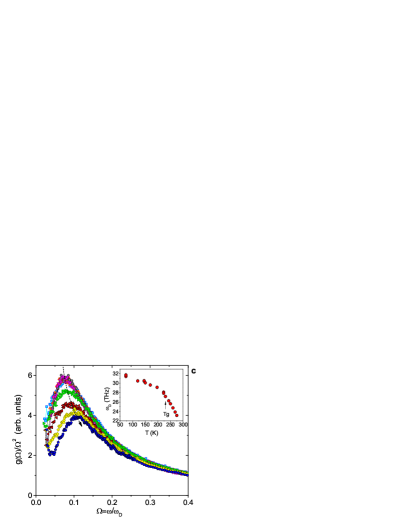
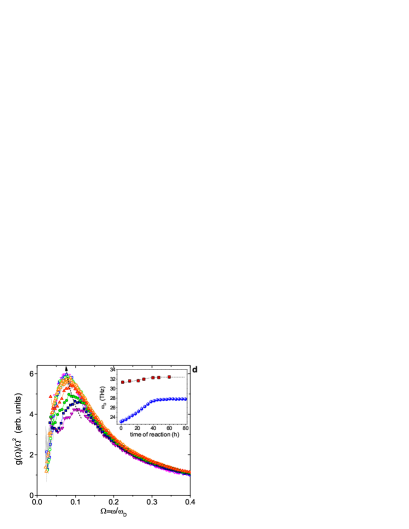
where is the Avogadro’s number, the average number of atoms per molecule in the sample, the average molar weight, and is the density, obtained using the procedure described in ref. Cauchy . is the Debye sound velocity, defined as , where and are the solid-like longitudinal and transverse sound velocities, respectively Baldi2009 ; CaponiPRL2009 . It should be emphasized that when the system undergoes a vitrification process, whether physical or chemical, the sound velocities become visco-elastic properties and acquire an intrinsic frequency dependence. While an inelastic x-ray scattering (IXS) experiment, performed in the THz frequency region, always probes , the sound velocities measured by BLS in the GHz frequency region are, in the fluid phase, still affected by viscoelastic effects and must be processed adequately in order to obtain and (see details in the Appendix). Using the density data and the proper values of sound velocities, we calculate the Debye frequencies reported in the inset of Fig. 1(c) and 1(d).
IV Discussion
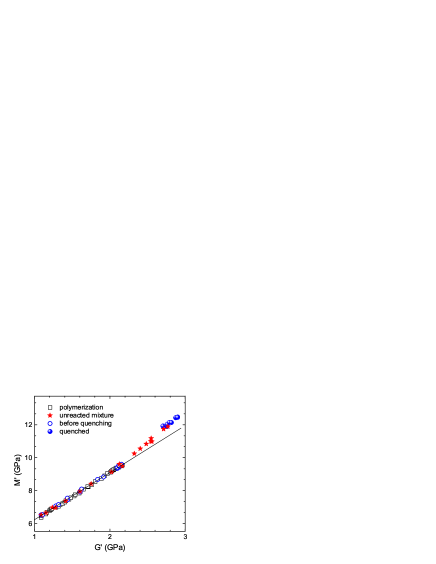
Figs. 1(c) and 1(d) show the evolution of the reduced density of vibrational states corrected for the elastic medium transformation, i.e. rescaled in Debye frequency units. It appears a more complex behavior than that so far reported in the literature, including regions of Debye scaling and regions of non-Debye scaling of the BP. The significance of this behavior emerges in connection with the behavior of the elastic moduli, shown in Fig. 2. The real part of the longitudinal and transverse modulus is measured by BLS as and , where and are the longitudinal and transverse sound velocities at the BLS frequency. It is known that the elastic properties of an isotropic amorphous system at equilibrium satisfy a generalized Cauchy-like relation, Cauchy ; KrugerPRB2002 ; PhilippJPCM2009 . Such relation is theoretically understood for any isotropic material in which particles interact by means of two-body central forces ZwanzigJCP1965 . It is known as well, on experimental basis, that stresses not released within an out-of-equilibrium glassy matrix not only induce altered values of the elastic moduli Tesi ; WithersRPP2007 but also change the relationship between them, leading to violation of the generalized Cauchy-like relation Kruger2003 . Although not yet theoretically understood, this behavior could be connected with the breakdown of ergodic assumption in the glassy state, and with the strong possibility that unrelaxed macroscopic stresses develop anisotropy in the material. As shown in Fig. 2, the relation that connects in our system the elastic moduli during the polymerization at 275 K also connects the moduli of the unreacted mixture for temperatures above . This linear relation therefore characterizes, independently from the stiffening path, the states in which the system is able to release internal stresses and is our tool to discriminate them from the stressed ones. As expected, the data clearly confirm the presence of residual stress in the glassy structure of the unreacted mixture below and in all the quenched states of the partially polymerized sample. In particular, the data for the unreacted mixture deviate from the Cauchy–like behavior by following a linear trend with slope higher than 3, indicating the onset of internal stress just below .
With this in mind, the behaviors in Figs. 1(c) and 1(d) can be read as follows. (i) In the cooling experiment, the corrections for the elastic medium completely remove the differences in the BP at temperatures above , where the system is able to release internal stresses. As decreases below , the system retains internal stresses, and correspondingly the Debye scaling for the BP breaks down. The influence of temperature on the BP becomes stronger than the transformation of the elastic medium, and specifically, the rescaled spectra progressively move to higher frequency and decrease in intensity [see the arrow in Fig. 1(c)], thus indicating an actual progressive loss of vibrational states compared to the system at equilibrium. (ii) In the quench experiment, internal stress is accumulated in the sample and the Debye-scaling properties that characterize both the liquid and the glassy phase of the isothermal polymerization get lost. Again, the BP in Debye units stays higher in frequency but lower in intensity compared to the master curve at equilibrium, confirming a deficit of vibrational states in the presence of a significant amount of internal stresses. However, it should be noted that in this case the rescaled spectra have an opposite trend [see the arrow in Fig. 1(d)]: they move to lower frequency and increase in intensity, suggesting an eventual match with the master curve generated in a stress-free condition. This indicates that reducing internal stresses tends to restore the Debye scaling of the BP.
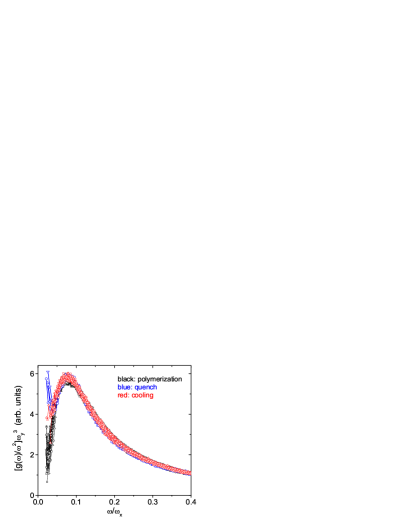
It is interesting to note that independently from the validity of the Debye scaling the spectral shape of the BP remains unchanged (Fig. 3). When the spectra do not scale with — i.e., when the representation vs. is no longer generating a master curve — the spectra can still be scaled on each other using different scaling factors for the BP position and intensity. This indicates that changes in the distribution of modes around the BP occur in a way that the scaled spectral shape remains essentially unaffected, despite the system undergoes strong changes of physical and chemical nature. Our case broadens the class of materials where invariance of the BP spectral shape has been observed MonacoPRL2006hyp ; MonacoPRL2006den ; Baldi2009 ; Ruffle2010 ; Zanatta2011 ; Zanatta2010 ; CaponiPRL2009 ; NissPRL2007 ; Hong2008 ; CaponiPRB2007 , and offers an example of invariance even against the formation of chemical bonds between the constituent molecules, suggesting that the BP distribution is a system’s characteristic.
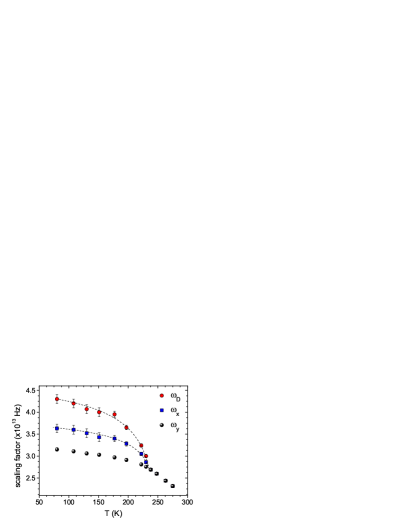
In the case of non-Debye scaling, by denoting with and the factors that scale, respectively, the BP position and intensity on the master curve generated in a stress-free condition, we always find in our system . This result is shown in Fig. 4 for the unreacted mixture as a function of . We remark that it is in agreement with the behavior of the BP position and intensity observed in silica as a function of , considering that silica becomes stiffer (higher elastic moduli) when increases Ruffle2010 . On the contrary, studies of BP as a function of pressure NissPRL2007 ; AndrikopoulosJNCS2006 report an increase with in the BP intensity relative to the Debye level () while the BP frequency in Debye units increases (). The difference in the intensity behavior could indicate a difference in the effect of and on the vibrational modes in the glass under stress, which in the first case experiences negative pressure rather than positive. However, additional experimental evidences are needed to assess the generality of this observation.
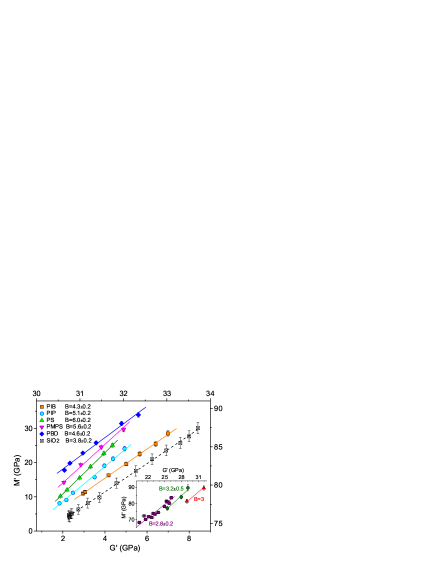
All together our results can help provide a rationale for the apparently conflicting conclusions of previous investigations of BP scaling behavior. The key point is that existing studies are limited to glass-formers below their glass transition and hence always in a condition in which the particle configurations cannot fully relax to equilibrium and the system cannot fully release internal stresses. Therefore, they should not give a Debye-scaled BP. However, on the basis of our results, if the amount of stress retained within the glassy structure is small, such that deviations from the Chauchy-like relationship cannot be appreciated within the experimental uncertainty, then the BP is expected to scale reasonably well with the elastic properties of the medium; otherwise one expects the BP scaling does not work. To test this expectation, we check the validity of the Cauchy–like relation in all the so far studied systems (Fig. 5). Available and data for systems in which the BP evolution is not Debye-controlled are collected in the main panel of Fig. 5, while data for systems in which the BP reasonably scales with are presented in the inset. Surprisingly, all data in the main panel exhibit an angular coefficient () significantly higher than 3 revealing the presence of stress in the investigated samples, while the data in inset are all compatible with a low-stress condition () nota . In this regard, our study suggests that if internal stress would be drastically reduced by applying appropriate annealing treatments to the stressed samples, then the Debye scaling of the BP would tend to be recovered.
V Conclusions
By a combination of experiments performed during polymerization and quenching of a reactive mixture, we provide evidence that the Debye scaling of the BP holds for states in which the system is able to release internal stresses, whereas deviations from the scaling originate in the presence of residual stress, evidenced by deviations from the generalized Cauchy relation. In particular, we have shown that for our system, independently from the vitrification path, the BP spectra can be scaled into a single master curve by means of two independent parameters, one for the frequency axis and one for the intensity; in case the residual stresses are negligible these parameters are equal and coincide with the value of the Debye frequency. Therefore, while the scaled spectral shape of the BP appears to be a system’s characteristic, there may be different scaling regimes controlled by the presence of residual stress. The reported correlation between breakdown of the Debye scaling and violation of the Cauchy-like relationship is also able to give a rationale of all the previous conflicting results in the literature.
Acknowledgements.
We thank M. Mattarelli for the helpful discussions.*
Appendix A Derivation of solid-like sound velocities
BLS and IXS measurements as a function of time during isothermal polymerization of the DGEBA-DETA reactive mixture at 275 K were previously reported; CaponiPRL2009 ; CorezziPRL2006 in the present work, BLS measurements have been extended as a function of temperature by cooling the unreacted mixture from 275 K to 80 K, and after different quenches (to 73 K) of the mixture at different times of polymerization. From these experiments, we have derived the appropriate solid-like velocities and that are needed to calculate in all the experimental conditions of the present study, as follows:
(i) During the isothermal polymerization at 275 K, is directly measured by IXS and , which is not accessible in the IXS experiment, is obtained using the Cauchy-like relation , that connects the longitudinal modulus and the transverse modulus at all frequencies, with the density Cauchy . The data as function of the polymerization time are shown in Fig. 6(a) with a solid line.
(ii) In the quenched states at 73 K the system is well into the glassy phase and BLS directly measures the solid-like elastic values of both and . The data are reported as solid circles and squares in Fig. 6(a).
(iii) For the unreacted mixture under cooling, in the temperature region below the sound velocities measured by BLS already correspond to the high-frequency values and (solid symbols in Fig. 6(b)), while in the temperature region above the IXS measurement made at the beginning of the isothermal polymerization provides the value of at 275 K (this value is marked with a star in Fig. 6(b)). Joining this last point to the point at , by assuming a linear dependence on temperature as observed for the BLS data (open symbols), allows us to obtain also in the viscoelastic fluid. The corresponding values of are obtained from the Cauchy-like relation Cauchy ; these results are reported in Fig. 6(b) with a solid line.
References
- (1) B. Frick, and D. Richter, Science 267, 1939 (1995).
- (2) R. C. Zeller, and R. O. Pohl, Phys. Rev. B 4, 2029 (1971).
- (3) A. Monaco, A. I. Chumakov, Y.-Z. Yue, G. Monaco, L. Comez, D. Fioretto, W. A. Crichton, and R. Rüffer, Phys. Rev. Lett. 96, 205502 (2006).
- (4) A. Monaco, A. I. Chumakov, G. Monaco, W. A. Crichton, A. Meyer, L. Comez, D. Fioretto, J. Korecki, and R. Rüffer, Phys. Rev. Lett. 97, 135501 (2006).
- (5) K. Achterhold, C. Keppler, A. Ostermann, U. van Bürck, W. Sturhahn, E. E. Alp, and F. G. Parak, Phys. Rev. E 65, 051916 (2002).
- (6) A. P. Sokolov, U. Buchenau, W. Steffen, B. Frick, and A. Wischnewski, Phys. Rev. B 52, R9815 (1995).
- (7) G. Simon, B. Hehlen, E. Courtens, E. Longueteau, and R. Vacher, Phys. Rev. Lett. 96, 105502 (2006).
- (8) B. Hehlen, and G. Simon, J. Raman Spectrosc. 43, 1941 (2012).
- (9) D. A. Parshin, H. R. Schober, and V. L. Gurevich, Phys. Rev. B 76, 064206 (2007).
- (10) W. Schirmacher, G. Ruocco, and T. Scopigno, Phys. Rev. Lett. 98, 025501 (2007).
- (11) H. Shintani, and H. Tanaka, Nat. Mater. 7, 870 (2008).
- (12) A. Marruzzo, W. Schirmacher, A. Fratalocchi, and G. Ruocco, Sci. Rep. 3, 1407 (2013).
- (13) G. Baldi, A. Fontana, G. Monaco, L. Orsingher, S. Rols, F. Rossi, and B. Ruta, Phys. Rev. Lett. 102 195502 (2009).
- (14) B. Rufflé, S. Ayrinhac, E. Courtens, R. Vacher, M. Foret, A. Wischnewski, and U. Buchenau, Phys. Rev. Lett. 104, 067402 (2010).
- (15) M. Zanatta, G. Baldi, S. Caponi, A. Fontana, C. Petrillo, F. Rossi, and F. Sacchetti, J. Chem. Phys. 135, 174506 (2011).
- (16) A. I. Chumakov, G. Monaco, A. Monaco, W. A. Crichton, A. Bosak, R. Rüffer, A. Meyer, F. Kargl, L. Comez, D. Fioretto, H. Giefers, S. Roitsch, G. Wortmann, M. H. Manghnani, A. Hushur, Q. Williams, J. Balogh, K. Parliński, P. Jochym, and P. Piekarz, Phys. Rev. Lett. 106, 225501 (2011).
- (17) M. Zanatta, G. Baldi, S. Caponi, A. Fontana, E. Gilioli, M. Krish, C. Masciovecchio, G. Monaco, L. Orsingher, F. Rossi G., Ruocco, and R. Verbeni, Phys. Rev. B 81, 212201 (2010).
- (18) B. Rossi, S. Caponi, F. Castiglione, S. Corezzi, A. Fontana, M. Giarola, G. Mariotto, A. Mele, C. Petrillo, F. Trotta, and G. Viliani, J. Phys. Chem. B 116, 5323 (2012).
- (19) S. Caponi, S. Corezzi, D. Fioretto, A. Fontana, G. Monaco, and F. Rossi, Phys. Rev. Lett. 102, 027402 (2009).
- (20) K. Niss, B. Begen, B. Frick, J. Ollivier, A. Beraud, A. Sokolov, V. N. Novikov, and C. Alba-Simionesco, Phys. Rev. Lett. 99, 055502 (2007).
- (21) L. Hong, B. Begen, A. Kisliuk, C. Alba-Simionesco V. N., Novikov, and A. P. Sokolov, Phys. Rev. B 78, 134201 (2008).
- (22) S. Caponi, A. Fontana, M. Mattarelli, M. Montagna, and F. Rossi, J. Phys.: Condens. Matter 19, 205149 (2007).
- (23) S. Caponi, A. Fontana, F. Rossi, G. Baldi, and E. Fabiani, Phys. Rev. B 76, 092201 (2007).
- (24) C. Levelut, R. Le Parc, and J. Pelous, Phys. Rev. B 73, 052202 (2006) and reference therein.
- (25) S. Caponi, G. Carini, G. D’Angelo, A. Fontana, O. Pilla, F. Rossi, F. Terki, G. Tripodo, and T. Woignier, Phys. Rev. B 70, 214204 (2004).
- (26) P. J. Withers, Rep. Prog. Phys. 70, 2211 (2007).
- (27) M. Mattarelli, Physics Degree Thesis (1999), University of Perugia, unpublished.
- (28) J. K. Krüger, T. Britz, A. le Coutre, J. Baller, W. Possart, P. Alnot, and R. Sanctuary, New Journal of Physics 5, 80.1 (2003).
- (29) M. Ballauff, J. M. Brader, S. U. Egelhaaf, M. Fuchs, J. Horbach, N. Koumakis, M. Kru ger, M. Laurati, K. J. Mutch, G. Petekidis, M. Siebenbu rger, Th. Voigtmann, and J. Zausch, Phys. Rev. Lett. 110, 215701 (2013).
- (30) S. Corezzi, D. Fioretto, and P.A. Rolla, Nature (London) 420, 563 (2002).
- (31) S. Corezzi, D. Fioretto, and J. M. Kenny, Phys. Rev. Lett. 94, 065702 (2005).
- (32) S. Corezzi, L. Comez, G. Monaco, R. Verbeni, and D. Fioretto, Phys. Rev. Lett. 96, 255702 (2006).
- (33) S. Corezzi, D. Fioretto, C. De Michele, E. Zaccarelli, and F. Sciortino, J. Phys. Chem. B 114, 3769 (2010).
- (34) S. Corezzi, D. Fioretto, G. Santucci, and J. M. Kenny, Polymer 51, 5833 (2010).
- (35) S. N. Yannopoulos and D. Th. Kastrissios, Phys. Rev. E 65, 021510 (2002).
- (36) N. V. Surovtsev, and A. P. Sokolov, Phys. Rev. B 66, 054205 (2002).
- (37) N. V. Surovtsev, A. P. Shebanin, and M. A. Ramos, Phys. Rev. B 67, 024203 (2003).
- (38) A. Fontana, F. Rossi, G. Viliani, S. Caponi, E. Fabiani, G. Baldi, G. Ruocco, and R. Dal Maschio, J. Phys. Condens. Matter 19, 205145 (2007).
- (39) A. Schulte, Y. Guo , W. Schirmacher, T. Unruh, T. Cardinal, Vib. Spectrosc. 48, 12 (2008).
- (40) D. Fioretto, S. Corezzi, S. Caponi, F. Scarponi, G. Monaco, A. Fontana, and L. Palmieri, J. Chem. Phys. 128, 214502 (2008).
- (41) J. K. Krüger, J. Baller, T. Britz, A. le Coutre, R. Peter, R. Bactavatchalou, and J. Schreiber, Phys. Rev. B 66, 012206 (2002).
- (42) M. Philipp, C. Vergnat, U. Müller, R. Sanctuary, J. Baller, W.Possart, P. Alnot, and J. K. Krüger, J. Phys.: Condens. Matter 21, 035106 (2009).
- (43) R. Zwanzig, and R. D. Mountain, J. Chem. Phys. 43, 4464 (1965).
- (44) K. S. Andrikopoulos, D Christofilos, G. A. Kourouklis, and S. N. Yannopoulos, J. Non-Cryst. Solids 352, 4594 (2006).
- (45) We notice that the fairly good scaling of the BP reported in ref. MonacoPRL2006hyp for the hyperquenched and annealed glass, and the apparent agreement with the Chauchy-like relation are quite surprising. In this case, it is possible that a small deviation from the Debye scaling does exist, although hardly discernible from the experimental error, and also some deviation from the Cauchy-like relation might arise from more data points (note that only the data for one hyperquenched sample are available). We can only conclude that this case is compatible with a low-stress condition, possibly favored by the small dimensionality of the sample. On the other hand, the system is subjected to small changes of () and therefore a large deviation from the scaling is unlikely.