The variable X-ray emission of \src
Abstract
The old pulsar PSR B0943+10 (=1.1 s, characteristic age =5 Myr) is the best example of mode-switching radio pulsar. Its radio emission alternates between a highly organised state with regular drifting subpulses (B mode) and a chaotic emission pattern (Q mode). We present the results of XMM-Newton observations showing that the X-ray properties of PSR B0943+10 depend on its radio state (Hermsen et al., 2013). During the radio fainter state (Q mode) the X-ray flux is more than a factor two larger than during the B-mode and X-ray pulsations with 50% pulsed fraction are detected. The X-ray emission of PSR B0943+10 in the B-mode is well described by thermal emission with blackbody temperature =0.26 keV coming from a small hot spot with luminosity of 7 erg s-1, in good agreement with the prediction of the partially screened gap model, which also explains the properties of the radio emission in this mode. We derived an upper limit of 46% on the X-ray pulsed fraction in the B-mode, consistent with the geometry and viewing angle of PSR B0943+10 inferred from the radio data. The higher flux observed during the Q-mode is consistent with the appearance of an additional component with a power-law spectrum with photon index 2.2. We interpret it as pulsed non-thermal X-rays produced in the star magnetosphere. A small change in the beaming pattern or in the efficiency of acceleration of the particles responsible for the non-thermal emission can explain the reduced flux of this component during the radio B-mode.
keywords:
pulsars: general – stars: neutron – X-rays: individual: PSR B0943+10.1 Introduction
Rotation-powered neutron stars are observed as sources of thermal and non-thermal X-rays, whose relative intensity and properties mainly depend on the star age, spin period and magnetic field (Becker, 2009). Non-thermal emission is produced by particles accelerated in the star magnetosphere at the expense of rotational energy. The thermal X-rays observed in middle-aged pulsars are due to the dissipation of the internal heat, while older neutron stars show thermal emission from hot polar caps heated by relativistic particles accelerated in the magnetosphere and flowing toward the star surface.
Several decades of X-ray observations led to the widespread notion that, except for the periodic variability due to the star spin, rotation-powered neutron stars are steady X-ray emitters. The only example of X-ray variability (a few short bursts associated to a flux enhancement lasting about one month) observed in an allegedly rotation-powered pulsar has been attributed to the release of magnetic energy (PSR J1846–0258, Gavriil et al. 2008). In fact, X-ray variability on time scales from few milliseconds to months is a characteristic of isolated neutron stars whose emission is powered by magnetic energy rather than by the loss of rotational energy, the so called magnetars (Mereghetti, 2008). On the other hand, it is well known that pulsars can exhibit significant variability on different time scales at radio wavelengths (Keane, 2013). In particular many pulsars alternate between two states which differ in the shape of their mean radio pulse profiles (see, e.g. Lorimer & Kramer 2012, and references therein).
The recent discovery of variations by a factor 2 in the X-ray luminosity of PSR B0943+10, correlated with changes in its mode of radio emission (Hermsen et al., 2013), is at variance with the picture outlined above and has come as a major surprise. PSR B0943+10 is a relatively old radio pulsar with spin period s and period derivative =3.510-15 s s-1. These timing parameters imply a characteristic age =) = 5 Myr, a dipolar magnetic field =41012 G, and a rotational energy loss rate = 1032 erg s-1. In the radio band PSR B0943+10 alternates between two different states: when the pulsar is in the so called B (burst-like or bright) mode, the radio emission displays a regular pattern of drifting subpulses, while it is chaotic, and on average fainter, when the pulsar is in the Q (quiescent) mode (Suleimanova & Izvekova, 1984).
X-rays from PSR B0943+10 were first detected in two observations carried out in 2003 with XMM-Newton (Zhang, Sanwal & Pavlov, 2005), but due to the source faintness and short exposure times it was not possible to precisely characterize the spectrum and detect X-ray pulsations. Further XMM-Newton pointings of PSR B0943+10 were carried out in 2011, with simultaneous radio coverage at 320 MHz with the Giant Metrewave Radio Telescope (GMRT) and at 140 MHz with the Low Frequency Array (LOFAR). These observations showed that the pulsar X-ray emission is brighter during the radio Q mode and fainter during the B mode. X-ray pulsations were detected only when the flux was higher. According to the spectral analysis of Hermsen et al. (2013), the X-ray data can be interpreted assuming that when the pulsar is in the B-mode it emits only a non-thermal, unpulsed power-law component and the higher flux in the Q-mode is due the additional presence of a 100%-pulsed thermal component, well described by a blackbody model.
Here we present an independent reanalysis of the 2011 XMM-Newton observations which confirms the main results of Hermsen et al. (2013), but shows that other models not considered by these authors and implying different, possibly more natural, interpretations are also consistent with the data. The distance of PSR B0943+10, based on its dispersion measure and the Cordes & Lazio (2002) electron density model, is 630100 pc. In the following we assume this value for all the distance-dependent quantities.
| Obs.ID | Start/end time (UT) | Net exposure time (ks) | |||
|---|---|---|---|---|---|
| (YYYY-MM-DD hh-mm-ss) | pn | MOS1 | MOS2 | ||
| 0671540201 | 2011-11-04 01:16:13 | 2011-11-04 07:16:23 | 13.4 | 21.0 | 21.0 |
| 0671540301 | 2011-11-06 01:18:32 | 2011-11-06 08:28:53 | 18.2 | 23.9 | 24.4 |
| 0671540401 | 2011-11-21 23:54:31 | 2011-11-22 06:44:42 | 15.8 | 19.5 | 21.9 |
| 0671540501 | 2011-11-27 23:52:59 | 2011-11-28 06:04:42 | 7.6 | 20.5 | 20.7 |
| 0671540601 | 2011-12-01 23:39:03 | 2011-12-02 05:52:36 | 9.1 | 15.7 | 16.1 |
| Parameter | Q mode | B mode | |||||
|---|---|---|---|---|---|---|---|
| PL | BB | PL+BB | PL | BB | |||
| NH (1020 cm-2) | 14 | 1 | 6 | 33 | 20 | ||
| Photon index | 3.1 | - | 2.6 | 4.1 | - | ||
| K (10-6 ph cm-2 s-1 keV-1) | 7.0 | - | 1.6 | 5.7 | - | ||
| kTBB (keV) | - | 0.260.02 | 0.310.04 | - | 0.27 | ||
| F (10-15 erg cm-2 s-1) | - | 13.50.6 | 8.7 | - | 5.80.6 | ||
| R (m) | - | 30.7 | 18.5 | - | 19.5 | ||
| /dof | 1.00 / 20 | 1.34 / 20 | 0.70 / 18 | 0.39 / 7 | 0.47 / 7 | ||
| Null hypothesis probability | 0.46 | 0.14 | 0.81 | 0.91 | 0.86 | ||
-
Errors at 1 for one interesting parameter.
-
a
Flux of the power-law at 1 keV.
-
b
Bolometric blackbody flux.
-
c
Blackbody radius for d=630 pc.
2 Observations and data analysis
2.1 Observations and data selection
Six observations of PSR B0943+10 were performed with XMM-Newton between 2011 November 4 and December 4. We used the data obtained with the EPIC instrument which consists of one pn (Strüder et al., 2001) and two MOS CCD cameras (Turner et al., 2001). In all the observations the pn camera was operated in full frame mode (73 ms resolution), and both MOS cameras in small window mode (0.3 s resolution). The thin optical blocking filters were used.
We checked the data for the presence of time intervals with high background due to soft proton flares and removed them, resulting in the net exposure times given in Table 1. We discarded the last observation which was completely affected by high background.
The extraction of the counts for the spectral and timing analysis was done from a circular region of radius 15′′ centered on the pulsar position, both for the pn and the two MOS. We considered only photons in the 0.2-12 keV energy range and with patterns corresponding to mono- and bi-pixel events (i.e. 4 for pn and 12 for MOS). The background spectra were extracted from source-free regions in the same CCD chips used for the target. Different spectra were extracted for the two radio states of PSR B0943+10, based on the time intervals given in Hermsen et al. (2013). These spectra were then summed to produce a total spectrum for each camera and source state. The corresponding net exposure times are similar for the Q and B mode: 32.9 and 31.3 ks respectively for the pn, 51.7 and 48.9 ks for the MOS1, 55.4 and 48.6 ks for the MOS2.
2.2 Timing and spectral analysis
All the spectra were rebinned to have a minimum of 20 counts in each energy channel after background subtraction and were fitted using the XSPEC package V12.7. For the interstellar absorption we used the phabs model. The spectra of the three cameras were fitted simultaneously.
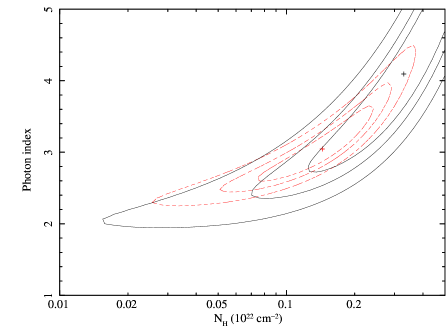
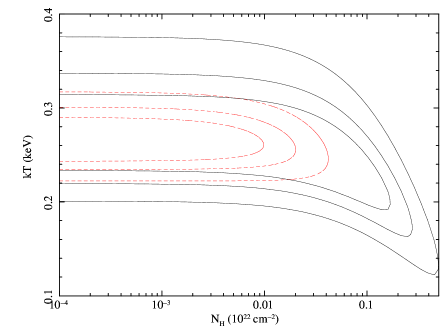
Good fits were obtained with either a power law or a blackbody model for the spectra of both modes. We did not find statistically significant evidence for spectral variations between the Q and B mode, as it can be seen in Figs. 3 and 4, where the confidence regions of the fit parameters are plotted. In fact, the best fit Q-mode models provide an adequate fit also to the B-mode spectra by changing only their normalizations. The flux in the B-mode is about 42% of that in the Q-mode. Although single component models are adequate to describe the data, we fitted the Q-mode spectra also with a power law plus blackbody. All the spectral results are summarized in Table 2.


After converting the time of arrivals to the Solar system barycenter, we folded at the spin period of PSR B0943+10 the pn and MOS counts obtained during the Q-mode. We used the timing parameters of Hermsen et al. (2013) (=0.910989538329 Hz, d/dt = –2.94219 Hz s-1, d/dt2 = –1.39 Hz s-2, epoch = 54226 MJD). The resulting pulse profile in the 0.15–12 keV energy range is shown in the top panel of Fig. 1. The pulse profiles in the soft (0.15–0.6 keV), medium (0.6–1.3 keV) and high (1.3–12 keV) energy ranges are also reported (lower panels). The three energy intervals were chosen to have approximately the same number of counts (about 200) in each band. The horizontal lines indicate the estimated background levels.
To derive the significance of the pulse detection, we computed the test statistics (Buccheri et al., 1983) and obtained values corresponding to single trial chance probabilities of 2.510-8 (=35.0), 2.210-3 (=12.2), 7.110-6 (=23.7), and 2.210-2 (=7.6) in the total, soft, medium, and hard band, respectively. A fit with a constant plus a sinusoid gives a pulsed fraction in the total band of (506)%. The pulsed fractions in the other bands are (6613)% soft, (568)% medium, and (5313)% hard.
We analyzed in a similar way the counts extracted when the pulsar was in radio B-mode (350 counts in the total energy range). No significant modulation was detected in this case (values of Z2.54, corresponding to probabilities larger than 0.28, were obtained in the different energy ranges). Through Monte Carlo simulations and assuming a sinusoidal modulation, we derived 3 upper limits on the pulsed fraction during the B-mode of 56% and 46% in the medium and total energy ranges, respectively. The folded light curve in the B-mode is shown in Fig. 2.
For the phase-resolved spectroscopy of the Q-mode data we extracted the pn spectra of two non-overlapping phase intervals of equal width (=0.5), centered at the maximum and minimum of the pulse profile in the total energy range.
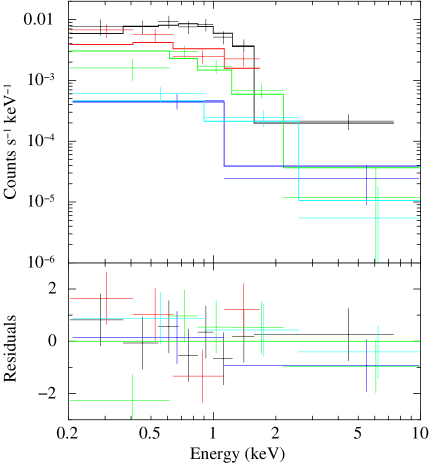
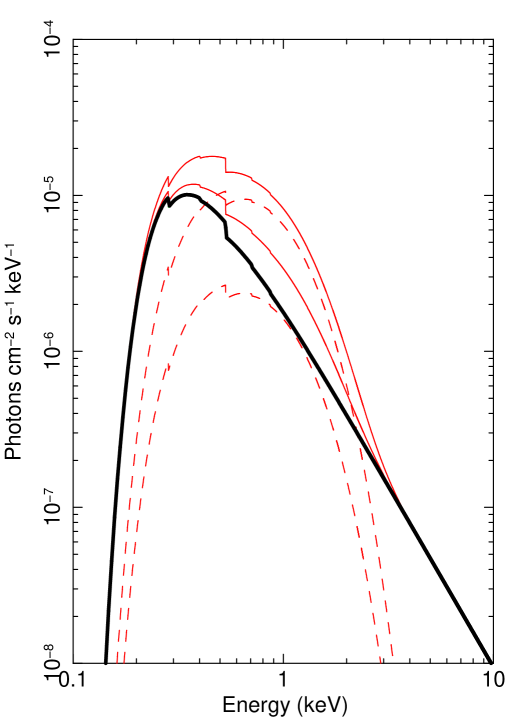
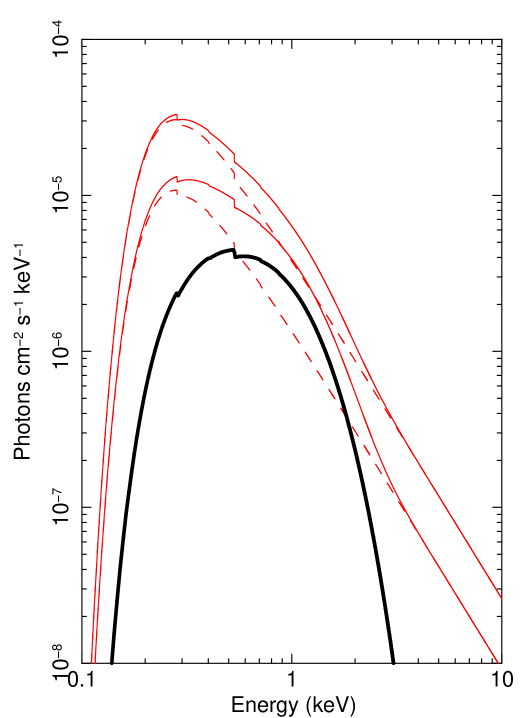
We make the working hypothesis that the difference in the X-ray flux between the two radio states of PSR B0943+10 is due only to the presence during the Q-mode of an additional pulsed component, which is absent (or too faint to be detected) during the B-mode. Different possibilities are explored by fitting simultaneously the two phase-resolved Q-mode spectra (pn only) and the B-mode spectrum (pn+MOS). We first consider the case of a power-law which remains steady plus a pulsed blackbody: this is done by imposing common parameters for the power-law component in the three spectra and a blackbody normalization fixed to 0 for the B-mode spectrum. In this way a good fit is found with a power-law photon index of 2.30.4 and a 0.04 keV blackbody from an emitting area which varies by a factor of 4 between the pulse minimum and maximum. The best fit is shown in Fig. 5.
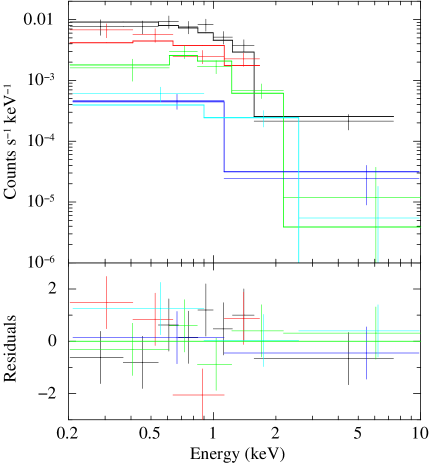
In the same way we explored the alternative possibility of a steady blackbody component plus a variable power-law responsible for the Q-mode pulsations. A slightly better fit was obtained in this case, with similar values of temperature and photon index (Fig. 6). All the best-fit results are summarized in Table 3. A comparison of the two models is shown in Fig. 7.
| Parameter | Constant PL | Constant BB |
|---|---|---|
| and pulsed BB | and pulsed PL | |
| NH (1020 cm-2) | 4.3 | 2.4 |
| Photon index | 2.3 | 2.20.3 |
| K (10-6 ph cm-2 s-1 keV-1) | 2.0 | 1.40.5 / 4.0 |
| kTBB (keV) | 0.260.04 | 0.260.03 |
| F (10-15 erg cm-2 s-1) | 4.21.6 / 16.6 | 6.3 |
| R (m) | 177 / 3511 | 216 |
| /dof | 1.16 / 16 | 0.99 / 16 |
| Null hypothesis probability | 0.29 | 0.47 |
-
Errors at 1 for one interesting parameter.
-
a
Flux of the power-law at 1 keV.
-
b
Bolometric blackbody flux.
-
c
Blackbody radius for d=630 pc.
3 Discussion
Our analysis of the 2011 XMM-Newton observations confirms that the X-ray flux of PSR B0943+10 changes on short timescales in strict correlation with the two modes of radio emission which characterize this pulsar (Hermsen et al., 2013). The observed 0.2–10 keV flux is about 5 erg cm-2 s-1 during the B-mode, in which the radio emission shows a highly organized structure with drifting subpulses. When the pulsar switches to the radio Q-mode, its X-ray flux increases by a factor 2.5. X-ray pulsations with a nearly sinusoidal profile and a pulsed fraction of 50% are clearly present when the X-ray flux is high. On the other hand, we could not detect the pulsations in the sum of all the data collected during the radio B-mode. Due to the X-ray faintness of the source in this state, the derived upper limits on the pulsed fraction are not particularly constraining.
The spectrum of PSR B0943+10 during the B-mode is fit equally well by either a power law or a blackbody. The power-law model yields a rather steep spectrum, photon index of 4.1, and an interstellar absorption larger than that expected based on the total Galactic column density in this direction, cm-2 (Kalberla et al., 2005). Although the involved uncertainties do not allow us to reject the power-law model on these bases, we favour the blackbody interpretation, which yields a temperature and emitting area consistent with the less constrained values derived with the 2003 data (Zhang et al., 2005). Note that the radio state of the pulsar during the 2003 observations is not known, due to the lack of simultaneous radio coverage.
Detailed modeling of the radio data indicates that PSR B0943+10 is a nearly aligned rotator (the angle between the rotation and magnetic axis is of 15∘) seen nearly pole-on (Deshpande & Rankin, 2001). This implies that one of the magnetic polar cap regions is always visible and the pulsar rotation causes only a minor modulation of the observed flux. We computed the light curve produced by a single rotating hot spot on the star surface under the conditions expected in PSR B0943+10, including general relativistic effects, and found a pulsed fraction %, consistent with the lack of strong pulsations in B-mode.
Although with the statistical quality of the current data there is no compelling evidence for differences between the X-ray spectra of the two states, it is interesting to explore such a possibility. Since most well studied pulsars require a combination of thermal and non-thermal components in their X-ray spectra, we assumed that the same applies to PSR B0943+10, and checked whether the higher, and pulsed, X-ray flux during the Q-mode can be explained by the appearance of a new spectral component in addition to that of the B-mode, which is assumed to be always present with the same properties in both modes. The simplest picture is that of a blackbody plus power-law spectrum in which either the blackbody or the power-law is the ”additional pulsed component” (see Fig. 7), As shown above, both cases are consistent with the data.
The first case has been considered by Hermsen et al. (2013). In this scenario it is easy to account for the constant power-law component, which could be well explained by non-thermal processes in the star magnetosphere or in a pulsar wind nebula. On the other hand it seems difficult to produce a large modulation of the thermal component at the spin period. As discussed above, thermal, isotropic emission from a small heated region on the star surface results in a pulsed fraction more that 20 times lower than the observed one, given that PSR B0943+10 is a nearly aligned rotator seen close to the rotation axis. Furthermore, some mechanism is required to switch-off, or strongly reduce, this component during the Q-state. According to Hermsen et al. (2013), a 100% modulation of the blackbody component can be produced by absorption/scattering in the magnetosphere, assuming that its properties vary with the pulsar rotation phase. The same process could operate at all rotational phases in the B-mode, e.g. because the region of closed field lines expands and completely blocks our view of the polar cap, explaining the non detection of the thermal component. Even leaving aside what actually produces the changes in the pulsar magnetosphere, this picture would imply the presence of a large enough charge density in the closed magnetosphere. Resonant cyclotron scattering on electrons/positrons (by far the most efficient process) requires a particle density – to make the region optically thick. This is comparable to the charge density in the twisted magnetosphere of magnetars, in which substantial deviations from the dipole field geometry occur because of the huge magnetic stresses exerted on the crust by the internal field (e.g. Thompson, Lyutikov & Kulkarni, 2002). Would this occur, PSR B0943+10 ought to be akin (at least in some respects) to the soft -repeaters and anomalous X-ray pulsars, which have, however, a largely different phenomenology at X-ray energies. Alternatively, one may assume that the back-flow of particles which heat the pole immediately switches off at the transition between the Q- and B- mode, although this leaves the pulsed fraction issue open.
Our analysis clearly shows that also the second of the two possibilities discussed above, i.e. a pulsed power-law plus a constant blackbody, is fully consistent with the data (and even slightly preferred in terms of , see Table 3). Thermal emission from a small polar region, with very little modulation and present in both radio modes, is an obvious consequence of the pulsar geometry and orientation. Fig. 8 shows the values of projected emitting area and temperature derived for the constant blackbody component. The corresponding bolometric luminosity is comprised between 5 and erg s-1. The emitting area is smaller than that expected for a polar cap whose radius is determined by the last closed magnetic field lines reaching the light cylinder in a dipolar geometry, = . For a neutron star radius =10 km, this gives a polar cap area = 6104 m2 for PSR B0943+10. A similar situation is observed in most old pulsars whose thermal emission is attributed to regions of the star surface heated by back-flowing particles accelerated in the magnetosphere above the magnetic poles. A plausible scenario to account for the small emitting area is that the X-rays come only from the footprints of the sub-beams which constitute the radio emitting pattern of drifting radio pulses (Zhang et al., 2005).
In the partially screened gap model (Gil et al., 2003, 2006), a simple relation is expected between the heating rate of the polar cap and the drift velocity of the plasma sparks around the magnetic axis. This depends on the ratio between the circulation period, , and the spin period. The efficiency of the thermal emission is , which for PSR B0943+10 (, Deshpande & Rankin 1999) corresponds to a luminosity of 4.51028 erg s-1, in reasonable agreement with the results of our fit.
The power-law component can be ascribed to non-thermal emission produced in the magnetosphere with a typical efficiency of rotation-powered pulsars (Possenti et al., 2002). The average luminosity of PSR B0943+10 (21029 erg s-1, 2–10 keV) implies an efficiency of 210-3 fully consistent with that of old pulsars (Posselt et al., 2012). The presence of pulsations in this component is a natural consequence of a non-isotropic emission pattern. A simple model in which the power-law component varies sinusoidally while the blackbody is constant can reproduce the pulsed fractions observed in the different bands quite well within the reported uncertainties. A slight variation in the beaming direction might explain the difference between the B and Q mode, not necessarily implying a real difference in the intrinsic luminosity. This could be due to a minor change in the structure of the magnetosphere and/or of the region where the relativistic particles responsible for the non-thermal emission are accelerated. It is also not surprising that such changes affect both the high-energy and the radio emission properties.

4 Conclusions
We have performed a detailed analysis of the 2011 XMM-Newton observations of PSR B0943+10 which confirms the striking X-ray variability correlated with the radio mode recently reported by Hermsen et al. (2013). PSR B0943+10 is a faint X-ray source: only 600 photons have been detected in 100 ks, despite the large collecting area of the EPIC instrument. While there is no doubt that the X-ray flux of PSR B0943+10 varies by more than a factor two, being fainter when the radio emission shows a regular pattern of drifiting subpulses (B-mode), all the other spectral and timing results are subject to uncertainties which leave open different interpretations.
We advocate a scenario in which a baseline level of thermal X-ray emission is always present and originates in a hot polar region, visible at all rotational phases and in both radio modes. This is well fit by a blackbody spectrum with temperature =0.26 keV and luminosity of 7 erg s-1, in good agreement with the predictions of the partially screened gap model. The higher X-ray flux of the Q-mode can be explained by the appearance of an additional component, modulated at the star spin period. We found that this component can be described by a power-law with photon index 2.2, and suggest that it is due to anisotropic non-thermal X-rays produced in the neutron star magnetosphere. A small change in the beaming pattern or in the efficiency of acceleration of the particles responsible for the non-thermal emission can explain the reduced flux of this component during the radio B-mode, without invoking global re-arrangements of the star magnetosphere.
No similar X-ray variability has been reported for other rotation powered neutron stars. However it should be considered that, without an ad hoc analysis based on time intervals selected from the simultaneous radio data, the X-ray variations in PSR B0943+10 would have passed unnoticed. It is thus possible that other pulsars, in particular those alternating different radio patterns and/or showing intermittent radio emission (Kramer et al., 2006), can exhibit associated variations in their X-ray properties which can only be unraveled by sensitive X-ray observations with simultaneous radio coverage.
Acknowledgments
This research is based on data of XMM-Newton, an ESA science mission with instruments and contributions directly funded by ESA Member States and NASA. This work was partially suported by the PRIN-INAF 2010.
References
- Becker (2009) Becker W., 2009, in Becker W., ed., Astrophysics and Space Science Library Vol. 357 of Astrophysics and Space Science Library, X-Ray Emission from Pulsars and Neutron Stars. p. 91
- Buccheri et al. (1983) Buccheri R., et al., 1983, A&A, 128, 245
- Deshpande & Rankin (1999) Deshpande A. A., Rankin J. M., 1999, ApJ, 524, 1008
- Deshpande & Rankin (2001) Deshpande A. A., Rankin J. M., 2001, MNRAS, 322, 438
- Gavriil et al. (2008) Gavriil F. P., Gonzalez M. E., Gotthelf E. V., Kaspi V. M., Livingstone M. A., Woods P. M., 2008, Science, 319, 1802
- Gil et al. (2006) Gil J., Melikidze G., Zhang B., 2006, ApJ, 650, 1048
- Gil et al. (2003) Gil J., Melikidze G. I., Geppert U., 2003, A&A, 407, 315
- Hermsen et al. (2013) Hermsen W., et al., 2013, Science, 339, 436
- Kalberla et al. (2005) Kalberla P. M. W., Burton W. B., Hartmann D., Arnal E. M., Bajaja E., Morras R., Pöppel W. G. L., 2005, A&A, 440, 775
- Keane (2013) Keane E. F., 2013, in IAU Symposium Vol. 291 of IAU Symposium, Radio pulsar variability. pp 295–300
- Kramer et al. (2006) Kramer M., Lyne A. G., O’Brien J. T., Jordan C. A., Lorimer D. R., 2006, Science, 312, 549
- Lorimer & Kramer (2012) Lorimer D. R., Kramer M., 2012, Handbook of Pulsar Astronomy
- Mereghetti (2008) Mereghetti S., 2008, A&A Rev., 15, 225
- Posselt et al. (2012) Posselt B., Pavlov G. G., Manchester R. N., Kargaltsev O., Garmire G. P., 2012, ApJ, 749, 146
- Possenti et al. (2002) Possenti A., Cerutti R., Colpi M., Mereghetti S., 2002, A&A, 387, 993
- Strüder et al. (2001) Strüder L., et al., 2001, A&A, 365, L18
- Suleimanova & Izvekova (1984) Suleimanova S. A., Izvekova V. A., 1984, Soviet Ast., 28, 32
- Thompson et al. (2002) Thompson C., Lyutikov M., Kulkarni S. R., 2002, ApJ, 574, 332
- Turner et al. (2001) Turner M. J. L., et al., 2001, A&A, 365, L27
- Zhang et al. (2005) Zhang B., Sanwal D., Pavlov G. G., 2005, ApJ, 624, L109