Magnetic phase diagram of low-doped La2-xSrxCuO4 thin films studied by
low-energy muon-spin rotation
Abstract
The magnetic phase diagram of La2-xSrxCuO4 thin-films grown on single-crystal LaSrAlO4 substrates has been determined by low-energy muon-spin rotation. The diagram shows the same features as the one of bulk La2-xSrxCuO4, but the transition temperatures between distinct magnetic states are significantly different. In the antiferromagnetic phase the Néel temperature is strongly reduced, and no hole spin freezing is observed at low temperatures. In the disordered magnetic phase () the transition temperature to the cluster spin-glass state is enhanced. Possible reasons for the pronounced differences between the magnetic phase diagrams of thin-film and bulk samples are discussed.
I Introduction
The bulk magnetic phase diagram of the cuprates, especially La2-xSrxCuO4 (LSCO), has been extensively studied in the past two decades Kastner98 ; Dagotto94 ; Sato2000 ; Rigamonti06 . At lowest Sr contents () bulk LSCO is an antiferromagnetic (AF) charge-transfer insulator. Long-range 3D AF order appears below the Néel temperature K in the parent compound La2CuO4 (LCO) Kastner98 ; Cho93 ; Chou93 ; Borsa95 ; Niedermayer98 . It results from the ordering of spin- Cu2+ moments due to super-exchange with the in-plane exchange coupling constant K. LCO is considered as a model system of a spin- quasi-2D Heisenberg antiferromagnet on a square lattice. The in-plane magnetic properties are well described by the so-called renormalized classical regime as derived by Chakravarty et al. Chakravarty88 and experimentally verified Keimer92 ; Matsumura94 . The 3D order is established predominantly by the weak out-of-plane exchange coupling Keimer92 . At a nominal Sr content of the Néel temperature decreases to zero as shown in the schematic phase diagram in Fig. 1. Within the AF state, charge localization of the doped holes is observed below the freezing temperature [“spin freezing” (SF)] which depends linearly on the doping level, as K (Ref. Chou93, ).
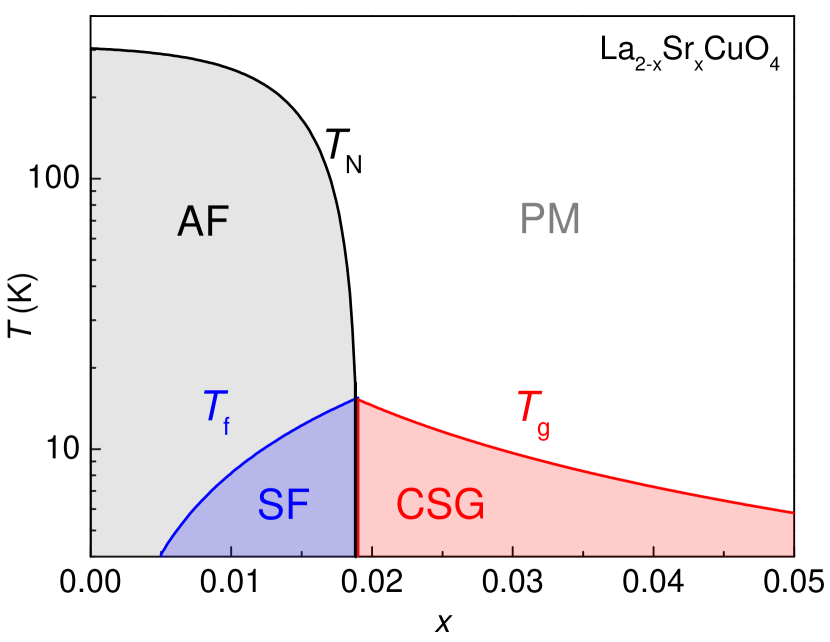
For nominal Sr contents short-range AF correlations within the CuO2 planes persist. A complicated interplay between the doped holes in the CuO2 planes and the remaining AF correlations leads to a yet not well understood electronic state with a pseudogap in the excitation spectrum Ginsberg89 . In this doping region, below the freezing temperature spontaneous zero-field precession is observed in muon-spin rotation (SR) studies Chou93 ; Borsa95 . This is often referred to as the “cluster spin-glass” (CSG) phase. The “glass” transition temperature decreases as (Ref. Chou93, ) and is also detected within the superconducting phase that starts at .
Thin films open the door to new physical properties and phenomena, since electronic or magnetic properties of thin-film structures can be very different from those of the single constituents as found in bulk samples. Phenomena driven by various couplings and dimensional effects may appear. For instance, the proximity between different orders can be studied in multi-layer systems and superlattices. In different cuprate heterostructures a giant proximity effect has been found Bozovic04 ; Morenzoni11 ; Wojek12 , where low doped cuprates sandwiched between superconducting layers, can transmit supercurrent or exhibit a Meissner effect over surprisingly large distances at temperatures where these layers are intrinsically in the normal state. It is usually assumed that the magnetic layers in thin film systems behave as in the bulk material. Yet, this was never systematically studied. As a local magnetic probe of thin films low-energy muon-spin rotation (LE-SR) is well suited to address this question Prokscha08 . Previous studies by this technique of canonical spin glasses Morenzoni08 , metal-insulator LSCO superlattices Suter2011 , and nickel-oxide superlattices Boris2011 showed that dimensional effects might strongly influence the magnetic ground state and its excitations. In addition, the mismatch between the lattice constants of the thin film material and of the substrate leads to biaxial positive or negative strain in the film. For example, LSCO grown on single-crystal LaSrAlO4 (LSAO) substrates are under compressive strain, whereas on single-crystal SrTiO3 (STO) substrates they are under tensile strain. Epitaxial strain leads to significant changes in the lattice constants of the films (contraction or expansion), which in turn affects the superconducting transition temperature Sato97 ; Locquet98 ; Si99 ; Bozovic02 ; Si01 as well as the electronic band structure Abrecht03 . Since both the substrates and the cuprates are essentially ionic crystals, apart from the above “geometric” effect (“Poisson strain”) Bozovic02 , there is an additional effect due to un-screened, long-range Coulomb interactions (“Madelung strain”) Butko09 , which manifests itself as a significant change in the unit cell volume. Finally, in a preliminary study by Suter et al. Suter04 changes were also observed in of LCO, depending on the choice of the substrate. Therefore, the question arises how epitaxial strain, potential strain release, and the substrate in general affect the magnetic properties of LSCO thin films.
Here we present a study on the magnetic phase diagram of LSCO thin films in the low-doping regime (thickness nm, ) grown on LSAO. In Sec. II the experimental details are given. Secs. III.1 and B present the LE-SR results of the AF and CSG phase, respectively. This technique allows stopping muons in matter at different depths in the nanometer range Morenzoni04 , and is therefore well suited to investigate magnetic thin-film samples on a microscopic scale. In Sec. III.3 the differences in the magnetic phase diagrams as obtained for bulk and thin-film samples are discussed, followed by the summary and conclusions in Sec. IV.
II Experimental Details
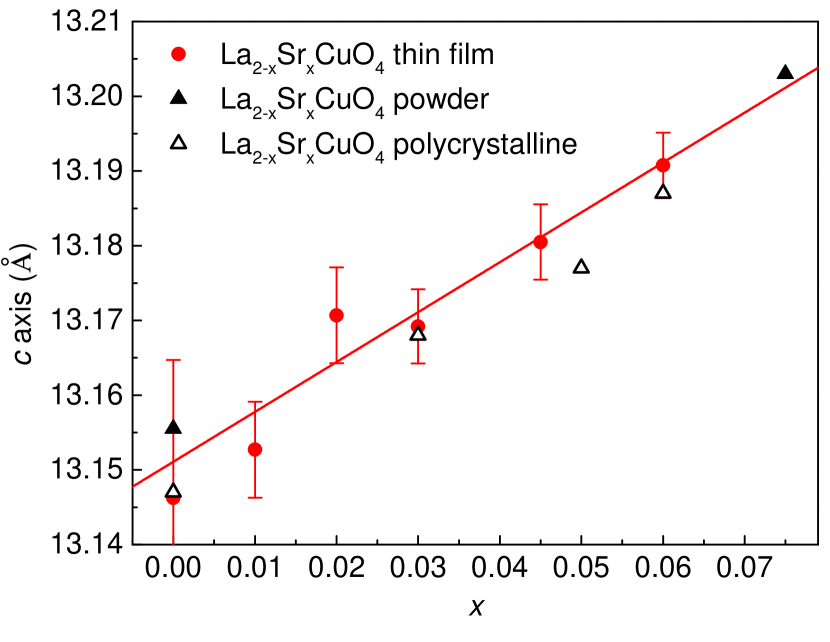
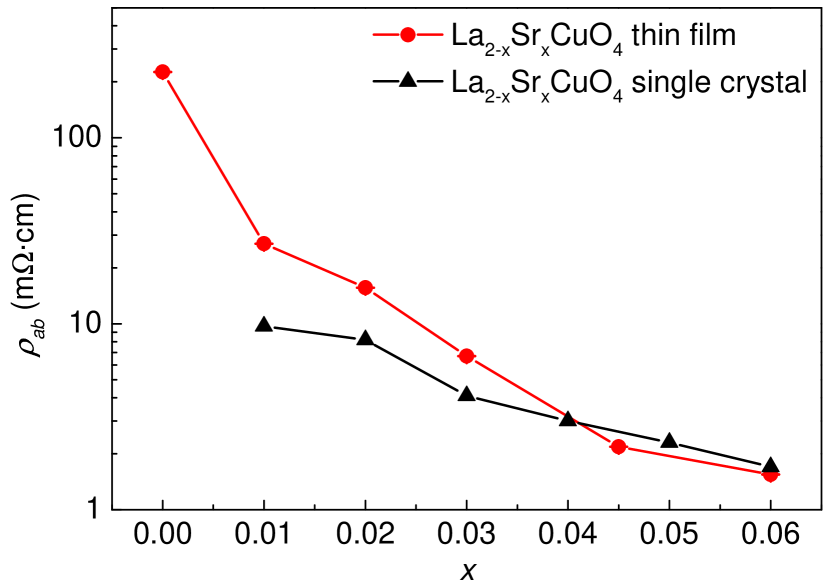
The La2-xSrxCuO4 films studied here were synthesized using molecular-beam epitaxy (MBE) at the Brookhaven National Laboratory. We used single crystal LSAO substrates, mm3 in size and poilished with the surface perpendicular to the [001] crystal axis. The typical film thickness was nm. Further information about the growing process has been published elsewhere Bozovic01 . Here, we have investigated thin films with , , , , , and . The doping level was controlled during the deposition by using well-calibrated MBE sources; the rates were monitored and controlled in real time using a custom-built 16-channel atomic absorption spectroscopy system Bozovic01 . The film growth and quality was monitored in real time using reflection high-energy electron diffraction (RHEED), and checked subsequently by atomic force microscopy as well as by resistivity, susceptibility, and x-ray diffraction measurements. The axis lattice parameters of the samples were extracted from -2-scans (Fig. 2). They show a linear behavior as function of the nominal Sr content , and agree well with the bulk data of polycrystalline samples Lampakis00 and powder samples Radaelli94 . A comparison of the room-temperature resistivity for LSCO single crystals Ando04 and the investigated thin films as function of is depicted in Fig. 3. The resistivity at K shows the expected decrease with increasing Sr content . The thin-film resistivity data are comparable to the single crystal data.
To study the magnetic phase diagram of thin-film LSCO, LE-SR experiments were performed at the muE4 beamline at the Paul Scherrer Institute (PSI, Switzerland) Prokscha08 . In a SR experiment positively charged muons with spin polarization are implanted in the sample where they thermalize within a few picoseconds without noticeable loss of polarization. Because of interactions of the spins with internal local magnetic fields the magnetic moments of the precess with the Larmor frequency ( MHz/T) in the sample until they decay with a mean lifetime of s into neutrinos (, ) and positrons ():
The emission probability for the positron along the muon spin direction is enhanced due to the parity-violating muon decay. Measuring the time difference between the implantation time of the and its decay time , detected via the decay positron (for ) allows one to determine the temporal evolution of the muon-spin polarization (time ensemble average) via the positron count rate :
| (1) |
were gives the scale of the counted positrons, is a time-independent background of uncorrelated events, and is the observable decay asymmetry. The latter is a function of the positron energy and the solid angle of the positron detectors. In our experimental setup . The exponential function describes the radioactive muon decay. From the measured one can extract the local magnetic fields, field distributions, and field fluctuations present in the sample Yaouanc11 . In bulk SR experiments with an energy of MeV are used, which originate from the positively charged pion decay at rest at the surface of the muon production target (“surface muons”). In this case the mean stopping depth in condensed matter is of the order of m. To investigate thin films LE-SR makes use of epithermal muons ( eV). They are created by moderating surface muons Morenzoni04 ; Harshman87 . After reacceleration, the final muon implantation energy is controlled by applying a voltage to the sample. By tuning the energy between keV and keV, mean depths between a few and a few hundred nanometers can be chosen. The normalized stopping distribution of in a LCO film deposited on a LSAO substrate for different implantation energies is depicted in Fig. 4.
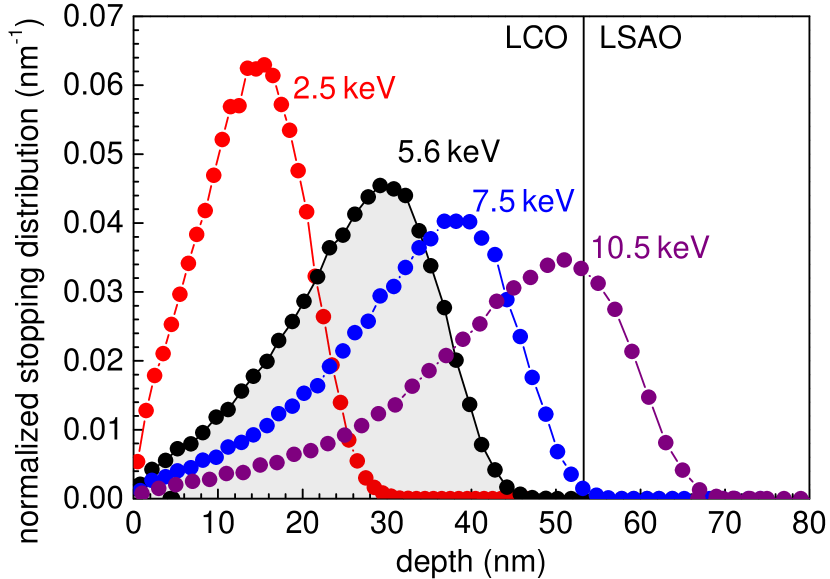
For each Sr content, we used a mosaic of four thin-film samples, each with lateral dimensions of cm2, glued onto a silver-coated aluminum plate with silver paint. To reach temperatures in the range K to K a cold-finger cryostat was used. The experiments were performed in ultra-high vacuum at a pressure of about mbar. The data presented here were all obtained with a muon implantation energy keV. For this energy Monte Carlo simulations performed using TRIM.SP Eckstein91 yield a mean implantation depth of about nm which is optimal for these films (Fig. 4). In order to check the homogeneity of the films across their thickness SR time spectra for different values of were measured showing no differences. LE-SR measurements were performed in zero magnetic field (ZF) to determine the internal magnetic fields at the muon stopping site, which are related to the staggered magnetization, as well as in weak transverse magnetic fields (wTF) in the range of mT to mT to obtain the magnetic transition temperatures , , , and the magnetic volume fractions .
III Results and Discussion
III.1 Antiferromagnetic regime
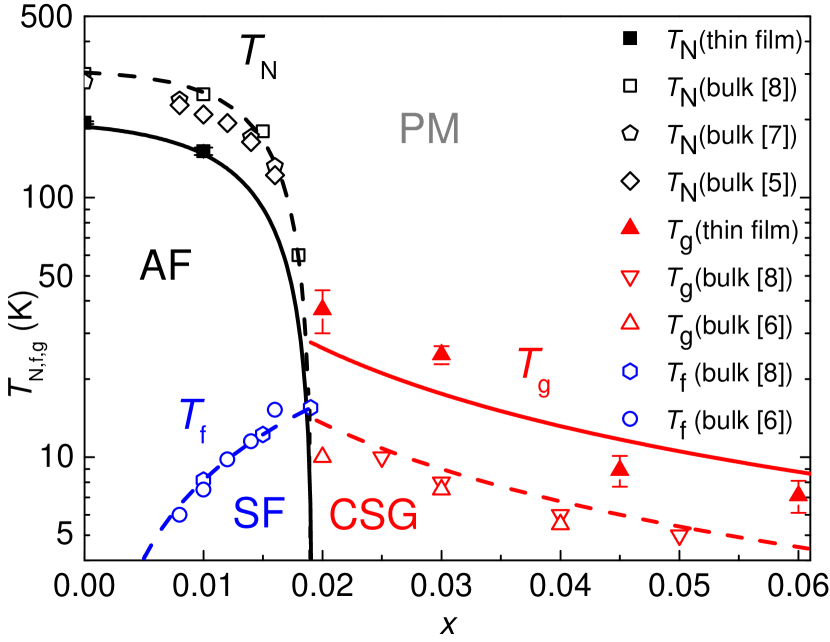
We first investigated thin-film samples with and in the AF regime of the phase diagram. From temperature scans in a weak magnetic field the Néel temperatures were determined to be K and K (Fig. 5). These values are much lower compared to bulk values, as will be discussed later in detail.
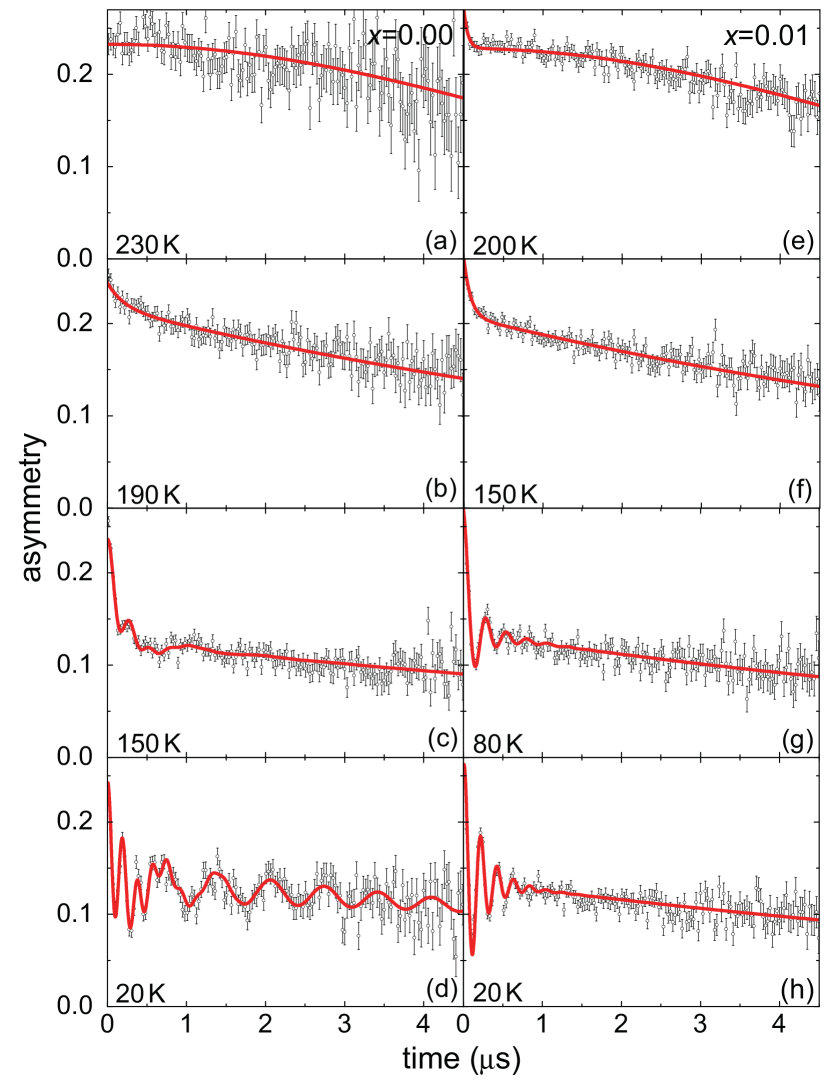
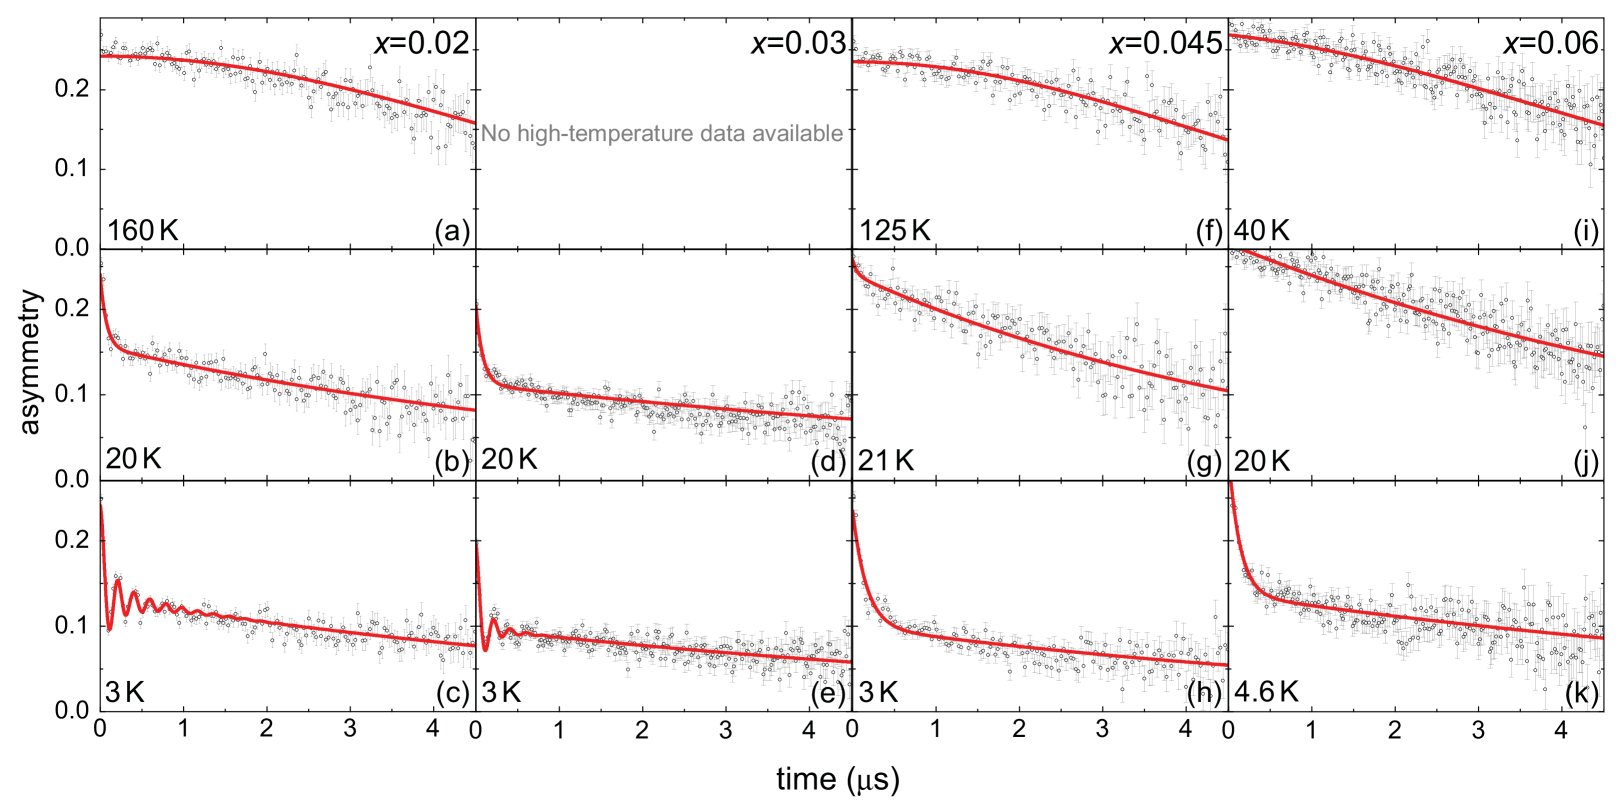
In the paramagnetic (PM) state () the asymmetry time spectra in ZF, , are well described by a Gaussian Kubo-Toyabe function [Fig. 6 (a)], corresponding to a 3D Gaussian field distribution of dense randomly oriented static magnetic moments:
| (2) |
where is the decay asymmetry and the depolarization rate. This is expected since only the nuclear moments of La and Cu contribute to . The PM fluctuation rate of the electronic Cu moments is too high to have an observable influence on the ZF spectra. The nuclear moments, however, are static on SR time scales. In all ZF fits a temperature-independent constant background asymmetry was taken into account, which originates from the muons stopping in the silver coating of the sample plate. Only about to of the muons stop in the sample. Close to the magnetic transition () the time spectrum changes first to a combination of a Gaussian Kubo-Toyabe function with an exponential decay [Fig. 6 (e)] and then to a superposition of exponential decay functions [Fig. 6 (b) and (f)]. At these temperatures the electronic fluctuations slow down, giving rise to a stronger depolarization of the muons. This behavior is also observed in the PM phase of bulk samples Borsa95 .
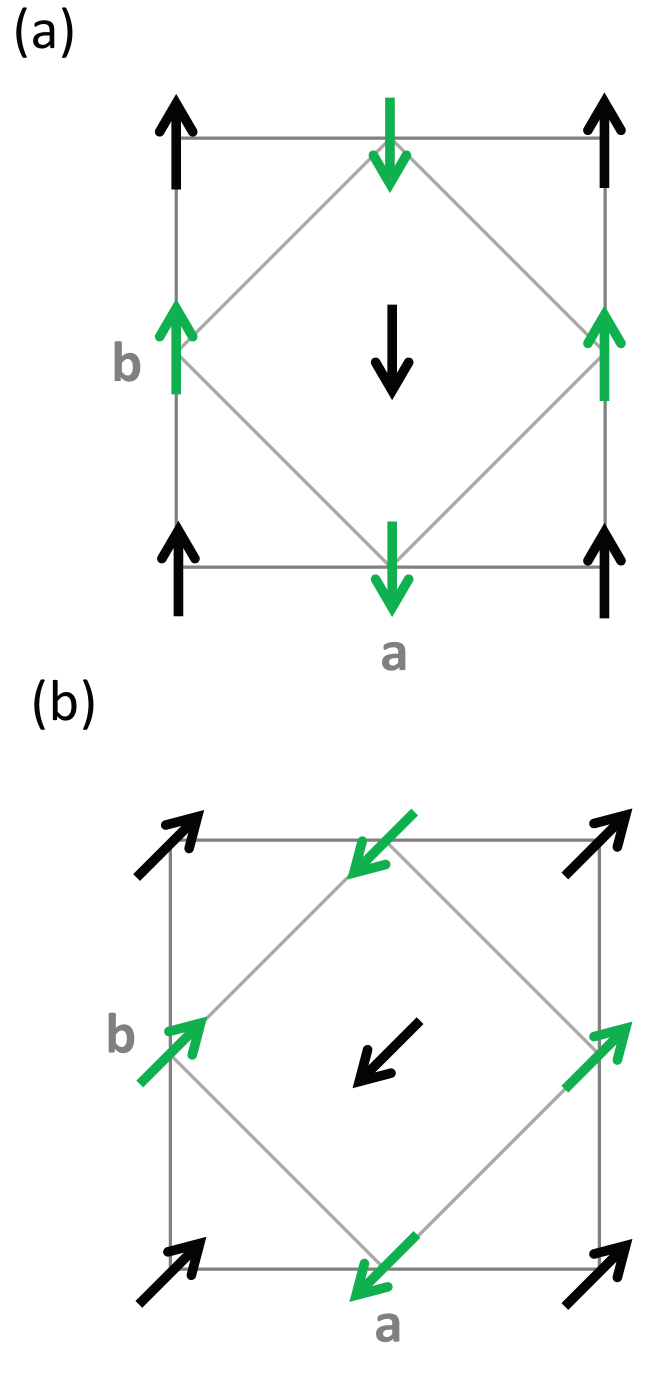
In the AF phase, for , the ordered magnetic moments generate a local magnetic field at the stopping site of the muon, which is related to the sublattice magnetization of the Cu2+ electronic moments. By using first-principles cluster calculations Suter2003 the muon stopping site has been located at (0.119, 0.119, 0.2128) in the orthorhombic unit cell, Å off the apical oxygen, as in a oxygen-hydrogen bond (circles in Fig. 7). The ZF asymmetry spectra can then be described by
| (3) |
where and reflect the fraction of the muons having their spin initially transverse and longitudinal to the internal field direction, respectively. The relaxation rate is proportional to the width of the internal field distribution sensed by the muon. In the presence of disorder can be larger than , resulting in an overdamped asymmetry spectrum without oscillations. In the presence of fluctuating magnetic fields the longitudinal part of the muon spin polarization is relaxing as well with the corresponding rate (s-1 likely due to nuclear dipole depolarization only). The phase is in general a temperature-independent constant.
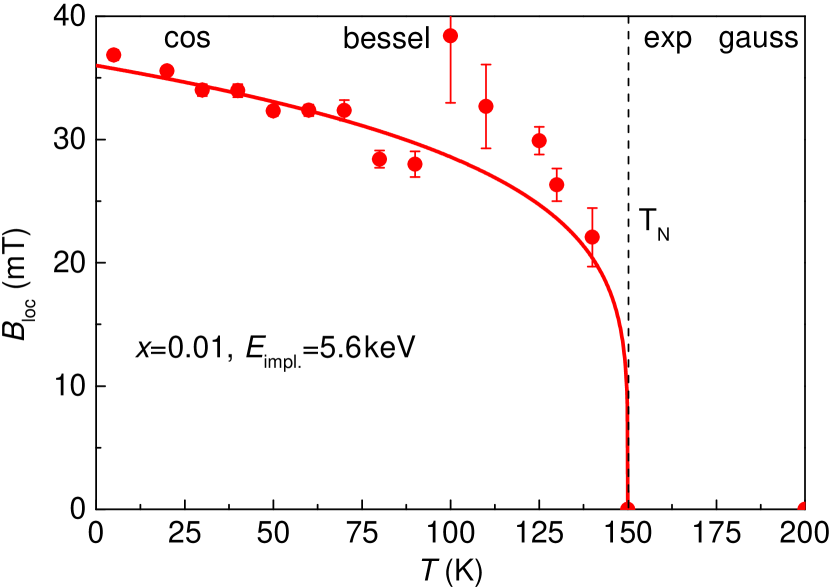
In the AF phase for , the strongly damped oscillations in can be better described by a Bessel function of the first kind , which at larger times is equivalent to a cosine with a phase shift of and an additional damping of , see Fig. 6 (c) and (g). When using the pure cosine function the phase strongly increases with increasing temperature, from less than at K to more than at higher temperatures. In this case the Bessel function provides a better description of the measured :
| (4) |
This behavior may arise from incommensurate magnetism Yaouanc11 , where the period of the magnetic structure is not an integer multiple of the lattice constant, or from the presence of nanometer scale AF domains. Both cases lead to an asymmetric magnetic field distribution, which is better described by a Bessel function. In neutron diffraction studies on bulk material incommensurate magnetism was only observed for and K Yamada98 . For , is well described by a cosine function as in bulk samples, see Fig. 6 (d) and (h).
In the AF state, the relative strength of the parameters and [see Eq. (3)] reflects the local magnetic field distribution which is determined by the spatial arrangement of the Cu electronic magnetic moments. If the field at the muon stopping site is isotropic, corresponding to an electronic moment vector pointing with equal probability in all three directions, then the ratio : is :. If the spins are aligned within the CuO2 planes, corresponding to a field at the stopping site with only planar components, the ratio : is :. Both LSCO samples ( and ) show at the lowest temperature a ratio close to :. This result is in agreement with neutron data which revealed that the Cu electronic magnetic moments are preferentially aligned in the CuO2 planes Vaknin87 .
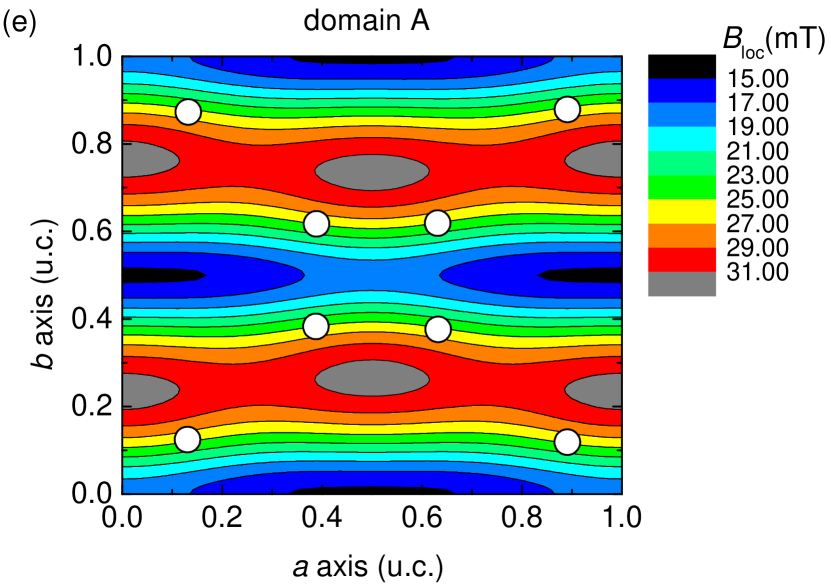
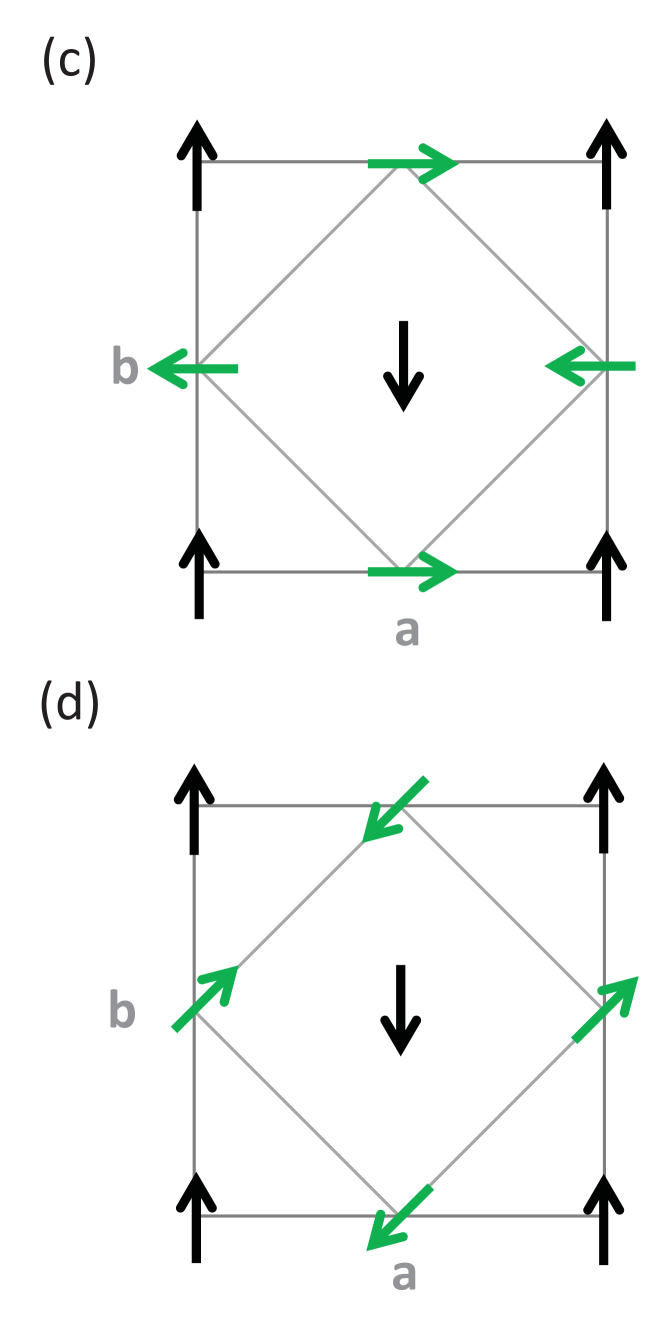
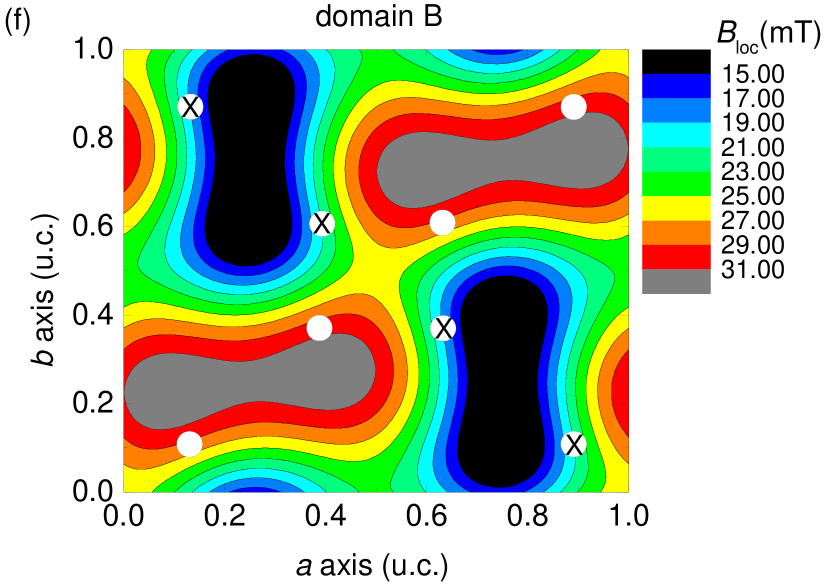
As evidenced by the beating in the asymmetry spectrum two frequencies, corresponding to two local fields, are observed in LCO thin films [Fig. 6 (d)]. Extrapolating the temperature dependence of the measured fields to K by a power law yields mT and mT. For LCO bulk samples only one local magnetic field mT has been reported Borsa95 , although there are hints of a similar lower second field from unpublished data of high quality single crystals. A possible explanation for the appearance of an additional local magnetic field is a mixture of different alignments of the Cu electronic magnetic moments within the CuO2 planes. From powder neutron diffraction experiments on LCO the spin structure shown in Fig. 7 (a) was determined Vaknin87 . The electronic spins of different CuO2 planes (black and green) are aligned parallel or antiparallel to each other in the orthorhombic unit cell. By taking only dipole magnetic fields arising from the Cu electronic magnetic moments into account ( Pozzi99 ), this arrangement leads to the magnetic field distribution in the plane of the muon stopping site shown in Fig. 7 (e). Since the muon stops close to the apical oxygen, the same magnetic field value is present at crystallographically equivalent muon stopping sites [marked with circles in Fig. 7 (e)]. Therefore, only one is observable in this “domain A”. A similar AF ordering but with rotated Cu spins within the CuO2 planes, see for example Fig. 7 (b) - (d), generates two different magnetic field values at crystallographically equivalent muon stopping sites indicated by “domain B” [see Fig. 7 (f)]. The calculated field values differ from the local magnetic fields determined by LE-SR. This deviation is not surprising, because transferred hyperfine fields as well as higher-order corrections, e.g. due to the Dzyaloshinskii-Moriya (DM) interactions, which could change the field values by a factor of two, are neglected here. To determine the magnetic field values precisely full density functional theory calculations have to be performed. The asymmetry (related to ) is more than two times larger compared to (related to ). Since the ZF oscillation amplitudes are proportional to the magnetic volume fractions of the domains in the sample a mixture of two spin arrangements has to be present. While is present in both domains but only in domain B, the asymmetry ratio corresponds to a volume ratio domain A to domain B of : for the two spin arrangements.
Different Cu spin arrangements could originate from structural changes. In general, the axis of thin-film samples grown on a LSAO substrate is larger compared to the bulk value. These changes in the crystal structure have a strong influence on the anisotropic parts of the spin Hamiltonian Coffey91 , and hence on the spin configuration. This is consistent with observations for LCO crystallizing in the metastable tetragonal Nd2CuO4 structure with a axis lattice parameter of nm only Hord10 . Bulk SR Hord10 revealed a lower internal magnetic field of mT and a different spin arrangement is expected compared to LCO in the orthorhombic phase. In our study no changes are observed in the axis lattice parameter compared to bulk values. So the existence of a mixture of tetragonal and orthorhombic phases seems unlikely. It is more likely that magnetic domains with different spin arrangements are present. This would also explain that in some bulk samples a second field is observed, where no tetragonal structure exists and is higher compared to thin films. A change in the Cu spin arrangement could be caused by dislocations or defects, which could arise in thin films from the lattice mismatch between LSCO and LSAO.
For the nominal Sr content the generic behavior of as function of is similar as for , but only one is present just like in bulk samples [Fig. 6 (h)]. In bulk samples with spin freezing of the doped holes is observed below K (Fig. 5). As determined by ZF SR measurements, this freezing below manifests itself as an drastic increase of the slope (see Ref. Borsa95, ). In the present study no increase is observed down to K (Fig. 8). Thus the shape of and the fact that mT is below mT indicate a strong suppression of hole spin freezing in LSCO thin film samples.
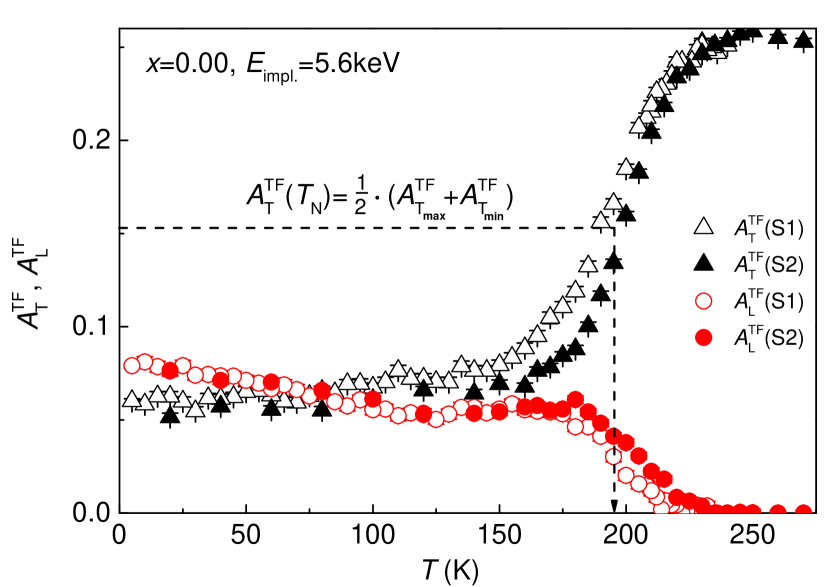
The Néel temperatures as well as the magnetic volume fractions were determined from temperature scans in a weak magnetic field applied perpendicular to the initial muon spin polarization and to the film surface. The asymmetry time spectra in a wTF are described by:
| (5) |
Eq. 5 represents the parramagnetic part of the muon spin polarization. The superposition of the antiferromagnetic and the applied field leads to a strong damping of about s-1 of the full polarization which has been neglected in the fit. and are the transverse and longitudinal oscillation amplitudes. Above , is the full asymmetry, since only is present. Below , the superposition of the small external and the internal magnetic fields leads to a strong dephasing of the signal, so decreases to a level corresponding to the non-magnetic fraction plus the background level. represents the part of non-precessing muon spins. A decrease in with a simultaneous increase in demonstrates static magnetism. is the depolarization rate of the precessing muon fraction and reflects the field width observed by the muons in the nonmagnetic parts of the sample. At the lowest temperature it is dominated by the nuclear magnetic moments of La and Cu. The depolarization rate for all measurements, and is the temperature-independent detector phase.
The magnetic volume fraction is given by
| (6) |
taking into account a constant background asymmetry of as in ZF measurements. The determined volume fractions are listed in Table 1. The magnetic transition temperatures were defined as the temperature for which
| (7) |
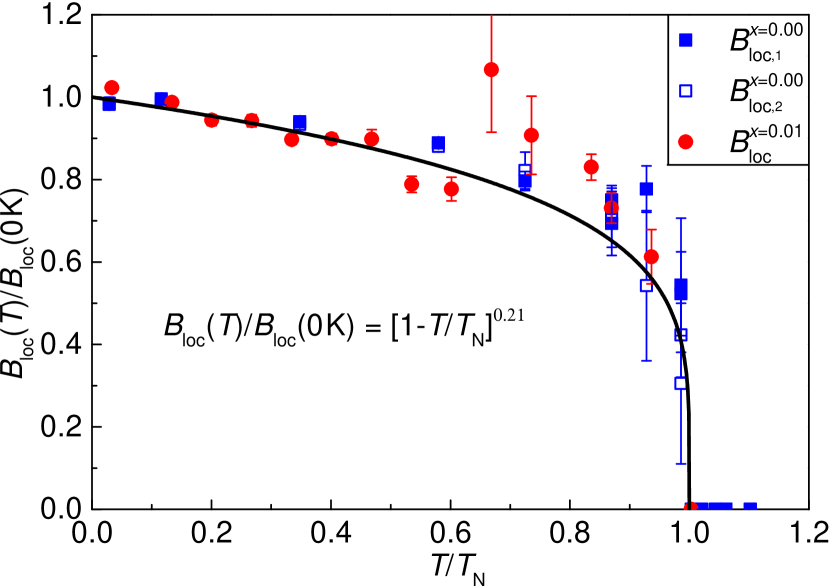
yielding K (see Fig. 9) and K. Both values are well below the respective bulk values of K and K (see Fig. 5). The relation between the normalized internal magnetic field and the normalized temperature can be analyzed using Borsa95 :
| (8) |
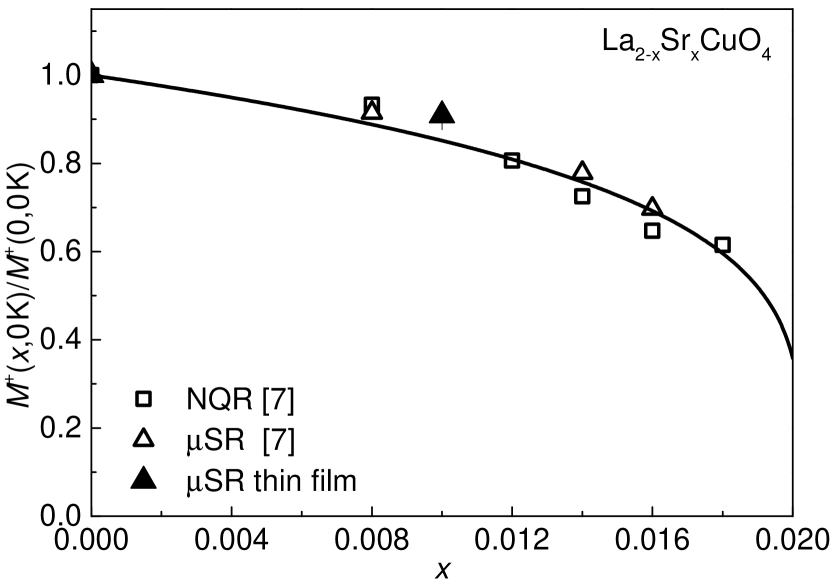
The obtained exponent is similar for both Sr contents as well as for and , suggesting a common underlying ordering mechanism. The thin-film data are well described with found in the bulk Borsa95 (Fig. 10). Furthermore, the doping dependence of the normalized staggered magnetization in the thin-film samples of the present work are in agreement with nuclear quadrupole resonance (NQR) and SR results obtained for bulk samples Borsa95 (Fig. 11). The staggered magnetization follows the empirical relation given in Ref. Borsa95, :
| (9) |
with a critical doping of and an exponent (Fig. 11).
In summary, whereas in the AF phase of LSCO the generalized behavior of as a function of and is similar in thin films and bulk samples (Figs. 10 and 11), is strongly suppressed, and is not observed down to K in thin films. The local magnetic fields at the muon stopping site are instead very similar in bulk and thin films, indicating an equal magnitude of ordered electronic moments.
III.2 Disordered Magnetic Phase for
In LSCO films with and the ZF asymmetry time spectra show an oscillation at the lowest temperatures [Fig. 12 (c) and (e)], while the temperature dependence of given by Eq. (8) is changed drastically. The best fit to for yields . Since is characteristic for the AF phase, samples with have to be instead in the peculiar low temperature magnetic phase (Fig. 5), leading to ZF SR precession too. This phase is termed in the literature as “spin-glass” or “cluster spin-glass” (CSG) phase Chou93 ; Niedermayer98 ; Rigamonti06 . Although somewhat misleading, we adopt this terminology for consistency with the literature. In the CSG phase dynamical spin and charge stripes have been found in some cuprate systems Tranquada95 ; Bianconi96 . Microsegregation of mobile holes leads to hole-poor AF areas separated by hole-rich nonmagnetic domain walls. The presence of charge or spin density waves within the CSG phase is another proposed state Torchinsky2013 . At low temperatures the dynamics of the CSG state slow down and oscillations are observed in the ZF asymmetry time spectra in bulk samples Niedermayer98 . For LSCO thin-film samples oscillations are observed at low temperatures too [Fig. 12 (c) and (e)]. At K the Bessel function [Eq. (4)] describes the obtained SR data for and very well. This suggests the presence of incommensurate magnetism in the CSG phase as observed by neutron diffraction in bulk samples Yamada98 .
| (K) | (%) | |
|---|---|---|
For and the whole temperature scale is shifted down since . Therefore no ZF oscillations were observed down to K [Fig. 12 (h) and (k)]. The asymmetry time spectra at K () and K () show instead a strong double-exponential behavior (sum of two exponential functions) with considerably enhanced depolarization rates, as present at K for and . For all asymmetry time spectra for show an exponential decay [Fig. 12 (g) and (j)], while for they are described by a Gaussian Kubo-Toyabe function [Fig. 12 (a), (f), and (i)]. Therefore, the LSCO SR spectra for all investigated samples show the same behavior, namely a slowing down of electronic fluctuations in the PM phase.
From wTF SR measurements the glass transition temperature and the magnetic volume fraction were determined for different with the method described in the previous section [Eqs. (6) and (7)]. The corresponding values are listed in Table 1. The present values of are all significantly larger than those determined by bulk SR Niedermayer98 ; Borsa95 (see Fig. 5). This difference could not be ascribed to the method for determining . If we define in the same way as in Refs. Borsa95, and Niedermayer98, we obtain consistent values.
III.3 Discussion
What is the origin of the differences between the thin-film and the bulk phase diagrams? There are various potential mechanisms and parameters which may modify the phase diagram, such as oxygen off-stoichiometry, strain, geometric frustration or defects.
Oxygen off-stoichiometry would indeed lead to an increase of doped holes in the CuO2 planes and hence to a . This in turn would yield a lower (Ref. Wells97, ) as found in this study (Fig. 5). However, at the same time should increase, while should decrease. This is the exact opposite to our observation. The case is also unlikely, since is the same in bulk material and thin films (Figs. 11 and 13). Furthermore, the border between the AF and the CSG phase () is not shifted (Fig. 5). Additional interstitial oxygen in the films would expand the axis lattice parameter Butko09 different to our observations: (Fig. 2). In order to double-check the possible effects of the variations in oxygen stoichiometry, we post-annealed two sets of LCO films in high vacuum, using two different procedures (temperature and time). Both sets show the same and the same temperature dependence of the staggered magnetization. Therefore, oxygen off-stoichiometry is quite small and cannot be the dominant source of the differences between the bulk and the thin-film samples.
For undoped cuprates is related to the inter-plane coupling constant and the 2D in-plane correlation length by
| (10) |
where is the distance between the copper moments and the reduced magnetic moment Chakravarty88 ; Chakravarty90 ; Hasenfratz91 . might be sensitive to strain, whereas is influenced by the in-plane coupling constant (Ref. Aronson91, ) and the amount of disorder (Ref. Chen00, ). A reduction of and/or would lead to the observed decrease in .
In the following possible strain effects will be discussed, assuming the absence of any disorder (). In this case is given by
| (11) |
with a spin stiffness for LCO Hasenfratz91 ; Aronson91 .
Poisson strain is likely to modify as well as , because the lattice parameters are changed keeping the unit cell volume constant. When compared to its bulk value, the axis is in general enlarged for LSCO grown on LSAO due to compressive strain of the substrate Tsukada02 (as long as the sample thickness is below the critical value of about unit cells Butko09 ), reducing . At the same time LCO grown on LSAO should exhibit a higher because of the changed in-plane lattice constants [ (Ref. Aronson91, )]. To reach the observed , a is required. Since the axis lattice constants of the films are very close to the bulk values, such a strong reduction of is unlikely. Thus, Poisson strain is not the main reason for the drastic reduction.
In strain released LCO thin films the and lattice parameters differ from their bulk values Butko09 through Madelung strain, leading to a smaller unit cell volume as also obtained by applying hydrostatic pressure. Raman scattering studies on AF single crystal LCO Aronson91 showed that pressure leads to an enhancement of and therefore to an increase of . Therefore, and should be also increased in LCO thin films. This is the opposite to our observations. A reduction of the Néel temperature through Madelung strain is therefore unlikely.
Geometrical frustration within a system may also influence the transition temperatures. A low asymmetry between the in-plane lattice constants could lead to a reduced . A tetragonal system () consists of perfectly geometrically frustrated Cu electronic moments, since the CuO2 layers within one unit cell are shifted by half a unit cell against each other [Fig. 7 (a)]. A more orthorhombic system () is less frustrated and exhibits a larger . In LCO thin films a lower in-plane lattice constants asymmetry is observed compared to bulk values Butko09 : . Thin films are hence more frustrated which leads to a reduction of , resulting in a lower . But if geometrical frustration would be the main source of the reduced Néel temperature a similar system with should have an even lower because of a lower . Sr2CuCl2O2 (SCCO) is such a system. It exhibits almost the same in-plane coupling constant (), but at the same time a reduced Cu electronic magnetic moment (SCCO: Greven94 , LCO: Pozzi99 ). Although SCCO is perfectly frustrated and it shows a K Greven94 which is well above that one observed for LCO thin films ( K, nm). Even though geometrical frustration will lead to a reduction of , the observed reduction is too substantial to originate from this source only.
What might influence the magnetic ground state as well are higher-order terms which are present in addition to the dominant super-exchange, like next-nearest-neighbor exchange. It has been shown that especially the DM interaction is very sensitive to the crystal symmetry Coffey91 , which could naturally explain the spin re-orientation discussed in Sec. III.1. However, it is unlikely that these higher-order corrections will have a substantial effect on , , or as observed in this study.
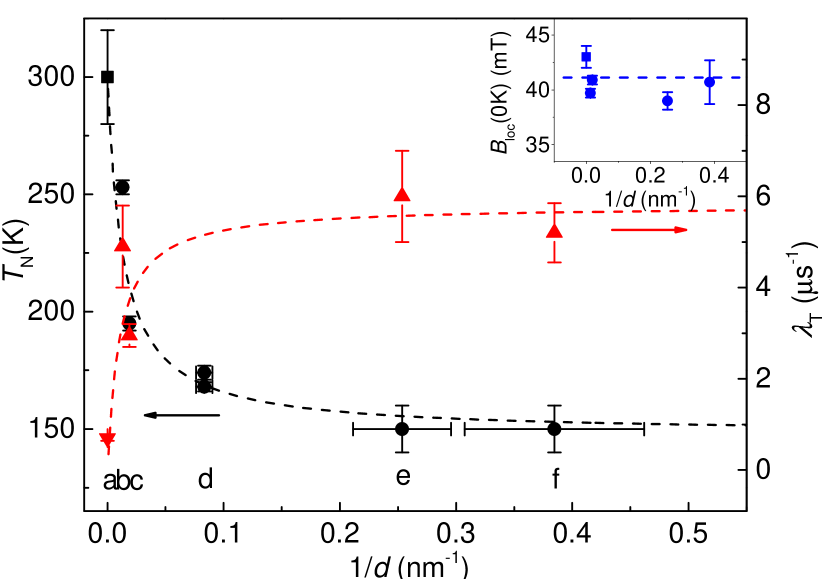
Epitaxial thin films differ from the bulk samples by the presence of strain-induced defects, such as stacking faults and misfit dislocations. The latter have been observed in high-resolution cross-section transmission electron microscopy measurements in LCO films He07 . Typically, the defect density in stress released thin films is much higher compared to bulk samples. Depending on the nature of the defect, it can lead to charge trapping or pinning of collective modes like charge stripes, charge density waves, or spin density waves (weak collective pinning in the case of point defects, or strong pinning in the case of dislocations), likely to be present at higher doping (). This could indeed give rise to an increase of as discussed by Shengelaya et al. (Ref. Shengelaya99, ). This picture is also supported theoretically as discussed in Refs. Chen00, and Murthy88, where the influence of short-length-quantum and long-range disorder on the spin- quasi-2D Heisenberg antiferromagnet on a square lattice (QHAF) is discussed. In Ref. Chen00, disorder by dilution is studied leading to an explicit expression for the reduction of as function of dilution, which was experimentally verified by Carretta et al. (Ref. Carretta95, ). This dilution is likely to introduce also magnetic frustration which has been clarified by new experimentally results by Carretta et al. (Ref. Carretta11, ) and theoretically by Liu and Chernyshev (Ref. Liu13, ). Whereas disorder and/or frustration by dilution are directly applicable to Zn and Mg doping in LSCO, it is probably not the case for thin films for which misfit dislocations are the most likely source of disorder. Murthy Murthy88 showed that a QHAF is much more sensitive to random fields than to moderate random in-plane couplings. Hence, misfit dislocations due to strain and strain release would have a much stronger influence on as suggested in Ref. Chen00, . Unfortunately, no quantitative expression for the reduction of has been derived in Ref. Murthy88, . The measured ZF depolarization rates [Eq. (3)] support this interpretation. In Fig. 13 the Néel temperature , the ZF depolarization rate as well as the local magnetic field ( K) (inset) of LCO and LCO superlattices are plotted as a function of the inverse thickness . While ( K) stays constant, decreases with decreasing thickness systematically. At the same time increases with decreasing . The ZF depolarization rate is a measure of the magnetic disorder, which is related to the before mentioned random fields Murthy88 . According to theory Chen00 ; Murthy88 disorder leads to a reduction of in agreement with Fig. 13. So disorder seems to be a probable mechanism which could explain consistently the differences in and of bulk and thin-film magnetic phase diagrams.
Extended LE-SR studies of thin films with different thicknesses on the same substrate and thin films with the same thickness on different substrates, would be necessary to test the presented interpretations.
IV Summary and Conclusions
In this study we determined the magnetic phase diagram of LSCO thin films (thickness nm) in the doping range . The absolute scales of the transition temperatures differ substantially between the bulk and thin film samples. The Néel temperatures are strongly reduced in the thin films and in the AF region no spin freezing is observed down to K. The CSG transition temperatures lie well above the corresponding bulk values. Oxygen off-stoichiometry and strain-induced changes of the lattice parameters or higher-order magnetic coupling constants are unlikely to explain the observed differences. Misfit dislocations through strain release might well be at the heart of the discovered effects. Overall, the thin-film and bulk samples exhibit similar magnitude, temperature, and doping dependence of the staggered magnetization and the same border between the AF and the CSG phase (). The determined magnetic phase diagram provides a solid basis for future studies of multilayer and superlattice LSCO thin films.
Acknowledgements.
We gratefully acknowledge Hans-Peter Weber for his excellent technical support. This work was partly supported by the Swiss National Science Foundation. Research at Brookhaven was supported by the U.S. Department of Energy, Basic Energy Sciences, Materials Sciences and Engineering Division.References
- (1) E. Dagotto, Rev. Mod. Phys. 66, 763 (1994).
- (2) M. A. Kastner, R. J. Birgeneau, G. Shirane, and Y. Endoh, Rev. Mod. Phys. 70, 897 (1998).
- (3) H. Sato, A. Tsukada, M. Naito, A. Matsuda, Phys. Rev. B 61, 12447 (2000).
- (4) A. Rigamonti, P. Carretta, and N. Papinutto, Lect. Notes Phys. 684, 351 (2006).
- (5) J. H. Cho, F. C. Chou, and D. C. Johnston, Phys. Rev. Lett. 70, 222 (1993).
- (6) F. C. Chou, F. Borsa, J. H. Cho, D. C. Johnston, A. Lascialfari, D. R. Torgeson, and J. Ziolo, Phys. Rev. Lett. 71, 2323 (1993).
- (7) F. Borsa, P. Carretta, J. H. Cho, F. C. Chou, Q. Hu, D. C. Johnston, A. Lascialfari, D. R. Torgeson, R. J. Gooding, N. M. Salem, and K. J. E. Vos, Phys. Rev. B 52, 7334 (1995).
- (8) Ch. Niedermayer, C. Bernhard, T. Blasius, A. Golnik, A. Moodenbaugh, and J. I. Budnick, Phys. Rev. Lett. 80, 3843 (1998).
- (9) S. Chakravarty, B. I. Halperin, and D. R. Nelson, Phys. Rev. Lett. 60, 1057 (1988); Phys. Rev. B 39, 2344 (1989).
- (10) B. Keimer, N. Belk, R. J. Birgeneau, A. Cassanho, C. Y. Chen, M. Greven, M. A. Kastner, A. Aharony, Y. Endoh, R. W. Erwin, and G. Shirane, Phys. Rev. B 46, 14034 (1992).
- (11) M. Matsumura, H. Yasuoka, Y. Ueda, H. Yamagata, and Y. Itoh, J. Phys. Soc. Jpn 63, 4331 (1994).
- (12) D. M. Ginsberg, Physical Properties of High Temperature Superconductors (World Scientific Publishing, Singapore, 1989–1996).
- (13) I. Božović, G. Logvenov, M. A. J. Verhoeven, P. Caputo, E. Goldobin, and M. R. Beasley, Phys. Rev. Lett. 93, 157002 (2004).
- (14) E. Morenzoni, B. M. Wojek, A. Suter, T. Prokscha, G. Logvenov, and I. Božović, Nat. Commun. 2, 272 (2011).
- (15) B. M. Wojek, E. Morenzoni, D. G. Eshchenko, A. Suter, T. Prokscha, H. Keller, E. Koller, Ø. Fischer, V. K. Malik, C. Bernhard, and M. Döbeli, Phys. Rev. B 85, 024505 (2012).
- (16) T. Prokscha, E. Morenzoni, K. Deiters, F. Foroughi, D. George, R. Kobler, A. Suter, and V. Vrankovic, Nucl. Instrum. Methods Phys. Res., Sect. A 595, 317 (2008).
- (17) E. Morenzoni, H. Luetkens, T. Prokscha, A. Suter, S. Vongtragool, F. Galli, M. B. S. Hesselberth, N. Garifianov, and R. Khasanov, Phys. Rev. Lett. 100, 147205 (2008).
- (18) A. Suter, E. Morenzoni, T. Prokscha, B. M. Wojek, H. Luetkens, G. Nieuwenhuys, A. Gozar, G. Logvenov, and I. Božović, Phys. Rev. Lett. 106, 237003 (2011).
- (19) A. V. Boris, Y. Matiks, E. Benckiser, A. Frano, P. Popovich, V. Hinkov, P. Wochner, M. Castro-Colin, E. Detemple, V. K. Malik, C. Bernhard, T. Prokscha, A. Suter, Z. Salman, E. Morenzoni, G. Cristiani, H.U. Habermeier, and B. Keimer, Science 332, 937 (2011).
- (20) H. Sato and M. Naito, Physica C 274, 221 (1997).
- (21) J.-P. Locquet, J. Perret, J. Fompeyrine, E. Mächler, J. W. Seo, and G. Van Tendeloo, Nature (London) 394, 453 (1998).
- (22) W. Si, H.C. Li, and X. X. Xi, Appl. Phys. Lett. 74, 2839 (1999).
- (23) I. Božović, G. Logvenov, I. Belca, B. Narimbetov, and I. Sveklo, Phys. Rev. Lett. 89, 107001 (2002).
- (24) W. Si and X. X. Xi, Appl. Phys. Lett. 78, 240 (1999).
- (25) M. Abrecht, D. Ariosa, D. Clotta, S. Mitrovic, M. Onellion, X. X. Xi, G. Margaritondo, and D. Pavuna, Phys. Rev. Lett. 91, 057002 (2003).
- (26) V. Y. Butko, G. Logvenov, N. Božović, Z. Radović, and I. Božović, Adv. Mat. 21, 3644 (2009).
- (27) A. Suter, J.-P. Locquet, E. Morenzoni, T. Prokscha, D. G. Eshchenko, N. Garifianov, R. Khasanov, H. Luetkens, and J. W. Seo, J. Magn. Magn. Mater. 272–276, 110 (2004).
- (28) E. Morenzoni, T. Prokscha, A. Suter, H. Luetkens, and R. Khasanov, J. Phys.: Condens. Matter 16, S4583 (2004).
- (29) I. Božović, IEEE Trans. Appl. Supercond. 11, 2686 (2001).
- (30) D. Lampakis, D. Palles, E. Liarokapis, C. Panagopoulos, J. R. Cooper, H. Ehrenberg, and T. Hartmann, Phys. Rev. B 62, 8811 (2000).
- (31) P. G. Radaelli, D. G. Hinks, A. W. Mitchell, B. A. Hunter, J. L. Wagner, B. Dabrowski, K. G. Vandervoort, H. K. Viswanathan, and J. D. Jorgensen, Phys. Rev. B 49, 4163 (1994).
- (32) Y. Ando, S. Komiya, K. Segawa, S. Ono, and Y. Kurita, Phys. Rev. Lett. 93, 267001 (2004).
-
(33)
A. Yaouanc and P. Dalmas de Réotier, Muon Spin Rotation, Relaxation, and Resonance: Applications to Condensed Matter (Oxford University
Press, Oxford, 2011);
V. P. Smilga and Yu. M. Belousov, The Muon Method in Science (Nova Science Publishers, 1994). - (34) D. R. Harshman, A. P. Mills Jr., J. L. Beveridge, K. R. Kendall, G. D. Morris, M. Senba, J. B. Warren, A. S. Rupaal, and J. H. Turner, Phys. Rev. B 36, 8850 (1987).
- (35) W. Eckstein, Computer Simulation of Ion-Solid Interactions (Springer, Berlin, 1991).
- (36) A. Suter and B. M. Wojek, Physics Procedia 30, 69 (2012).
- (37) H. U. Suter, E. P. Stoll, and P. F. Meier, Physica B 326, 329 (2003).
- (38) M. Reehuis, C. Ulrich, K. Prokeš, A. Gozar, G. Blumberg, S. Komiya, Y. Ando, P. Pattison, and B. Keimer, Phys. Rev. B 73, 144513 (2006).
- (39) K. Yamada, C. H. Lee, K. Kurahashi, J. Wada, S. Wakimoto, S. Ueki, H. Kimura, Y. Endoh, S. Hosoya, G. Shirane, R. J. Birgeneau, M. Greven, M. A. Kastner, and Y. J. Kim, Phys. Rev. B 57, 6165 (1998).
- (40) D. Vaknin, S. K. Sinha, D. E. Moncton, D. C. Johnston, J. M. Newsam, C. R. Safinya, and H. E. King Jr., Phys. Rev. Lett. 58, 2802 (1987).
- (41) R. Pozzi, M. Mali, D. Brinkmann, and A. Erb, Phys. Rev. B 60, 9650 (1999).
- (42) D. Coffey, T. M. Rice, and F. C. Zhang, Phys. Rev. B 44, 10112 (1991).
- (43) R. Hord, H. Luetkens, G. Pascua, A. Buckow, K. Hofmann, Y. Krockenberger, J. Kurian, H. Maeter, H.-H. Klauss, V. Pomjakushin, A. Suter, B. Albert, and L. Alff, Phys. Rev. B 82, 180508 (2010).
- (44) J. M. Tranquada, B. J. Sternlieb, J. D. Axe, Y. Nakamura, and S. Uchida, Nature (London) 375, 561 (1995).
- (45) A. Bianconi, N. L. Saini, A. Lanzara, M. Missori, T. Rossetti, H. Oyanagi, H. Yamaguchi, K. Oka, and T. Ito, Phys. Rev. Lett. 76, 3412 (1996).
- (46) D. H. Torchinsky, F. Mahmood, A. T. Bollinger, I. Božović, and N. Gedik, Nat. Mater. 12, 387 (2013).
- (47) B. O. Wells, Y. S. Lee, M. A. Kastner, R. J. Christianson, R. J. Birgeneau, K. Yamada, Y. Endoh, and G. Shirane, Science 277, 1067 (1997).
- (48) P. Hasenfratz and F. Niedermeyer, Phys. Lett. B 268, 231 (1991).
- (49) S. Chakravarty and R. Orbach, Phys. Rev. Lett. 64, 224 (1990).
- (50) M. C. Aronson, S. B. Dierker, B. S. Dennis, S.-W. Cheong, and Z. Fisk, Phys. Rev. B 44, 4657 (1991).
- (51) Y.–C. Chen and A. H. Castro Neto, Phys. Rev. B 61, R3772 (2000).
- (52) A. Tsukada, T. Greibe, and M. Naito, Phys. Rev. B 66, 184515 (2002).
- (53) M. Greven, R. J. Birgeneau, Y. Endoh, M. A. Kastner, B. Keimer, M. Matsuda, G. Shirane, and T. R. Thurston, Phys. Rev. Lett. 72, 1096 (1994).
- (54) J. He, R. F. Klie, G. Logvenov, I. Božović, and Y. Zhu, J. Appl. Phys. 101, 073906 (2007).
- (55) A. Shengelaya, Guo-meng Zhao, C. M. Aegerter, K. Conder, I. M. Savi, and H. Keller, Phys. Rev. Lett. 83, 5142 (1999).
- (56) G. Murthy, Phys. Rev. B 38, 5162 (1988).
- (57) P. Carretta, A. Rigamonti, and R. Sala, Phys. Rev. B 55, 3734 (1997).
- (58) P. Carretta, G. Prando, S. Sanna, R. De Renzi, C. Decorse, and P. Berthet, Phys. Rev. B 83, 180411(R) (2011).
- (59) S. Liu and A. L. Chernyshev, Phys. Rev. B 87, 064415 (2013).