SD1000 Collaboration: Hunting down the subdwarf populations
Abstract
Separating the subdwarf populations may shed light on their formation history and give unique insights into the atmospheric processes that are thought to be responsible for their abundance diversity. Such a task requires complex and time consuming spectral analyses, which we started to tailor to our objectives a year ago. Here we report the updates that have been made over the past year and will be the standard method in SD1000.
Instituut voor Sterrenkunde, KU Leuven, Celestijnenlaan 200D, 3001 Leuven, Belgium; pnemeth1981@gmail.com
Astronomický ústav AV ČR, CZ-25165 Ondřejov, Czech Republic
1 Introduction
Hot subdwarfs are core He burning stars at the blue end of the horizontal branch (HB), also referred to as the extreme horizontal branch (EHB). These subluminous objects are located between the main-sequence (MS) and the white dwarf (WD) sequence in the Hertzsprung-Russell diagram. The origin of hot subdwarfs is not clear, but an effective mass-loss mechanism is certainly required to remove most of the envelope by the time of core He ignition and leave behind an about half a solar mass star with a very thin H envelope. There is a heavy traffic of evolved stars in the region of subdwarfs in the HRD and we see different populations of stars all at once. Some of these stars had different initial masses and this increases the confusion regarding their population memberships. Because of these problems and other limitations caused by the low-number statistics that we currently experience, we propose to initiate a large scale, statistically meaningful study of subdwarf stars (SD1000).
2 The pilot-study
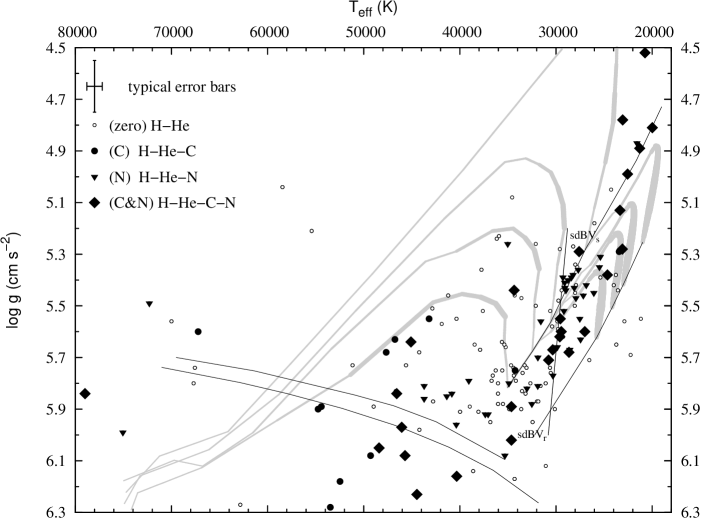

Vennes et al. (2011) initiated a programme to identify the white dwarf population in the GALEX all-sky survey based on ultraviolet and infrared color criteria. In their follow-up they collected and classified over 200 high signal-to-noise (SNR) low-resolution spectra of subluminous stars. The majority of these stars turned out to be bright hot subdwarfs. Later, Németh et al. (2012) developed a fitting procedure for Tlusty/Synspec (Hubeny & Lanz 1995; Lanz & Hubeny 2007) which included H/He/CNO opacities in the subdwarf models and spectral decomposition for the composite spectra binaries, and carried out an NLTE model atmosphere analysis for 166 hot subdwarfs based on the follow-up spectroscopy. The subsequent catalog is one of the largest homogeneously modeled sample to date. An intriguing result of this pilot-study was that the He abundance distribution of hot subdwarfs shows a complex structure. It appears to be rather clumped in contrast to the previously observed simple linear trends. More surprisingly sdB stars crowd in two groups that we define as: sdB1, near K, dex, ; and sdB2, near K, dex, . Even more surprising was that these groups correlate with pulsational properties and show a different CNO abundance pattern. It was found that sdB1 stars overlap with slow pulsators (sdBVs) and show N in their spectra. These stars are suspected close binaries from the common envelope formation channel and indeed, many short period binaries have been previously found in this group. To further investigate this correlation a binary analysis for the GALEX sample is under way. The sdB2 group overlaps with rapid pulsators (sdBVr), does not show CNO abundances and most of the composite spectra binaries were found among them. Such wide binaries may form through the Roche-lobe overflow channel. Hybrid, or mixed mode pulsators have been found mostly in between the sdB1 and sdB2 groups where we see stars with substantial C and N abundances, which might be a sign of diffusion or a different evolutionary channel. Geier et al. (2013) found eight sdB stars with a He isotope anomaly (4He is replaced by 3He) in this region which also suggests the importance of element diffusion. Another group can be defined for to the blue horizontal branch (BHB) stars at K, dex, , which also show C and N abundances. Similarly to sdB stars a complex structure was seen for He-sdO stars, for a reference please see the abundance distributions in the and diagrams in Figure 1 and Németh et al. (2012).
This pilot-study proved that our method works and by applying for more observations it can serve a better understanding of these subluminous stars.
3 Abundance analysis
Metal abundances play an important role in subdwarf spectroscopy. The He abundances typical for sdB stars affect the NLTE atmosphere structure, therefore the He abundance in sdB stars is a fundamental parameter and must be investigated along with the surface temperature and gravity (Heber 2009). To a lower extent CNO and Fe abundances are also important in deriving accurate temperatures and gravities. Metal abundances also provide information on the formation of the stars (Zhang & Jeffery 2012).
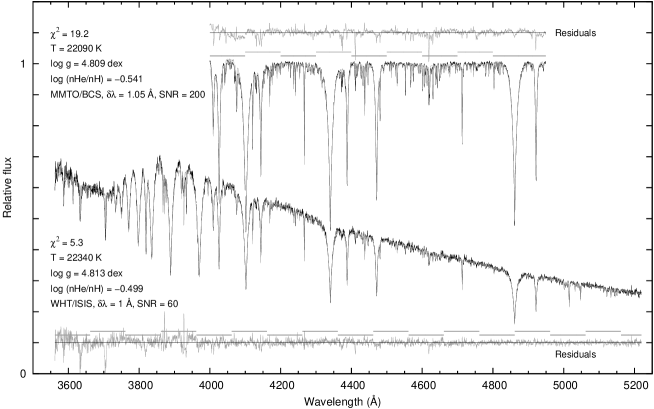
While the CNO analysis in the GALEX subdwarf survey lead to important conclusions, an extension to more elements, in particular including the iron group elements and metal line blanketing can open new horizons, but needs a more elaborated approach. Our new attempt uses atomic data for the first 30 elements in the spectral synthesis and 14 elements in the atmospheric structure calculations. With these many parameters the procedure is rather time consuming, but we could achieve a notable speed-up by changing the opacity sampling parameters and the number of atmospheric layers based on the goodness of fit. Figure 2 shows a sample fit for a star at the tip of the blue horizontal branch. The MMTO/BCS (MMT Observatory / Blue Channel Spectrograph) data was obtained and kindly provided to us by Betsy Green (see also these proceedings) and will be discussed in detail in a forthcoming paper along with the WHT/ISIS (William Herschel Telescope / Intermediate dispersion Spectrograph and Imaging System) observation of the same star.
Element diffusion is necessary to explain the pulsations of sdB stars and important in shaping the abundance profiles, hence diffusion calculations will certainly benefit from our homogeneous abundance determinations.
4 Stellar rotation
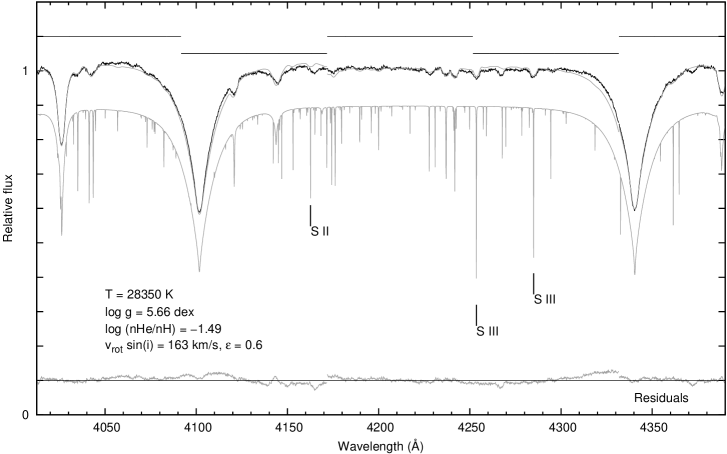
Generally, a high rotational velocity is not typical for sdB stars. However, the number of exceptions increases and suggests that the common envelope evolution may not only lead to short-period binaries (P d), but to pre-cataclysmic binaries with even shorter periods (P d). In such systems tidal synchronization can result in a high rotational velocity of the primary. These binaries are promising Type Ia supernova progenitors and important to understand. In the GALEX subdwarf survey Vennes et al. (2012) found that the radial velocity variation of CD-3011223 (GALEX J1411-3053) is in excess of 300 km/s between two consecutive spectra taken over 20 minutes and the star showed rotationally broadened lines. Prompted by the discovery of the shortest period binary ever known we implemented rotational broadening in our fitting procedure from Gray (2008) and derived a km/s, which is in good agreement with km/s independently found by Geier et al. (2013). Figure 3 shows our fit for the SOAR/Goodman (Southern Astrophysical Research Telescope / Goodman Spectrograph) spectrum.
5 Systematics
The sources of systematic biases are countless and even by only listing them one could fill a paper. Finding the most important sources of these shifts is essential when working with inhomogeneous data, therefore we will investigate such systematic effects from a broader perspective in the future. Here we are limited to mention only a few updates we already made.
As can be noted in Figure 2 our approach is to fit the entire spectrum and seek for a global fit instead of some selected regions of the data, because at a high resolution, high signal-to-noise and when metal line blanketing is included each data point carries extra information and contribute to the fit. Hence, by consistently fitting the whole spectrum we are able to track the interconnections between the H and the metal lines and reduce the Balmer line problem. We found that a proper flux calibration and a larger spectral range also help the consistency of the derived parameters.
The available atomic data we can work with is undoubtedly incomplete and suffer from inaccuracies. Line broadening data is often missing and not all lines can be taken with the same profiles. A good example for this problem is the dependence of the microturbulent velocity, which we consider an ad-hoc parameter, on the line formation depth or line strength. Another example is the instrumental broadening, which is usually taken with a Gaussian profile, but a Gaussian is not necessarily the best representation. Such broadenings affect the line profiles and the , but not the equivalent widths of the lines. This means that a minimum might fit the observation well, but still not represent the true surface parameters. We implemented a residual minimization in our procedure which can be used independently or in a combination with a standard method. This approach minimizes the residual flux and is not so sensitive to spikes in the residual, therefore some incorrect line profiles, like the He I lines ( and Å) in Figure 2 cannot divert the procedure so easily.
Hot subdwarfs cover a wide range of temperatures and abundances, therefore a grid calculated with a single set of atomic data may lead to an incorrect ionization balance, rising systematic differences near the grid boundaries. An effective method to avoid this is to calculate different grids for sdB, sdO and He-sdO stars, like in Vennes et al. (2011). Our original approach is a grid-less modeling, because calculating a well sampled grid with iron group elements would be an endless undertaking, but therefore the ionization equilibrium must be continuously monitored and the atomic data input regularly adjusted to the actual atmospheric conditions during fitting. Our experiences with this method are positive. The consistency of the derived parameters between low and high-resolution, high SNR spectra are better if the ionization balance is monitored. However, in some case a change in the level structure may lead to convergence problems.
Our latest update was to include the improved Stark broadening tables of H lines from Tremblay & Bergeron (2009) in the standard method.
6 SD1000 Collaboration
The Collaboration is dedicated to process all the available spectroscopic observations of hot subdwarfs to confirm the existing and set up new constraints for theoretical work. Here we focus on optical spectroscopy, but where possible we wish to complement the observations with ultraviolet data to derive more accurate metal abundances. As a result, we expect to better understand the contribution of the various formation channels, the conditions of the mass loss on the RGB and be able to sort out extremely low mass WDs and post-AGB stars that are observed in the subdwarf region. Therefore the main objectives of the project are:
-
•
Spectroscopy for the largest possible sample for a better statistics and distribution of hot subdwarfs.
-
•
Perform a homogeneous analysis to find subtle trends and correlation among surface parameters. Decrease instrumental biases.
-
•
Find connections to red giant stars and white dwarfs.
-
•
Provide accurate fundamental parameters for a statistically significant sample and with GAIA distances derive absolute luminosities and masses.
-
•
Find binary fractions and seek for connections between surface and binary parameters.
Currently we are working on some high-resolution, high signal-to-noise spectra of sdB stars. Interested observers can contribute to this target sample and get updates at the project’s web site:
http://stelweb.asu.cas.cz/~nemeth/work/sd1000/
7 Conclusions
To better understand the distribution of hot subdwarf stars in the Hertzsprung-Russell diagram we started a new collaborative programme (SD1000) and wish to process as many high-quality spectroscopic observations as possible. By evaluating our efforts made in the GALEX sample to derive accurate surface parameters we could improve our methods to derive more reliable effective temperatures, surface gravities, abundances up to Z=30 as well as stellar rotation in a manageable way for hundreds of stars.
A promising direction is to apply our techniques to large spectroscopic datasets like the Bok-Green survey (Green et al. 2008), SPY (Napiwotzki et al. 2001), MUCHFUSS (e.g: Geier et al. 2011; also these proceedings) and UVEX (e.g: Verbeek et al. 2012; also these proceedings) surveys as well as many individual, high quality observations. We also encourage others to perform such homogeneous analyses with independent methods for reference.
Beyond minimizing the systematic shifts in subdwarf spectroscopy, future development will include the analysis of stratified atmospheres to investigate element diffusion, which is a suspected mechanism behind the observed abundance patterns. In order to resolve more MS companions of sdB stars and derive the radial velocities of the components an important contribution would be to extend the MILES database (Cenarro et al. 2007) to the infrared and include the Ca II infrared triplet (, and Å). We will also consider synthetic spectra in this task.
Acknowledgments
We thank our colleagues at the Armagh Observatory (Northern Ireland); High Point University (NC, USA); Dr. Remeis-Sternwarte, Bamberg (Germany); European Southern Observatory, Garching (Germany) and at the University of Arizona (AZ, USA) for expressing their interest in the collaboration.
References
- Cenarro et al. (2007) Cenarro, A. J., Peletier, R. F., Sánchez-Blázquez, P., et al. 2007, MNRAS, 374, 664
- Geier et al. (2011) Geier, S., Hirsch, H., Tillich, A., et al. 2011, A&A, 530, A28
- Geier et al. (2013) Geier, S., Marsh, T. R., Wang, B., et al. 2013, A&A, 554, A54
- Geier et al. (2013) Geier, S., Heber, U., Edelmann, H., et al. 2013, arXiv:1307.5980
- Gray (2008) Gray, David F., 2008, The Observation and Analysis of Stellar Spectra, 3rd edition, Cambridge University Press, Cambridge
- Green et al. (2008) Green, E. M., Fontaine, G., Hyde, E. A., For, B.-Q., & Chayer, P. 2008, Hot Subdwarf Stars and Related Objects, ASP Conf. Ser., 392, 75
- Heber (2009) Heber, U. 2009, ARA&A, 47, 211
- Hubeny & Lanz (1995) Hubeny, I., & Lanz, T. 1995, ApJ, 439, 875
- Lanz & Hubeny (2007) Lanz, T., & Hubeny, I. 2007, ApJSS, 169, 83
- Napiwotzki et al. (2001) Napiwotzki, R., Edelmann, H., Heber, U., et al. 2001, A&A, 378, L17
- Németh et al. (2012) Németh, P., Kawka, A., & Vennes, S. 2012, MNRAS, 427, 2180
- Tremblay & Bergeron (2009) Tremblay, P.-E., & Bergeron, P. 2009, ApJ, 696, 1755
- Vennes et al. (2011) Vennes, S., Kawka, A., & Németh, P. 2011, MNRAS, 410, 2095
- Vennes et al. (2012) Vennes, S., Kawka, A., O’Toole, S. J., Németh, P., & Burton, D. 2012, ApJ, 759, L25
- Verbeek et al. (2012) Verbeek, K., Groot, P. J., Scaringi, S., et al. 2012, MNRAS, 426, 1235
- Zhang & Jeffery (2012) Zhang, X., & Jeffery, C. S. 2012, MNRAS, 419, 452