Synthetic spectra for O and B type subdwarf stars
Abstract
We present a grid of optical (3200–7200 Å) synthetic spectra calculated with Tlusty/Synspec. The new NLTE model atmospheres include the most recent hydrogen Stark broadening profiles; were calculated in opacity sampling and limited to pure H/He composition. The grid covers the observed parameter space of (He-)sdB and (He-)sdO stars, therefore it is suitable for the homogeneous spectral analyses of such evolved stars.
1 Instituut voor Sterrenkunde, KU Leuven, Celestijnenlaan 200D,
3001 Leuven, Belgium; pnemeth1981@gmail.com
2 Zentrum für Astronomie der Universität Heidelberg,
Landessternwarte, Königstuhl 12, 69117 Heidelberg, Germany
3 Steward Observatory, University of Arizona, 933 North Cherry Avenue,
85721 Tucson, AZ, USA
1 Introduction
Hot subdwarfs are important objects to understand the late stages of stellar evolution. These He burning stars connect the red giant branch to the white dwarf sequence and suffer a strong mass-loss before they settle on the extreme horizontal branch for about a 100 Myr. This way hot subdwarfs also give an insight into the horizontal branch morphology. The conditions and reasons of the extreme mass-loss are not easy to decipher, in particular for single stars. Current formation theories can explain the observed subdwarf populations, but extensive spectral libraries, that include all types of hot subdwarfs, would be welcome to separate the observed populations and find the relative contributions of the various formation channels.
Line blanketing and NLTE effects are strong and must be considered in subdwarf spectroscopy while the static plane-parallel atmosphere approximations are still valid. The NLTE model atmosphere code Tlusty is long used in subdwarf atmospheric analyses, libraries of synthetic spectra have been calculated and fitted successfully for numerous subdwarfs. However, recent improvements in the theoretical models and the lack of a homogeneous, publicly available reference library motivated us to calculate a new grid. Here we present a comprehensive spectral library, which is based on the observed distribution of hot subdwarf stars and suitable for their homogeneous analyses.
2 Model calculation
We used Tlusty 204 and Synspec 49 (Hubeny & Lanz 1995; Lanz & Hubeny 1995) in our work to calculate plane–parallel, horizontally homogeneous, static stellar atmospheres in radiative and hydrostatic equilibrium. Even though metal line blanketing is not present in H/He models we used opacity sampling for a better distribution of frequency points. The most detailed model atoms of H and He were included from the BSTAR database (Lanz & Hubeny 2007) giving altogether 61 explicit energy (super-)levels and 330 radiative transitions.
The grid was calculated in about 1400 CPU hours and consists of 11 396 grid points to which we were able to converge 10 887 spectra (95.5%) in the current version. The grid is complete between and (cgs), most of the slow converging models are either at low – high (the extremely low-mass white dwarf regime) or at high He abundance – high , where no stars were observed in a sample of 170 hot subdwarfs selected from the GALEX survey (Németh et al. 2012). However, that analysis was done with Tlusty as well, which raises the concern of non-detectability of such stars. The atmospheres with a high helium abundance and low effective temperature are convectively unstable and a He convection zone is difficult to model.
The radiation fields, and therefore the spectral energy distributions, were calculated at 16 000–18 000 frequency points in opacity sampling. We used 70 depth points to discretize the atmospheric structure between the Rosseland mean opacities and . The microturbulent velocity was held zero and all models were converged to a relative change of 0.1% of the structural parameters. Synthetic spectra were then calculated in the range of 3200–7200 Å with 0.1 Å step size, ensuring that both the continuum and the line profiles are sampled well. Because the abundances were limited to H/He our models do not address the Balmer line problem. Due to this shortcoming the derived atmospheric parameters are not expected to be consistent with the more accurate photometric or asteroseismic constraints.
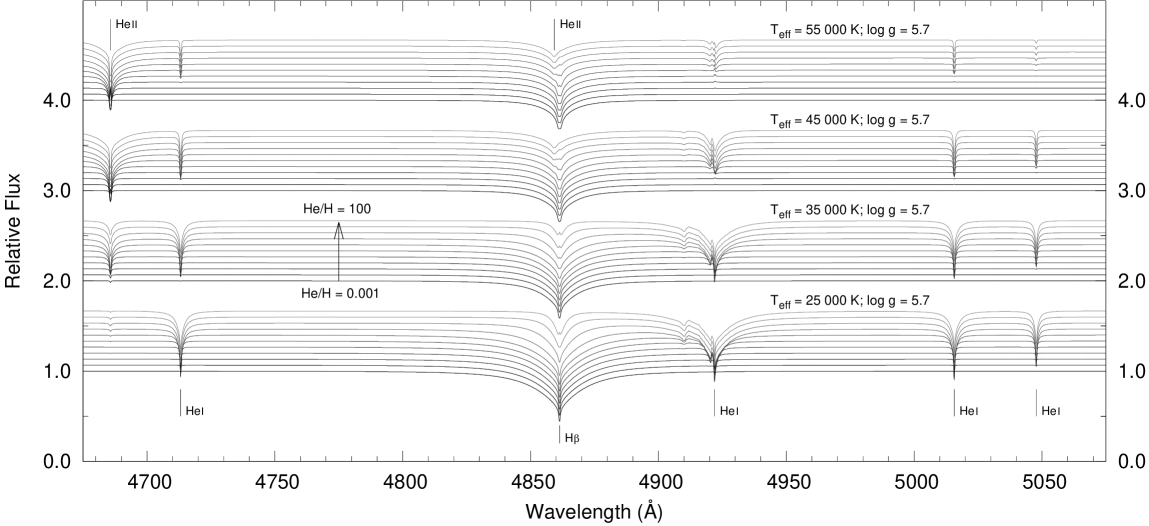
A sample of synthetic spectra near the H line are shown in Figure 1. Effective temperature increases from bottom to top in the figure as well as the He abundance in each sequence. The shift in ionization balance is marked by the gradual decrease of the He I/He II line strength ratio towards higher temperatures. Also remarkable is the weakening of the H line at higher temperatures and He abundances, while in the most extreme cases the He II Pickering series dominates the spectra.
3 Line profiles
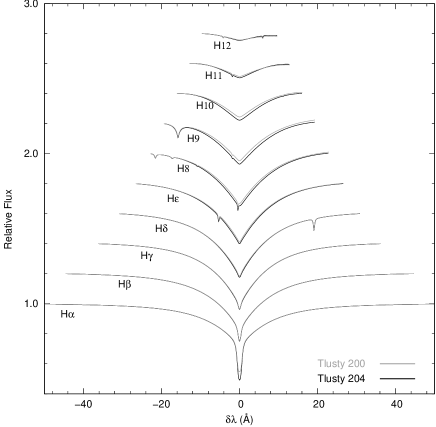
The new version of Tlusty makes it possible to include detailed H line profiles directly in the atmosphere structure calculations. We added the Stark broadening tables for the first ten lines of the Lyman and Balmer series of H from Tremblay & Bergeron (2009). A systematic line profile difference towards the high members of the Balmer series has been observed in white dwarfs and it is also notable for subdwarfs, in particular for the H – H lines in Figure 2. The differences in the line profiles are relatively small. However, because the surface gravity is constrained by the upper Balmer series, even such small differences can be responsible for about half of the discrepancy observed between spectroscopic and photometric surface gravities, also known as the problem (Rauch 2012). We expect that the new profiles will increase the internal consistency of temperature and gravity determinations from various Balmer lines. Surprisingly, we found a deeper H line core. Although the new line profiles modify the atmospheric structure and the level populations, this change was unexpected and needs further investigations.
Beyond the H line profiles our models include detailed profiles for the overlapping forbidden components of four He I lines (4026, 4388, 4471, and 4922 Å) as well as detailed profiles for the He II Balmer, Paschen and Pfund series. The structure of the 4922 He I line can be seen in Figure 1.
4 The library
| Parameter | Lower limit | Step size | Higher limit |
|---|---|---|---|
| (K) | |||
| (cgs) | |||
The parameters of our grid are listed in Table 1. The library consists of synthetic spectra and continuum flux in ascii format and can be downloaded from:
http://www.ster.kuleuven.be/~petern/work/sd_grid/
References
- Hubeny & Lanz (1995) Hubeny, I., & Lanz, T. 1995, ApJ, 439, 875
- Lanz & Hubeny (1995) Lanz, T., & Hubeny, I. 1995, ApJ, 439, 905
- Lanz & Hubeny (2007) Lanz, T., & Hubeny, I. 2007, ApJSS, 169, 83
- Németh et al. (2012) Németh, P., Kawka, A., & Vennes, S. 2012, MNRAS, 427, 2180
- Rauch (2012) Rauch, T. 2012, Fifth Meeting on Hot Subdwarf Stars and Related Objects, ASP Conf. Ser., 452, 111
- Tremblay & Bergeron (2009) Tremblay, P.-E., & Bergeron, P. 2009, ApJ, 696, 1755