A new population of recently quenched elliptical galaxies in the SDSS
Abstract
We use the Sloan Digital Sky Survey to investigate the properties of massive elliptical galaxies in the local Universe () that have unusually blue optical colors. Through careful inspection, we distinguish elliptical from non-elliptical morphologies among a large sample of similarly blue galaxies with high central light concentrations (). These blue ellipticals comprise 3.7 per cent of all galaxies with stellar masses between and . Using published fiber spectra diagnostics, we identify a unique subset of 172 non-star-forming ellipticals with distinctly blue colors and young ( Gyr) light-weighted stellar ages. These recently quenched ellipticals (RQEs) have a number density of and sufficient numbers above to account for more than half of the expected quiescent growth at late cosmic time assuming this phase lasts 0.5 Gyr. RQEs have properties that are consistent with a recent merger origin (i.e., they are strong ‘first-generation’ elliptical candidates), yet few involved a starburst strong enough to produce an EA signature. The preferred environment of RQEs (90 per cent reside at the centers of groups) agrees well with the ‘small group scale’ predicted for maximally efficient spiral merging on to their halo center and rules out satellite-specific quenching processes. The high incidence of Seyfert and LINER activity in RQEs and their plausible descendants may heat the atmospheres of small host halos sufficiently to maintain quenching.
keywords:
galaxies: elliptical and lenticular, cD — galaxies: evolution — galaxies: formation — galaxies: star formation1 Introduction
Documenting the assembly history of massive elliptical galaxies in detail remains an elusive problem. A central aspect of galaxy evolution over a significant portion of cosmic time has been the build up of quiescent (i.e., non-star-forming and red) galaxies (Bell et al., 2004; Brown et al., 2007; Faber et al., 2007; Brammer et al., 2011). The growth of the red galaxy population has occurred largely above the characteristic mass limit of that broadly divides galaxies into the blue-cloud of late-type (disk-dominated) systems and the red-sequence of early-type (elliptical, S0, and bulge-dominated spiral) galaxies, which have been well-documented at (Strateva et al., 2001; Blanton et al., 2003; Kauffmann et al., 2003; Baldry et al., 2004). With the advent of better and larger surveys of distant galaxies, the bimodality in color (Willmer et al., 2006; Brammer et al., 2009; Whitaker et al., 2011; Muzzin et al., 2013) and structure (i.e., the high early-type fraction on the red sequence – Bell et al., 2004, 2012; Wuyts et al., 2011; Cheung et al., 2012) is found at all redshifts out to . A general consensus has emerged in the literature to explain galaxy bimodality and its evolution, whereby the low to moderate-mass red sequence is fed by migrating blue-cloud galaxies that experience star formation (SF) quenching, and the assembly of the most massive galaxies occurs by dissipationless (so-called ‘dry’) merging of pre-existing red systems (see Fig. 10 in Faber et al., 2007, for an illustrative schematic diagram of the blue-to-red migration scenario). The evidence for the role of merging in the formation of galaxies is convincing (Bell et al., 2006; White et al., 2007; McIntosh et al., 2008; Skelton et al., 2009; van der Wel et al., 2009; Robaina et al., 2010). What remains difficult to constrain in this model are the variety of physical processes at play that are needed to both govern SF and alter structure to maintain the high fraction of red early-type galaxies and the bimodality in galaxy properties at masses below . Cosmological simulations (e.g., Oser et al., 2010) make it clear that galaxies experience multiple processes over their lifetimes. To gain further insights into galaxy evolution, the work to be done is to disentangle the complex interplay of processes and identify which dominate under different physical conditions, and as a function of cosmic time.
A host of physical processes are predicted to quench SF by either removing, heating, or cutting off the cold gas supply necessary to fuel new star production. Energy released from accretion on to the central massive black hole can produce dynamic-mode AGN feedback in the form of powerful gas outflows (Granato et al., 2004) typically associated with gas-rich mergers (Di Matteo et al., 2005; Springel et al., 2005; Hopkins et al., 2006), or ’radio-mode’ heating of the interstellar medium in galaxies (Sazonov et al., 2005; Hopkins & Elvis, 2010) or of the intracluster medium (ICM) in groups and clusters (Cattaneo et al., 2006; Croton et al., 2006; Sijacki & Springel, 2006). During starbursts, energetic feedback from supernovae and stellar mass loss can also provide thermal heating, strong winds and galactic outflows (Springel & Hernquist, 2003; Martin, 2005; Cox et al., 2006; Tremonti et al., 2007; Diamond-Stanic et al., 2012). Stellar or supernova (SN) feedback is argued to dominate in low-mass galaxies (e.g., Kaviraj et al., 2007), while AGN feedback is predicted to dominate at higher masses (Kaviraj et al., 2007; Di Matteo et al., 2008). Gas exhaustion and shock heating from major gas-rich mergers without AGN or SN feedback are predicted to at least temporarily quench SF (Hopkins et al., 2008), while other dynamical mechanisms may reduce the efficiency of SF including secular bar-driven quenching (e.g., Masters et al., 2011), and morphological quenching in which a large spheroidal bulge can stabilize the gas disk against fragmentation (Crocker et al., 2012; Martig et al., 2013). Additionally, the atmosphere of a galaxy’s dark matter halo can impede SF in a number of ways. Virial shock heating of the halo gas creates conditions for efficient shutdown of the hot halo gas by feedback mechanisms (e.g., Kereš et al., 2005; Dekel & Birnboim, 2006). Cosmological and hydrodynamical simulations show that modest-sized halos () can become dominated by hot gas (Birnboim & Dekel, 2003; Kereš et al., 2005). Once hot, radio-mode AGN heating (or gravitational heating for larger halos, Dekel & Birnboim, 2008) can maintain halo quenching of both central and satellite galaxies (Gabor & Davé, 2012). New cold-gas accretion on to the centers of small group or galaxy size hot halos would require additional energetic feedback to quench subsequent central SF (Kereš et al., 2012). Besides preventing gas cooling, the parent halo atmosphere can quench orbiting satellites by either tidally stripping their hot-halo gas resulting in a so-called ‘strangulation’ of future SF after the existing cold fuel is consumed (Larson et al., 1980; Balogh et al., 2000; Bekki et al., 2002; Kawata & Mulchaey, 2008), or rapid ( years) ram-pressure stripping of the cold gas reservoir producing a fast truncation of SF (Spitzer & Baade, 1951; Gunn & Gott, 1972; Abadi et al., 1999; Fujita & Nagashima, 1999; Quilis et al., 2000). Observational results support strangulation as the dominant quenching mechanism for the bulk of low-redshift satellite galaxies (van den Bosch et al., 2008) including those in the outskirts of galaxy clusters (Lewis et al., 2002).
As with quenching, many physical processes are cited to transform late-type disks into the variety of observed early-type galaxy (ETG) morphologies. Foremost, the hierarchical assembly of dark matter halos (White & Rees, 1978) drives galaxy merging and the formation of the spheroidal components of galaxies (Kauffmann et al., 1993; Baugh et al., 1996; Cole et al., 2000). Numerical simulations have long shown that the violent merging of comparable mass disk galaxies (major merging) disrupts the rotational stellar orbits and produces remnants with spheroidal light profiles thereby giving rise to the “merger hypothesis” for the formation of elliptical galaxies (Toomre & Toomre, 1972; Toomre, 1977). Soon thereafter, modellers realized the need for progenitor bulge components (Hernquist, 1993) and the dissipative effects of gas (Barnes, 1992; Hernquist et al., 1993) to produce remnants that were reasonable matches to ellipticals; i.e., pure spheroid galaxies. As merger simulations have become more sophisticated, the specific details of the progenitor mass ratios (Naab et al., 1999; Naab & Burkert, 2003; Cox et al., 2008), and gas fractions (Cox et al., 2006; Naab et al., 2006) are now understood to critically shape the kinematic and photometric structure of merger remnants, providing realistic merger scenarios for the formation of both elliptical galaxy families found in nature (Kormendy & Bender, 1996; Emsellem et al., 2007): low-mass disky fast rotators and high-mass boxy slow rotators. Additional simulations demonstrate that mergers can also be responsible for early-type spirals and S0’s under certain conditions; e.g., unequal-mass spiral-spiral major mergers (Bekki, 1998). If gas accretion continues after the spheroid formation a disk component may reform (Barnes, 2002; Steinmetz & Navarro, 2002; Abadi et al., 2003; Governato et al., 2007; Governato et al., 2009), or even survive a major merger (Springel & Hernquist, 2005; Robertson et al., 2006; Hopkins et al., 2009). Furthermore, simulations predict that minor merging can play an important role in spheroid and bulge growth (Bournaud et al., 2007; Naab et al., 2007), especially towards explaining the significant size evolution of massive ETGs (Naab et al., 2009; Hopkins et al., 2010; Oser et al., 2012). Besides merger-driven ETG formation, the morphology-density relation (Dressler, 1980; Postman & Geller, 1984; Dressler et al., 1997) has motivated environmental mechanisms for the transformation of disks into ETGs, especially S0 galaxies in clusters, such as stripping and gas consumption by SF (Larson et al., 1980; Bekki et al., 2002), harassment (Farouki & Shapiro, 1981; Moore et al., 1999), and ram-pressure stripping (Quilis et al., 2000), but others argue that the latter process is insufficient (e.g., Farouki & Shapiro, 1980; Boselli & Gavazzi, 2006). Another commonly invoked morphological transformation is ‘preprocessing’ by environmental processes in groups before entering dense clusters (Zabludoff & Mulchaey, 1998; Boselli & Gavazzi, 2006; Wilman et al., 2009; Bekki & Couch, 2011). Finally, the secular growth of ‘pseudobulges’ (Courteau et al., 1996; Norman et al., 1996; MacArthur et al., 2003; Kormendy & Kennicutt, 2004; Debattista et al., 2006) provides another channel for the morphological evolution of late-type disk galaxies.
The diversity of galaxy transformational processes that can play a role in blue-to-red migration is daunting. Attempts to disentangle the various quenching channels and ETG assembly modes in the present-day Universe (McIntosh et al., 2004; Schawinski et al., 2007; Kaviraj et al., 2009; Győry & Bell, 2010; Schawinski et al., 2010; Greene et al., 2012) demonstrate the challenge in trying to improve our understanding of the physics of red-sequence growth. For example, the so-called ‘green valley’ between the blue cloud and red sequence may include a significant fraction of quenched galaxies migrating redwards (Martin et al., 2007; Mendel et al., 2013). Yet, there is a rich variety of green-valley morphologies (Schawinski et al., 2010), which can be produced in a number of ways. Moreover, recent studies show that a significant portion of the local ETG population has low-level, residual SF (Kaviraj et al., 2007; Schawinski et al., 2007; Schawinski et al., 2009), which extends and complicates their redward migratory path. For these reasons, our approach herein is to focus narrowly on the elliptical (pure spheroid) subset of ETGs, and to isolate recently quenched examples; i.e., strong candidates for new, spiral-spiral merger-formed or ‘first-generation’ ellipticals. By attempting to catch new ellipticals transitioning to the red sequence, we can better constrain the role major merging plays in blue-to-red migration. Furthermore, by limiting our investigation to one morphological transformation channel (disk-disk major merging), we can study the associated quenching processes and test the modern merger hypothesis for the gas-rich111The ‘gas-rich’ distinction herein refers to dissipational or spiral-spiral merging, as opposed to gas-poor or dry. merger production of red ellipticals (Springel et al., 2005; Hopkins et al., 2006, 2008).
Trying to identify a connection between mergers and old red ellipticals has proven elusive since Toomre & Toomre (1972) first suggested the link. Identifying unambiguous first-generation ellipticals in the ‘gap’ between clearly merging systems and ancient ellipticals has considerable inherent scatter owing to the sensitivity of each remnant’s evolution to the properties of the initial interaction and post-merger SF (Győry & Bell, 2010). Important attempts to correlate tidally-induced substructure and asymmetry with colors and stellar populations have shown general agreement with the merger hypothesis (Schweizer & Seitzer, 1992; Tal et al., 2009; Győry & Bell, 2010). But others are finding that the bulk of morphologically-disturbed red ellipticals with low-level recent SF are either the product of major dry mergers or minor mergers (Kaviraj, 2010). Other studies have attempted to identify young elliptical galaxies; e.g., star-bursting ultraluminous infrared galaxies (ULIRGs Sanders et al., 1988; Genzel et al., 2001; Dasyra et al., 2006) and very recent post-merger remnants with strong morphological disturbances (Hibbard & van Gorkom, 1996; Rothberg & Joseph, 2004; Carpineti et al., 2012) are rare examples cited as ellipticals in formation. Additionally, post-starburst (EA or KA) galaxies with strong Balmer (A-star) absorption but no emission from ongoing SF (Quintero et al., 2004; Goto, 2005) are clear examples of a recently quenched population that is tied to galaxy merging because of the high incidence of morphological disturbance (Zabludoff et al., 1996; Blake et al., 2004; Yang et al., 2004; Bekki et al., 2005; Goto, 2005; Yang et al., 2008), but it is unclear whether this phenomenon accompanies all gas-rich mergers or only a special subset. Local Universe post-starburst galaxies are found preferentially at low masses ( Wong et al., 2012), and at a much lower frequency ( Goto, 2007a; Wong et al., 2012) compared to major spiral-spiral mergers ( Darg et al., 2010, ; McIntosh et al., in prep.). Under the assumption that all such galaxies were the result of a recent gaseous merger, this difference may be further exacerbated depending on whether the EA phase lasts Gyr (typical A-star lifetime) or Gyr (Snyder et al., 2011) compared to the visibility time-scales for first close passage and final coalescence in interactions and mergers, where the strong morphological asymmetries are identifiable ( Gyr, Lotz et al., 2008, 2010b, 2010a). Therefore, we use an alternative approach to identify plausible first-generation ellipticals under the assumption that young gas-rich merger remnants should experience a relatively brief blue phase whether the merger fueled a strong starburst or a modest SF enhancement. Then we adopt a method similar to Whitaker et al. (2012) to identify the recently quenched subset of blue ellipticals, which are spectroscopically quiescent and have unusually young luminosity-weighted stellar ages.
A final complication in identifying and tracking first-generation ellipticals migrating to the red sequence is the rejuvenation of previously passive ellipticals that experienced a temporary minor SF event (Thomas et al., 2010). In our standard hierarchical cosmological model, the stellar build up of galaxies over time is a complex process involving both the accretion of gas and the addition of already-formed stars through galaxy merging (e.g., Oser et al., 2010). When a quiescent ETG experiences a gas-rich minor merger, or otherwise accretes star-forming gas, a “frosting” of low-level SF (Trager et al., 2000) may add only to its mass, but have enough hot O and B stars to produce a brief global blue color owing to the extended nature of the SF. Evidence of young stars and low-level recent SF has been observed in low-redshift ETGs (Yi et al., 2005; Kaviraj et al., 2007; Schawinski et al., 2007), including those with disks (Shapiro et al., 2010; Fang et al., 2012; Salim et al., 2012) and pure elliptical subsets (Sánchez-Blázquez et al., 2009; Zhu et al., 2010). The accretion of small companions builds up the mass of existing red ellipticals and is thought to play a significant role in their rapid size evolution within (van der Wel et al., 2008; Bezanson et al., 2009). Many moderately blue (i.e., green-valley) ETGs, even those with asymmetric morphologies, may not be newly formed spheroidal galaxies. Moreover, high-resolution simulations show that the tidal debris seen around massive ellipticals can be produced by major and minor merging alike (Feldmann et al., 2008). In other words, the mass assembly of ellipticals is not simply a one-way channel from blue to red via gas-rich major merging. By focusing on recently quenched ellipticals (RQEs), we are constraining our study to merger-built galaxies migrating redwards. These are plausibly first-generation ellipticals, but they are also consistent with ‘second-generation’ examples; i.e., a past merger remnant that was recently rejuvenated and subsequently quenched. We caution that unambiguously distinguishing new ellipticals (with central concentrations of new stars) from frosted ellipticals (with extended young stellar populations) requires spatially resolved star formation histories (SFHs) from IFU spectroscopy and is beyond the scope of this study. A more detailed study of the SFHs of blue ellipticals will be presented in a subsequent paper (Haines et al., in prep.).
In this paper, we analyze a sample of 1500 visually selected elliptical (pure-spheroid) galaxies with unusually blue optical colors. These objects are drawn from a large and complete selection of massive (), centrally-concentrated galaxies with in the Sloan Digital Sky Survey (SDSS; York et al., 2000). In § 3, we study the structure, spectroscopic emission and rest-frame colors of unusually blue ellipticals. This analysis allows us to identify a robust subset of blue ellipticals that are non-star-forming. In § 4, we isolate and characterize a new population of recently quenched systems among the non-star-forming blue ellipticals, and we discuss their plausible quenching mechanisms. These objects represent an objectively selected and statistically useful sample of first-generation elliptical candidates for further study. Throughout this paper we calculate comoving distances in the cold dark matter (CDM) concordance cosmology with , , and assume a Hubble constant of km s-1 Mpc-1. All SDSS magnitudes are on the AB system such that , where for (Yang et al., 2007).
2 Selection of Blue Elliptical Galaxies
As motivated in the Introduction, the primary goal of this study is to identify and analyze high-mass elliptical (pure spheroid) galaxies at low redshift that are plausibly transitioning redwards. To isolate a statistical sample of such galaxies that is mass-limited, volume-limited and has high spectroscopic completeness we employ the SDSS Main Galaxy Sample (MGS, Strauss et al., 2002) and apply the following 3-step selection: (1) isolate a large sample of blue-cloud galaxies with redshifts and stellar masses bracketing the bimodal mass scale of , (2) apply an automated high-concentration cut to identify the bulge-dominated subset (herefter blue ETGs), and (3) visually distinguish elliptical galaxies from other more dominant morphologies found in the blue ETG population (e.g., spiral and disk galaxies with prominent bulges).
It is important to point out that employing a simple high-concentration cut to automatically extract ETGs from the high-mass blue cloud includes a large mix of non-elliptical morphologies. This fact motivates the additional visual selection criteria which provides a robust separation of elliptical galaxies from the larger population of blue ETGs. Our selection identifies the 1500 most optically blue ellipticals among a complete population of over 60,000 high-mass, low-redshift galaxies in the SDSS fourth data release (DR4, Adelman-McCarthy & et al., 2006). These objects make up only 2% of high-mass galaxies, but are potentially evolutionarily quite important as they are strong candidates for new merger-formed or ’first-generation’ ellipticals. Here, we discuss the details of our blue elliptical galaxy selection process.
2.1 Stellar Masses and Optical Colors
We use the New York University Value-Added Galaxy Catalog (NYU-VAGC, Blanton et al., 2005) reprocessing of the MGS for spectroscopic target selection, which is limited to all extended sources with magnitudes. We calculate stellar masses following Bell et al. (2003):
| (1) |
This relation adopts a Kroupa (2001) IMF. The color and absolute -band magnitude have been -corrected (Blanton & Roweis, 2007) and evolution-corrected for simple passive luminosity fading (Blanton et al., 2003) to redshift . The NYU-VAGC provides significantly improved photometry for all SDSS galaxies. We use SDSS Petrosian magnitudes and colors corrected for Galactic extinction (Schlegel et al., 1998). For galaxies with early-type morphologies, defined by an -band central-light concentration cut (using the radii containing 90% and 50% of the Petrosian flux, see; e.g., Strateva et al., 2001), we correct by mag for well-known missing flux (Blanton et al., 2003). The Bell et al. stellar masses have 20% random uncertainties and 0.10–0.15 dex systematic error from a combination of effects including dust, stellar population ages and bursts of star formation. Tests based on the same stellar mass estimates show that the SDSS is very complete out to for (van den Bosch et al., 2008, see Appendix A), and remains fairly complete to for . Selections of and yields 63,454 DR4 galaxies.
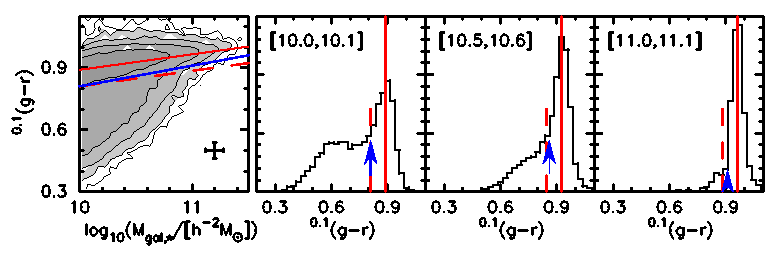
We employ an empirically defined color cut to distinguish blue-cloud and red-sequence galaxies. The left-most panel of Figure 1 shows the stellar mass and color space for the full sample of 63,454 high-mass, low-redshift galaxies. The colors are evolution corrected to to more closely match the median redshift of our selection (). The right panels show the distributions in color for three fixed mass slices of width . The well-known bimodality in galaxy colors (e.g., Baldry et al., 2004) remains apparent at , but disappears as the blue population drops off sharply at higher masses. The red sequence is clear at all masses and we use this feature to define blue/red cuts. The red-sequence centroid (solid red lines) is given by
| (2) |
with and slope . The dashed red lines (, ) show a common red/blue division defined by a blueward shift from the red sequence by some factor, in this case twice the typical color error (0.04 mag). In this paper, we adopt an empirically-derived blue/red cut (, , blue line and arrows) which is defined by the color at which the galaxy population deviates bluewards from the roughly log-normal color distribution for red galaxies. The empirical cut matches the common division at low mass but for more massive galaxies it includes a larger number of galaxies into the blue sample. Our empirical blue color selection includes 38.9% (24,659 galaxies) of the high-mass population at .
2.2 Morphologies
To isolate a robust sample of unusually blue ellipticals from the large sample of high-mass blue galaxies selected in § 2.1, we take a hybrid approach of pre-selecting all ETGs based on a popular and automatic high-concentration criterion, followed by visual classification to remove bulge-dominated disk galaxies (early-type spirals and S0’s) and other contaminants. This approach has been used successfully by others with similar data and objectives (e.g., Zhu et al., 2010). In what follows, we include a summary of the full richness of the visual morphology inventory of low-redshift, high-mass galaxies that are blue and centrally concentrated. Additionally, we describe tests demonstrating the robustness of our visual classifications.
2.2.1 Central Concentration
For ETG preselection, we apply the common SDSS -band concentration cut to automatically separate high-concentration (bulge-dominated) galaxies (e.g., see Strateva et al., 2001; Hogg et al., 2002; Bell et al., 2003; Kauffmann et al., 2003) from the bulk of the blue population which is disk-dominated with low central light concentrations (e.g., Blanton & Moustakas, 2009). We note that all galaxies are resolved well enough ( pixels) to apply this simple concentration criterion. We find that one-third of high-mass blue galaxies have . It is important to point out that naively applying a pure concentration cut to the full sample of high-mass blue galaxies results in an unrealistically large portion (13.3%) of crudely defined blue ETGs. From the analysis of Blanton & Moustakas, we expect that a large portion of these blue ETGs correspond to luminous early-type spirals (Hubble type Sa) and non-red-sequence S0 galaxies in contrast to the dominant E/S0 morphologies found typically among high-mass red ETGs. We confirm the expected high content of bulge-dominated spirals and disks among automatically selected blue ETGs using visual inspection in § 2.2.3.
2.2.2 Visual Classification Scheme
We use visual inspection to extract the subset of blue ellipticals (i.e., remove bulge-dominated disk galaxies) from the full set of 8421 high-mass blue ETGs selected in § 2.2.1. Visual inspection has the added benefit of identifying asymmetric or peculiar elliptical galaxies and highly-disturbed, recent spheroidal post-merger candidates. In particular, merger simulations predict short-lived tidal features (e.g., tails, loops, shells, plumes) associated with young spheroidal remnants. Despite its subjective nature, visual classification maintains an advantage over automated classification schemes (e.g., Conselice, 2003; Lotz et al., 2008) in the ability to distinguish especially lower-surface brightness peculiarities and asymmetries associated with recent merging activity from the rich variety of structures found in normal spiral galaxies. Our classification scheme consists of the following morphological types:
-
•
S Spirals exhibit one or more clear disk resonance feature (e.g., spiral arms, stellar bar, or inner ring), or are highly flattened with a central dustlane.
-
•
iD Inclined disks are elongated galaxies with disk-like outer isophotes but unclear spiral signatures.
-
•
E Elliptical or spheroidal galaxies with bright centers and smooth light profiles showing little or no asymmetric features.
-
•
pE Peculiar elliptical galaxies with one or more of the following morphological disturbances consistent with recent tidal activity: excess outer light, asymmetric outer isophotes, shells, asymmetric dustlane, blue core, or clearly dust-reddened core.
-
•
SPM Highly-disturbed, spheroidal post-merger galaxies with strong global asymmetries suggesting a recent merger origin.
-
•
U Galaxies with uncertain morphologies: these objects often appear round or elliptical with subtle (unclear) structural features suggestive of face-on spirals or spheroids, but too faint to detect clearly.
2.2.3 Inventory of Blue-cloud High-concentration Types
Each galaxy was independently inspected by the lead author plus three students (AMC, TH, & JM) and assigned one of the types from our classification scheme. The classifications were based on inspection of -combined color postage stamps with fixed sensitivity scaling available from the SDSS Image List Tool222 http://cas.sdss.org/astro/en/tools/chart/list.asp.. We note that the use of fixed scale image cutouts for visual classification of bright galaxies is the standard employed in the largest efforts at both low and high redshift (e.g., Lintott et al., 2011; Kartaltepe et al., 2014). We removed 356 galaxies that have evidence of an ongoing tidal interaction with a close companion. These galaxies could be a recent merger remnant but are undergoing another interaction making interpretation of recent past activity difficult. Finally, we identified and omitted a small fraction (1.9%) of galaxies with questionable morphologies and/or colors owing to severe scattered light contamination from nearby bright stars, and we excluded 12 (0.1%) objects that are image artifacts (e.g., satellite trails, stellar diffraction spikes). After these exclusions, our final sample contains 7890 high-mass blue ETGs with careful visual classifications.
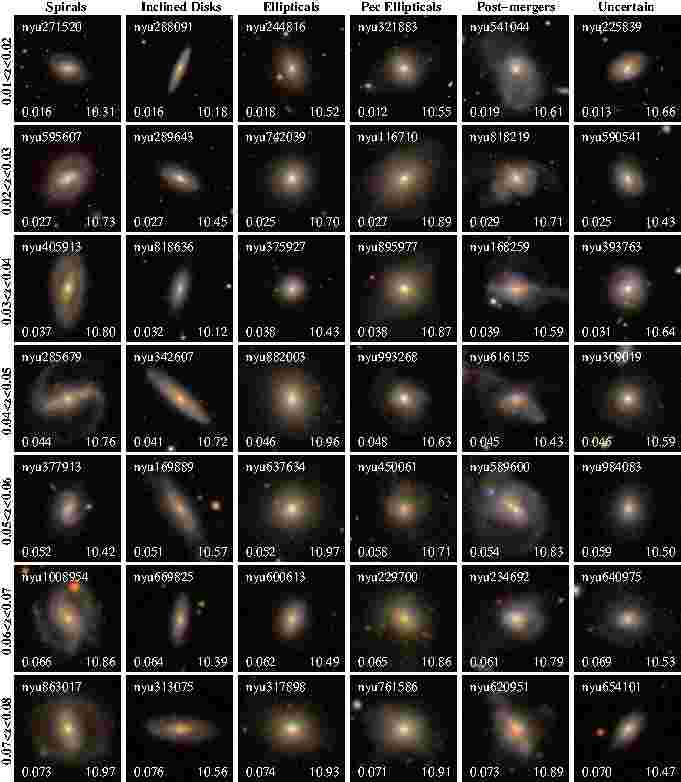
We define high (classifier-to-classifier) agreement to be a minimum of three out of four classifiers in agreement. We find this level of agreement for 86.7% of the high-mass blue ETG sample. We tabulate the visual classification summary in Table 1. Our classification scheme divides the blue ETG sample into three basic subsets: (i) galaxies with clear spiral/disk morphologies (S, iD types) which, by definition, cannot be remnants of recent disk-destroying major mergers333High-mass, low-redshift disk galaxies have relatively low gas fractions, as such we do not expect disk regrowth following a major merger as seen for extreme gas fractions (e.g., Springel & Hernquist, 2005).; (ii) plausible merger remnants (E, pE and SPM types) spanning a range of post-merger characteristics; and (iii) galaxies that lack definitive morphological structure or features in imaging at the depth of the SDSS (U type). In Figure 2, we show illustrative examples of our classification types from eight redshift bins spanning . Clearly, high-mass blue ETGs in the local cosmological volume have a wide range of morphologies; We reiterate that a crude concentration cut is poor for selecting a pure elliptical galaxy sample from the blue cloud; i.e., more than 40% of blue galaxies have clear spiral and/or disk (including S0) features (see Table 1). This is an important result of this classification analysis. In the next section, we outline a number of tests we perform to establish the validity of our visual selection of smooth, pure-spheroid elliptical galaxies which are the primary subject of this paper.
It is worth noting that the visually-identified SPM, pE and E subsets of the high-mass, blue ETGs represent three morphological bins that could plausibly span a qualitative time sequence since merging. At one extreme we find galaxies that appear to be dynamically relaxed ellipticals with little/no evidence of recent tidal activity, contrasted by those at the other extreme that appear to be freshly coalesced with very disturbed morphologies. The visual appearance of the blue SPM, pE and E types (see Fig. 2) qualitatively matches the evolution of tidal features in merger simulations. In concert with the expected blue-to-red migration, simulated merger remnants evolve morphologically as the post-merger tidal features (e.g., tails, loops, shells, plumes) quickly fade around the dynamically relaxing young spheroidal galaxy during the first billion years after coalescence (e.g., Barnes, 1992; Barnes & Hernquist, 1996). As such, we expect distinct stages of evolution between a major spiral-spiral interaction and a red elliptical including (i) a highly-disturbed, dynamically-young remnant, (ii) a spheroid-dominated core with tidal features, and (iii) a bluer-than-normal elliptical. In this scenario, the low number of clear SPMs (110) and pEs (124), compared to 1368 featureless blue Es, is consistent with the rapid disappearance of strong tidal features in the first few after coalescence as the remnant relaxes. SPMs are perhaps the cleanest examples of very young new spheroidal galaxies and, as such, are an interesting population in their own right with regard to the merger hypothesis. A detailed analysis of their properties is the subject of a forthcoming paper. Additionally, we have completed a study of the radial SFHs of a small representative sample of these blue E, pE and SPMs (Haines et al., in prep.).
2.2.4 Classification Process and Tests
To achieve meaningful results based on visual identification of galaxy subsets requires that we understand the robustness of our eyeball classifications to meet two important goals: (1) distinguish ellipticals from spirals; and (2) identify evidence of recent tidal activity. Besides the inherent subjectivity of human classifiers, changes in image resolution and sensitivity between galaxies of different brightnesses over a range of distances will impact the quality of visual classifications. To address these issues, we perform a number of tests to check the validity of our classifications. Additionally, we establish in § 3.1 that our sample of visually identified blue ellipticals are well matched to red ETGs (typically E/S0) in terms of quantitative structural parameters.
The most critical test of our classifications is possible by examining data from the SDSS Stripe82. As described in Data Release 7 (Abazajian et al., 2009), this deg2 region extending from along the celestial equator in the Southern Galactic Cap was imaged 20–40 times. Thus, Stripe82 provides imaging for of our blue ETG selection that is mag deeper than the standard SDSS images. We find no significant changes in our visual morphologies based on examination of the Stripe82 subset. In particular, 95% (69/73) of high-agreement elliptical classifications remain E or pE types based on Stripe82 data. Three-quarters of the remainder may be S0 galaxies while only one showed a clear disk component. Most importantly, all RQEs (see § 4) with Stripe82 data are confirmed morphologically by the deeper imaging.
Additionally, we test how our elliptical classifications depend on apparent brightness and angular size. First, we find that the fraction of high-agreement EpE types among high-mass blue ETGs remains fairly constant in three magnitude bins: 24% ( mag), 20% ( mag) and 19% ( mag). The slight decrease with increasing magnitude is the result of greater numbers of uncertain (U-type) morphologies at lower stellar masses and higher redshifts as discussed in the next paragraph. Secondly, we find that the level of elliptical E or pE agreement between classifiers remains unchanged for angular half-light sizes , and arcseconds.
Additionally, we thoroughly test our classifications dependence on redshift and galaxy mass and find the following: (i) no decrease in the level of classifier agreement for identifying S/iD types over all and ; (ii) 80% of iD classifications have an axial ratio of ; (iii) agreement on E classifications is independent of but depends on such that lower-mass galaxies have lower agreement, which is expected given the fact that lower-mass ellipticals tend to be more disky (e.g., Kormendy & Bender, 1996) and may be classified as iD instead; and (iv) the majority of blue ETGs have a clear (non-U) classification except those with and , of which one-third are high-agreement U types.
While the number of pE and SPM types is too small to quantify conclusive trends, we note that we detect SPMs at all and (98% below ), and we find pEs at all redshifts but 95% have with no obvious bias among the few lower-mass identifications. We estimate our ability to identify morphological disturbances by looking at our spiral feature detection. We expect that if resolved well enough, a given sample of spiral disk galaxies with a typical distribution of axial ratios from edge-on to face-on will have a majority with clearly identifiable spiral features – our S definition. At fixed angular resolution, the physical resolution decreases from either smaller physical size (lower-mass disks have smaller average size; e.g., Shen et al., 2003), or smaller apparent size from increased distance. Therefore, we expect the visibility of spiral structure to be more sensitive to resolution changes than the overall disky isophotes of inclined disks – our iD type. We test which galaxies with high S/iD agreement are dominated by S and by iD classifications and we find that iD dominate over S identifications only for galaxies with and , which is quite similar to the parameter space where U types increase.
We conclude that our pE and SPM identifications are robust for at all redshifts, and down to for , but we cannot ascertain whether the lack of disturbed ellipticals below is real or the result of resolution bias. Additionally, our visual classifications distinguish pure-spheroid ellipticals from early-type spirals and bulge-dominated disks with high classifier-to-classifier agreement over most masses and redshifts.
2.3 Refined Sample for Analysis
For the remainder of this study we will focus on the 1492 unusually blue ellipticals with high visual classification agreement as our final sample for analysis. This sample includes 1368 (normal, E type) and 124 (peculiar, pE type) elliptical galaxies. We opt to exclude SPMs from our analysis, which are not ellipticals (yet). At , these blue ellipticals make up only 3.7% of all high-concentration galaxies with stellar masses between and . This percentage is consistent with the findings of Kannappan et al. (2009) based on several samples of very low-redshift galaxies. Additionally, blue ellipticals make up a tiny fraction of the 25,000 most-massive blue galaxies in this SDSS DR4 volume – most of which have low concentrations () consistent with disk-dominated systems.
The blue elliptical sample provides the best candidates to test the modern major merger hypothesis for the formation of new elliptical galaxies. We expect that such galaxies include older (pre-existing) ellipticals that are modestly blue as the result of non-major-merger assembly processes. For example, the peculiar ellipticals exhibit a host of tidal features including loops, tails and distorted dust features that can arise from either major or minor mergers between existing ellipticals and cold-gas disks (Feldmann et al., 2008). In what follows, we use a suite of SDSS-derived quantities to confirm the spheroid nature of these visually identified ellipticals and to divide them into subpopulations of interest for closer scrutiny.
| Classification | ||
|---|---|---|
| Elliptical (E) | 1368 | 1030 |
| Peculiar elliptical (pE) | 124 | 52 |
| Spheroidal post-merger (SPM) | 110 | 43 |
| Spiral/inclined disk (S/iD)a | 2834 | 2236 |
| Uncertain (U) | 2408 | 1267 |
| Total (of 7890) | 6844 | 4628 |
Total number of high-concentration (), blue-cloud galaxies that are classified as the same type by at least three classifiers and by all four classifiers .
a Agreement is defined as any combination of S and iD classifications.
3 Properties of Visually-Selected Blue Elliptical Galaxies
In §2, we visually identified a stellar mass-limited sample of blue elliptical galaxies with normal (E) and peculiar (pE) morphologies. In this section, we compare the structure of these galaxies against control samples of automatically-selected red-sequence ETGs and blue-cloud late-type galaxies (LTGs). Next, we divide the blue ellipticals (EpE types) into different emission types using several spectroscopic diagnostics. Lastly, we explore the color versus velocity dispersion distributions of our sample split by emission type and compare these to the underlying galaxy population.
3.1 Structure
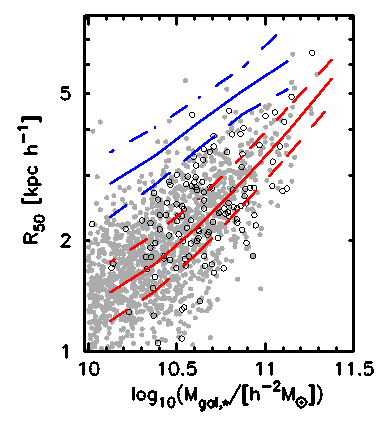
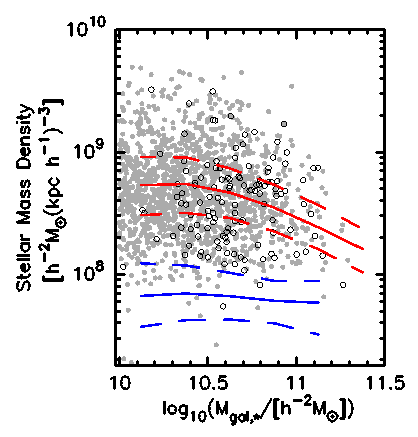
To establish the fidelity of our visual selection of blue ellipticals, we compare their structure against that from two control samples in Figure 3. In the left panel, we plot the stellar masses and half-light sizes of blue elliptical galaxies, and show the median, 25%-tile and 75%-tile empirical mass-size relations for 32,349 red ETGs () and 16,241 blue disk-dominated LTGs (). The sizes are based on the radius (petroR50_r) of the circular aperture containing 50% of the -band Petrosian flux (Strauss et al., 2002). The unique mass-size relations for disk and spheroid-dominated galaxies are well known (e.g., Shen et al., 2003). At a given stellar mass, the blue ellipticals have size distributions that nearly match that of red ETGs and are quite different from the typical sizes of blue LTGs. Put another way, the mass-size relations of blue Es and pEs are clearly inconsistent with the relation for disk-dominated galaxies from the blue cloud. Likewise, as shown in the center panel, our galaxies are clearly more dense than blue disks and have similar densities as red ETGs.
While the mass-size and mass-density relations of blue ellipticals are similar to spheroid-dominated galaxies on the red sequence, there are a few minor differences in Figure 3 worth noting. First, blue Es are offset to slightly larger sizes than red ETGs and, on average, blue pEs are somewhat less compact and dense than their normal counterparts. Slightly larger sizes could be the result of new stars added preferentially at larger radii. Moreover, the pE subset have minor tidal features which likely result in additional outer light and larger values. We note that very few pEs are identified below , but whether this is real or a selection effect remains inconclusive (see § 2.2.4; we discuss this point in more detail in § 3.3). Secondly, blue ellipticals tend to have moderate stellar masses with very few found above ; i.e., any that are recent end products of major gas-rich merging will become only moderate-mass red ellipticals. This is consistent with the idea that dry merging, whether minor or major, dominates the mass assembly of the largest ellipticals.
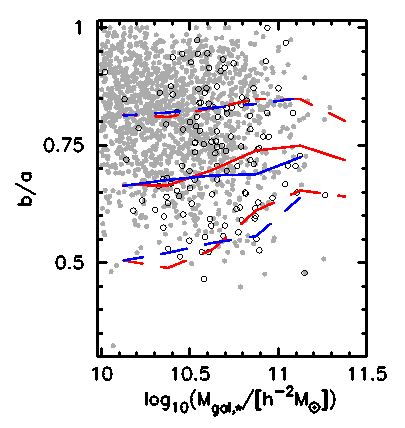
We plot the axial ratios as a function of stellar mass for our sample in the right panel of Figure 3. The axial ratios are based on the isophotal semi-major and semi-minor axes (isoA_r, isoB_r) measured from the -band images. The two control samples both span roughly the same range at a given stellar mass, with a more pronounced trend toward round (high ) red ETGs above as found in a similar analysis on massive quiescent galaxies by van der Wel et al. (2009). The blue LTG values are counter-intuitive on first inspection because one expects a random distribution of pure disks to extend to lower values from edge-on and highly-inclined systems. But, highly-inclined disk galaxies tend to have higher concentrations and redder colors (Maller et al., 2009), which are both excluded by our blue LTG selection. Thus, the blue LTG control sample is skewed toward rounder, less-inclined and face-on, galaxies.
The main result from the axial ratio distribution is that visually-selected blue ellipticals are much rounder on average than red ETGs over the full range of masses we study. This is not surprising given the fact that the red ETG sample contains S0 and early-type spiral galaxies as well as ellipticals. As such, blue ellipticals make up only a fraction of red ETG progenitors (e.g., they will not evolve into red S0’s). More than half have which is roughly the upper quartile for red ETGs. The small subset of blue pEs have more elongated axial ratios than blue Es of similar stellar mass. We interpret the difference between blue E and pE axial ratio distributions to be the impact of asymmetric and irregular tidal features on the measurement. The axial ratios of our visually-selected ellipticals (EpE) demonstrate the fidelity of our visual classifications to exclude S0’s. For comparison, 95% of our blue ellipticals have , a cut that Zhu et al. (2010) employed to select a high-fidelity sample of low-redshift elliptical galaxies from the SDSS. van der Wel et al. (2009) point out that the only mechanism to produce very round spheroidal galaxies is major merging. In what follows, we will examine these galaxies more closely to attempt to shed light on whether they are newly-formed, first-generation ellipticals or previously-formed spheroids with a population of young stars.
3.2 Spectroscopic Types
The SDSS fiber spectroscopy provides a number of useful diagnostics for understanding the physical nature of blue ellipticals. The diameter fibers correspond to a at the redshifts of our sample and encompasses roughly 15–50% of the stellar mass of each galaxy. We make use of the MPA-JHU emission-line analysis of the SDSS DR7 spectra (for details, see Kauffmann et al., 2003; Brinchmann et al., 2004) which provides stellar continuum-subtracted [based on an updated version of the Bruzual & Charlot (2003) stellar population synthesis model] line flux and error measurements. We combine a number of methods to analyze the full spectroscopic sample of blue ellipticals (EpE types) in terms of SF, black hole growth, and lack of emission. We employ the standard Baldwin et al. (1981, hereafter BPT) diagnostic for optical emission-line galaxies. In addition, we identify spectroscopically quiescent galaxies following Peek & Graves (2010), and we use the ratio of [OII] to H emission following Yan et al. (2006) to identify the galaxies that are neither quiescent nor have lines with sufficient S/N for the BPT diagnostic. Finally, we discuss the low incidence of EA galaxies identified by Goto (2007a).
To compare the incidence of blue ellipticals with different emission properties to control samples selected from the underlying galaxy population, we analyze all DR4 galaxies meeting our stellar mass () and redshift () cuts that have good spectroscopic measurements; i.e., we remove low-S/N () spectra and a handful of objects with bad flux measurements from pipe-line processing errors (e.g., discontinuities in the spectral coverage) or stellar continuum fit errors. This results in a spectroscopic sample of 58,455 galaxies with 92.1% completeness, including 1267 (119) blue Es (pEs). The small incompleteness is expected to be random given the SDSS spectroscopic tiling (Blanton et al., 2003).
3.2.1 Blue Ellipticals in the BPT Diagram
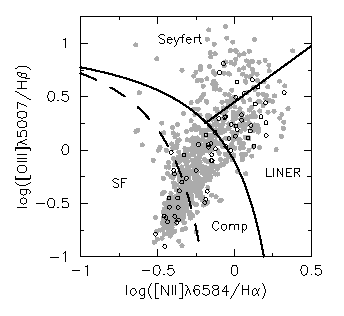
In Figure 4, we show the BPT diagram of [OIII]/H versus [NII]/H line flux ratios for the subset of our galaxies with detectable nebular emission (line flux S/N) in all four lines. Following standard practices, we use this diagnostic to classify galaxies into several emission types. Galaxies with pure HII emission from SF (hereafter, SF type) lie below and to the left-hand side of the dashed line defined empirically by Kauffmann et al. (2003) to remove contamination from galaxies with composite emission (Comp type) from both SF and an AGN. Kewley et al. (2001) derived a theoretical maximum starburst line (solid curve) to classify galaxies dominated by AGN emission which lie above and to the right-hand side of this line. Comp types lie between the dashed and solid lines. Finally, we divide the Kewley et al. AGNs into Seyferts and LINERs following Schawinski et al. (2007). Recent work demonstrates that LINER emission is typically spatially extended in present-day galaxies (Annibali et al., 2010; Kehrig et al., 2012; Yan & Blanton, 2012), which calls into question an AGN as the primary ionizing source (although some LINERs are clearly ionized by a central source, Pogge et al., 2000), rather ionization from hot post-AGB stars or white dwarfs is predicted (e.g., Stasińska et al., 2008). Therefore, the distinction between Seyferts and LINERs is important when considering if any blue ellipticals are being quenched by an AGN. The interpretation of Comp types as SF-AGN composites is likewise controversial. For example, these galaxies may be neither star-forming nor an AGN, rather their emission may be dominated by the same non-nuclear ionization sources as many LINERs.
We compare the emission type demographics of visually-selected blue Es and pEs against several control samples in Table 2. With regard to the four BPT emission types (SF, Comp, Seyfert, LINER), we find that the blue E and pE populations have comparable relative type fractions, and we find that our sample has distinct emission type percentiles from all three control samples: red ETGs, blue LTGs and blue ETGs with visual disk features (i.e., bulge-dominated spirals and S0 galaxies). Our sample has a three to six times higher fraction of pure starformers than do red ETGs, but a two to three times lower fraction compared to blue galaxies with disks. Blue ellipticals have an incidence of Seyferts which is on par with that of bulge-dominated blue disks and twice that of either red ETGs or blue LTGs. It is interesting to note that the presence of a substantial bulge in galaxies with cold gas (i.e., from the blue cloud) is linked to a higher incidence of AGN activity as we expect from the well-known correlation between black hole mass and bulge mass (Ferrarese & Merritt, 2000; Gebhardt et al., 2000). In terms of LINER emission, blue ellipticals have a similar makeup as both red and blue bulge-dominated populations. Finally, there is little difference between the Comp fraction of blue ellipticals and the control samples, except for the bulge-dominated blue disk galaxies which have nearly twice as many Comps as their disk-dominated counterparts. Such a difference between late and early-type blue disk galaxies would be expected if Comp emission included an AGN component. Perhaps, galaxies with Comp emission are a mixed bag such that some are traditional SF-AGN composites (Kauffmann et al., 2003), while others may be ‘retired’ (i.e., non-star-forming Stasińska et al., 2008) with non-circumnuclear warm ionized gas (Yan & Blanton, 2012). Given the ambiguous nature of Comp types, we hereafter exclude these from AGN subsets. We consider only galaxies with Seyfert emission as definite AGNs, which provides a lower limit of 5–10% for the incidence of blue ellipticals with an AGN, and we include LINERs for an upper limit to AGN fractions with the understanding of their controversial nature. Overall, blue ellipticals are 50% more likely to have strong BPT emission (i.e., sufficient S/N in all four lines) than red ETGs. Clearly, our selection has identified the most active population of elliptical galaxies. Finally, an important caveat is that we use only optical emission lines to determine the presence of an AGN. Studies have shown that optical selection alone may miss an important fraction of AGNs detected at other wavelengths (e.g., radio or X-ray), and that no single method will produce a sample that is both complete and reliable (Barmby et al., 2006). We are undertaking a multiwavelength study of blue ellipticals that is beyond the scope of this work.
3.2.2 Spectroscopically Quiescent Blue Ellipticals
To identify which of the remaining blue ellipticals with good spectroscopic data have no detectable emission (i.e., quiescent), and distinguish these from non-quiescent galaxies with emission too weak to be diagnosed with the BPT diagram, we follow the method of Peek & Graves (2010). Briefly, we calculate H and [OII] equivalent widths (EWs) and their formal errors from the MPA-JHU line fluxes and uncertainties. Peek & Graves found an ellipse, centered on ([OII] EW, H EW) with semiaxes of in [OII] and in H, encloses most quiescent galaxies with a minimum contamination from low-level star-formers and LINERs. Moreover, they required that the formal errors of the [OII] and H line strengths of each quiescent galaxy be included within the same ellipse. Additionally, we include galaxies in our quiescent selection that have no detectable H line (flux S/N), or detectable but weak (H EW ) H emission. These cuts ensure that we analyze the small subset of low-redshift galaxies with good spectra but lacking the [OII] doublet owing to the effective coverage of the SDSS spectrographs. We tabulate the incidence of quiescent galaxies among blue ellipticals and several control samples in Table 2.
We find similar incidences () of blue E and pE galaxies are spectroscopically quiescent. This fraction is significantly less than for red ETGs and an order of magnitude higher than the quiescent portion of blue LTGs. The inactive fraction of blue ellipticals is also much higher than that for blue ETGs with disk features. These galaxies have sufficiently high-S/N spectra ( have median ) to verify that the quiescent fraction clearly lacks emission from SF or an AGN. The lack of activity coupled with unusually blue colors is suggestive of a recently quenched population of elliptical galaxies. As outlined in the Introduction, such galaxies are consistent with the predictions of gas-rich major merging and may represent strong candidates for first-generation ellipticals. We focus on the nature of this interesting subpopulation in § 4.
3.2.3 Blue Ellipticals with Weak H and/or [OII] Emission
About 5% of galaxies with good spectroscopic data meet neither the BPT diagnosis criteria nor the quiescent selection; i.e., they have either weak emission lines or strong emission in only a few lines like H and [OII]. We split these objects into two ‘weak-emission’ types following Yan et al. (2006). First, ‘LINER-like’ (hereafter, weak-LINER) systems have H line flux S/N, [OII] EW S/N, and high [OII]/H EW ratios such that [OII] EW EW). Secondly, weak-SF types have low [OII]/H ratios ([OII] EW EW)), or no detectable [OII] (EW S/N) and H EW. The latter H EW criterion empirically matches the H EWs of the low-[OII]/H sample. The number of weak-SF galaxies in our sample is statistically zero and we exclude them from further analysis. In what follows, we find that weak-LINER and ‘normal’ (BPT) LINER galaxies behave the same in parameter spaces that we explore. We test and find that including/excluding weak-LINERs does not change our results. For completeness, we elect to combine all LINERs into one subset, but we show their separate contributions in Table 2.
| Sample | SFa | Compa | Seyferta | LINERa | weak-LINb | Quiesc | |
|---|---|---|---|---|---|---|---|
| Blue E | 1267 | 17 | 22 | 8 | 12 | 5 | 36 |
| Blue pE | 119 | 13 | 15 | 5 | 19 | 3 | 43 |
| Red ETG | 29554 | 3 | 14 | 3 | 16 | 4 | 57 |
| Blue LTG | 15343 | 51 | 21 | 3 | 7 | 1 | 3 |
| Blue ETG disk | 2684 | 31 | 38 | 7 | 14 | 2 | 6 |
Percentiles of emission types for our selection of blue ellipticals and three control samples from galaxies with good spectroscopic data. We provide errorbars for the blue elliptical subpopulations; for reference, the counts among all emission types for the control samples are such that errorbars are . We note that summing the emission percentiles for each sample will not add precisely to 100% owing to the omission of weak-SF types (see § 3.2.3). For example, 13% of blue LTGs are this type, but for all other types the percentage is .
a Based on the BPT diagnostic diagram (Fig. 4) and classifications following Kewley et al. (2001), Kauffmann et al. (2003) and Schawinski et al. (2007); § 3.2.1.
b Based on the weak-emission diagnostic of Yan et al. (2006); § 3.2.3.
c Based on the spectroscopically-quiescent definition of Peek & Graves (2010); § 3.2.2.
3.2.4 How Many Blue Ellipticals are EA Galaxies?
A number of studies have linked post-starburst galaxies with major gas-rich mergers and the formation of new ellipticals (e.g., Yang et al., 2006; Goto, 2007b; Snyder et al., 2011, and references therein). Therefore, any blue ellipticals that are the recent end product of a starburst-producing merger should exhibit post-starburst or so-called EA signatures. EA (or KA) galaxies have spectra that are a combination of an ETG (K-type) stellar continuum and strong Balmer absorption from a significant population of A-type stars that were formed in a brief burst. We identify 35 EA galaxies from SDSS DR5 (Goto, 2007a) within our stellar mass-limited sample of 58,455 galaxies with and spectroscopic data. This subset represents only 6% of the full Goto catalog, the bulk of which have higher redshifts and/or lower masses. We find that the tiny fraction of high-mass, low-redshift EA galaxies mostly have blue-cloud colors and high concentrations; i.e., 27 meet our blue ETG selection. These break down into 22 with high classifier agreement (8 E, 3 pE, 1 SPM, 8 U, and 2 iD) plus five with lower classification agreement, yet combinations of plausible post-merger and U classifications. The low fraction with clear morphological peculiarities (4 of 22) emphasizes that the dynamical and stellar population ‘clocks’ of merger remnants are different (Győry & Bell, 2010). Given the typical time-scale for post-merger disturbances ( Gyr, Lotz et al., 2008, 2010b, 2010a), the low disturbed fraction calls into question predictions of similarly short EA phase lifetimes (Snyder et al., 2011). In summary, very few high-mass blue ellipticals at low redshift () have experienced a recent starburst444We find similarly small EA fractions among high-mass blue SPMs and blue ETGs with uncertain morphologies.. If starbursts are ubiquitous with gas-rich major merging, then this result suggests that only a tiny fraction of blue ETGs with plausible post-merger morphologies (from normal E to SPM) are actually post-mergers. Yet, as discussed in the Introduction, the frequency of gas-rich interactions with is much higher than that of similarly massive post-starburst galaxies. Therefore, it is probable that a larger fraction of blue ellipticals are recent major-merger remnants, but only a subset of such mergers produce strong starbursts (Robaina et al., 2009). In § 4.3, we discuss the EA incidence among RQEs and the implications for the starburst phase in gas-rich merging at late cosmic times.
3.3 Color-Sigma
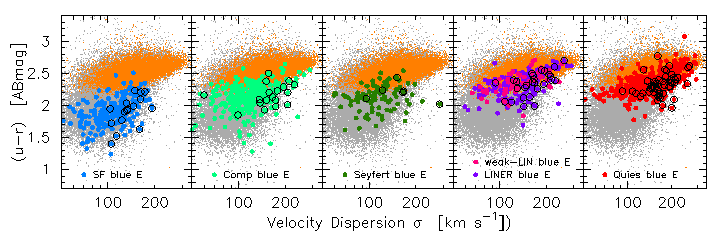
We compare the color versus velocity dispersion distributions of blue elliptical galaxies split into five emission types (SF, Comp, Seyfert, LINER and quiescent) in Figure 5. For each galaxy with good spectroscopic data (see § 3.2), we plot the color corrected to rest-frame as a function of (a proxy for dynamical mass) measured from the SDSS fiber spectrum. These choices provide a greater dynamic range for exploring the color and mass distribution of our sample. In each panel, we provide the underlying sample of all spectroscopic galaxies and we highlight a control sample of 16,976 spectroscopically-quiescent, red ETGs which represent the red-sequence in the color versus stellar mass space that we use to define our blue elliptical color selection (Fig. 1).
A number of interesting trends are immediately clear in Figure 5. Foremost, we find that our sample of visually-selected ellipticals with unusually blue optical colors follows a similar sequence in color, mass and emission activity as Schawinski et al. (2007, hereafter, S07) found for a broad selection of ETGs; i.e., visually classified E/S0 galaxies with no cuts in mass nor color. In accord with their results, we find that star-forming blue ellipticals populate the lower-mass blue cloud, while those with composite and Seyfert emission tend to focus in the so-called green valley, and LINER and quiescent systems favor higher masses and redder colors. A detailed comparison with S07 (their Fig. 7) reveals a number of minor differences that are explained by differences in sample selection. First, our stellar mass cut results in fewer SF types at km s-1 compared to the SF types in S07 which make up more than half of the low- ETGs. Even still, the subpopulation of blue ellipticals with active SF have the lowest average velocity dispersion among all other emission types in our stellar mass-limited sample. More importantly, our blue color cut preferentially excludes the redder half of the red sequence. This is seen clearly in the two right-most panels of Figure 5, in which the LINER and quiescent subsamples of blue ellipticals populate only the bluer portion of the quiescent red sequence (in orange). It is important to note that our results are fully consistent with those of S07, who found that LINER and quiescent ETGs populate nearly identical regions of color-sigma space, which is a close match to our red sequence defined by the control sample of spectroscopically-quiescent red ETGs. By selecting ellipticals with unusually blue colors, we are merely focusing on the bluest examples of LINER and quiescent types. This selection effect also holds true for the Comp and Seyfert blue ellipticals which S07 showed have green-valley average colors, but also extend well into the red sequence.
A striking feature of Figure 5 is the concentrated location of blue pEs in each panel. Visually-selected blue ellipticals with evidence of recent tidal activity appear to prefer the high-velocity dispersion and bluer edge of the color-sigma distribution for all emission types except Seyferts. For Comp, LINER and quiescent emission types, the blue pE concentration aligns with the green valley and provides evidence in favor of these galaxies being in active transition between the blue cloud and the red sequence. Likewise, both blue elliptical subpopulations (E and pE) with Seyfert emission prefer this transition region. It is tantalizing to speculate that gas-rich merging, whether minor or major, is playing an important role in defining the massive edge of the blue cloud. A popular hypothesis for defining the mass limit of blue-cloud galaxies is that star-forming galaxies may grow in mass until some mechanism quenches them and sends them to the red sequence (e.g., Bell et al., 2004; Faber et al., 2007). This critical mass appears to correspond to km s-1. The color-sigma distribution of quiescent blue pEs is particularly compelling in light of such evolutionary scenarios. These galaxies concentrate within a tight locus with green-valley colors and velocity dispersion just below and up to the critical mass limit. Indeed, nearly all quiescent blue ellipticals with km s-1 have normal morphologies and red-sequence colors, while most with km s-1 likewise lack morphological peculiarities but tend toward bluer colors. We note that this result is tentative given the uncertainty in our ability to detect asymmetric features in low-mass galaxies () at all redshifts that we study (see § 2.2.4).
Further dissecting our sample of blue ellipticals in terms of spectroscopic emission reveals a number subpopulations experiencing either different mass assembly processes or different phases of a similar process. For example, the low- blue ellipticals with active SF may be examples of rejuvenated ETGs identified by Thomas et al. (2010). Or these galaxies may be the recent end product of a major merger-triggered SF event such as a pre-existing elliptical accreting a large gaseous companion or a spiral-spiral merger. The latter case would represent an important population of pre-quenched first-generation ellipticals, and their moderately-relaxed (pE) to fully-relaxed (E) appearance would imply an extended period of merger-induced SF that lasts significantly longer than the strong morphological asymmetries identifiable for Gyr in new remnants (Lotz et al., 2008, 2010b, 2010a). We note that these star-forming ellipticals are likely a subset of the blue ETGs (E/S0’s) studied in Schawinski et al. (2009). Additionally, the blue ellipticals with Comp emission have colors and emission that are commonly identified with a transitory nature between star-forming and AGN, and also a quenching population that is migrating redwards (e.g., Schawinski et al., 2007). Yet, the properties of these ellipticals are also consistent with red-to-blue (or red-to-green valley) evolution from a minor frosting of new stars. Needless to say, these two subpopulations require closer scrutiny and will be the subject of forthcoming papers. For the remainder of this paper, we will focus on isolating the best examples of recently quenched (non-star-forming) ellipticals and exploring their nature.
4 Recently Quenched Ellipticals
Among the emission types of blue ellipticals identified in the previous section, the Seyfert and quiescent (non-emission) subpopulations are particularly noteworthy in the context of the gas-rich merging scenario. The green-valley colors of the Seyferts suggest they have either low-level, on-going SF or recently quenched SF. In what follows, we use the optical color-color plane to further constrain the non-star-forming population and identify the subset that have likely been quenched by the AGN. Moreover, the quiescent blue ellipticals may have experienced a recent episode of SF that has been subsequently quenched, or it is possible that these galaxies are merely old red ellipticals scattered from the red sequence into our blue color selection. As such, we use stellar ages to identify a new population of very young but non-star-forming – recently quenched – elliptical galaxies and distinguish these from systems with old stars. We then define our sample of RQEs, characterize their nature, and discuss possible quenching mechanisms.
4.1 Identification
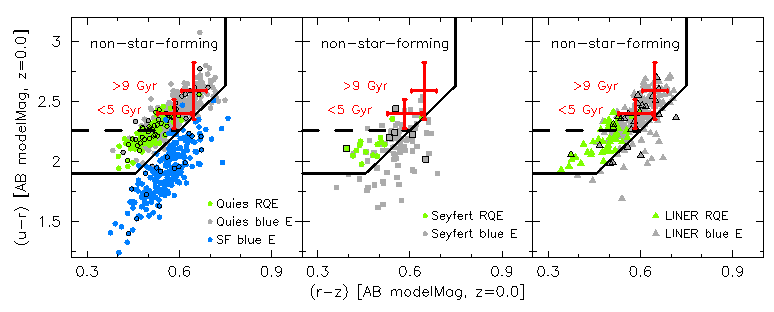
To confirm the non-star-forming nature of blue ellipticals with no emission and to identify which Seyfert systems lack SF, we analyze their location in versus space. Holden et al. (2012, hereafter H12) demonstrated that SDSS photometry robustly separates passive-red, non-star-forming galaxies from dust-reddened star-formers in the spirit of similar work using optical plus near-IR data (; e.g., Labbé et al., 2005; Wuyts et al., 2007; Williams et al., 2009; Brammer et al., 2011; Patel et al., 2012). Using a sample of SDSS galaxies with very similar selection to ours, H12 found an optimum boundary defined by , , and , that contains the highest fraction (0.82) of galaxies without detectable H emission (their quiescent, early-type galaxies) and with the lowest contamination (18%) of H emitters (their star-forming, late-type galaxies). We follow the prescription of H12 and use SDSS model magnitudes (modelMag) corrected for Galactic extinction and evolution corrected to . In Figure 6, we show how well the H12 boundary distinguishes two control samples selected from our emission-type definitions: (i) quiescent red ETGs, and (ii) blue LTGs with pure SF emission. Compared to what H12 reported based on their simple H-based definitions, we find even better separations such that 91.6% (94.1%) of all quiescent systems (red ETG subset) are contained within the H12 non-star-forming region, while 97.0% (99.0%) of all pure starformers (blue LTG subset) fall outside this boundary. We find similar results using colors based on the SDSS fiber magnitudes; we opt to use total integrated colors as H12 did so that we can be fairly confident that non-star-forming galaxies lack SF in their outskirts.
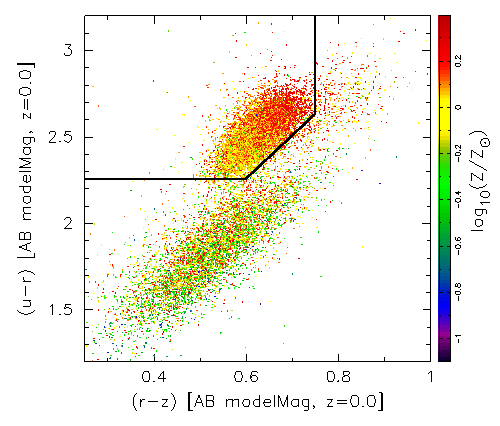
Additionally in Figure 6, we explore the – dependencies on light-weighted stellar ages and stellar metallicities from Gallazzi et al. (2005). The ages and metallicities represent the median-likelihood estimates computed from stellar population model fits to the SDSS fiber spectroscopy for galaxies with high-quality (median S/N/pixel) spectra. The Gallazzi et al. age and metallicity estimates are constrained to within dex for most galaxies. Galaxies cannot be parametrized by a single age, rather light-weighted ages are a composite of multiple ages and are very sensitive to SF within the last Gyr (Serra & Trager, 2007), which makes these ages useful indicators of recent SF and the presence of younger stars. For the full spectroscopic sample we analyze, 92.8% have good age and metallicity estimates – this completeness holds for blue ellipticals and all comparison samples. We find that galaxy colors in the non-star-forming region correlate with both stellar age and metallicity in the sense that redder (in both and colors) quiescent red ETGs are older and more metal-rich. Star-forming blue LTGs also follow a scattered age–) color relationship such that the bluest galaxies have the youngest ages, but these galaxies span the full range in metallicities with no clear trends with color. Color trends with age and metallicity for ETGs (Gallazzi et al., 2006) and with age for all galaxies (Chilingarian & Zolotukhin, 2012) are well documented.
With the -age-metallicity trends for quiescent555Hereafter, quiescent refers to spectroscopically devoid of emission lines (see § 3.2.2), while non-SF refers to non-star-forming colors in space. and pure star-forming control samples in mind, we plot the color-color space of the quiescent and pure star-forming subpopulations of blue ellipticals in the left panel of Figure 7. In striking contrast to quiescent red ETGs which are very well bounded by the H12 non-SF region, one-quarter of the quiescent blue elliptical subpopulation extends bluewards of the boundary. These quiescent objects are remarkably young with an average stellar age of 3.3 Gyr. While the H12 non-SF region does not capture the youngest portion of quiescent blue ellipticals, it does robustly distinguish the star-forming subset; we find 97.4% of blue ellipticals with SF emission outside of the H12 region. Moreover, bluewards of the H12 line, the quiescent and SF subsamples remain distinct. Therefore, we define a modified non-SF region that extends the H12 diagonal boundary down to a bluer cut that fully encompasses our sample of quiescent blue ellipticals. We note that the extended portion of our modified non-SF region has a very low (1.8%) contamination from star-forming blue ellipticals. The galaxies within our modified non-SF region span a large range in from 1–10 Gyr. For comparison, we show the mean and standard deviation of the colors for quiescent red ETGs with Gyr and Gyr. We highlight the disproportionate number of quiescent pEs with young, non-SF colors which suggests a link between tidal activity and recent quenching of SF.
Given the unique colors of the young quiescent subset of blue ellipticals, we turn our attention to the Seyfert subpopulation to see if there are any equally young, non-star-forming AGNs. Under the assumption that the nebular emission of an AGN is distinct from the stellar continuum that produces the global colors in the host galaxy, we investigate the colors of the Seyfert subpopulation of our sample in the middle panel of Figure 7. A majority of these galaxies fall within our modified non-SF boundary, and most have young stellar ages (average Gyr) and correspondingly bluer colors in the same manner as the young quiescent examples. This result shows that some blue ellipticals with Seyfert emission have had SF recently quenched, possibly by the active AGN. We likewise investigate the colors of blue ellipticals with LINER emission in the right panel of Figure 7). We combine the subpopulations of strong (BPT) and weak (Yan et al., 2006) LINERs and find that nearly 90% lie within our modified non-SF region. Moreover, nearly 1/4 of the non-star-forming LINERs populate the very-blue space and have even younger average ages (2.7 Gyr) than the quiescent subpopulation below this color cut. It is possible that some LINERs, whether their ionization source is actually a low-powered AGN or an extended source of hot post-AGB stars, play a role in quenching SF in elliptical galaxies. Therefore, we include young, non-SF LINERs in our analysis of RQEs and we explore the frequency of possible AGN quenching in more detail in § 4.3.2. Finally, we check the colors and ages of Comp emission types and find that a majority (61%) have star-forming colors. The subset that lie within our modified non-SF region tend to have colors that straddle the diagonal non-SF/SF boundary. As such, these objects appear to be transitory in terms of their colors as well as their optical emission lines. While 20% of the Comps have very-blue colors, their average age is 4.0 Gyr, which is much older than the other emission-line systems with similar colors. For these reasons, and the controversial nature of whether Comps are star-forming or not (see § 3.2.1), we opt to exclude them from a recently quenched selection. We confirm that their inclusion would not change our results significantly.
4.1.1 RQE Definition
The elliptical galaxies with unusually blue but non-star-forming colors, very young light-weighted stellar ages, and no detectable emission are clearly examples of ETGs that were forming stars, experienced a recent quenching of SF, and are now transitioning to the red sequence. Additionally, similarly young and non-star-forming blue ellipticals with Seyfert or LINER emission have all the hallmarks of recent SF quenching, possibly as a result of the AGN or LINER emission. Therefore, we select RQEs among blue ellipticals using the following simple criteria: (i) colors within our modified non-SF region, (ii) stellar ages of Gyr, and (iii) either spectroscopically quiescent or with Seyfert or LINER emission. The RQEs so defined are shown in green in Figure 7. We choose this age cut because of quiescent red ETGs are this young, compared to 24% of quiescent blue ellipticals. We note that the youngest red ETGs are 0.14 mag redder in and 0.06 mag redder in than the RQEs. This suggests that equally young red ETGs and RQEs have different stellar populations. For example, very young red ETGs, in a light-weighted sense, may be examples of ETGs with low-level recent SF identified by Kaviraj et al. (2007) and others using GALEX plus optical data. These galaxies experienced a sprinkling of 1–3% new stars by mass very recently (), while the RQEs we identify may have a larger fraction of blue stars a bit older than 1 Gyr. The low incidence of EA galaxies (see Table 4) limits the mass fraction of new stars added in RQEs. The bottom line is that there are virtually zero red-sequence ETGs with the ages and colors of the RQEs; the RQEs are a unique subpopulation of ETGs. Moreover, while similarly young and blue subpopulations of blue ETGs with disks and blue LTGs exist, they comprise a small fraction (2.5% and 1.1%, respectfully) of their kind. We stress that RQEs are not the result of aperture bias; i.e., they have the same redshift distribution as the full stellar mass-limited sample from SDSS DR4. A total of 172 blue E and pE visual types meet our RQE definition. We present a sample of the RQE catalog in Table 3; the full catalog is available electronically.
4.1.2 Testing A Pure Color-Color Selection of Recently Quenched ETGs
A number of recent studies have used the rest-frame versus color-color diagram to identify high-redshift () quiescent (i.e., non-star-forming) galaxies to study their cosmic evolution (Williams et al., 2009; Wuyts et al., 2009; Bell et al., 2012). Whitaker et al. (2012) have taken this approach one step further by separating massive quiescent galaxies at into young (recently quenched) and old to compare their size and number density evolution. These authors selected galaxies from the NEWFIRM Medium-Band Survey, identified the 15% bluest quiescent systems using a rest-frame color cut in the plane, and found that their average age based on their composite rest-frame spectral energy distribution is roughly one-half that of the older quiescent galaxies. This work demonstrates the utility of the correlation between unusually blue non-SF colors and unusually young stellar ages discussed in the previous section for selecting recently quenched ETGs from large galaxy samples lacking spectroscopic data. A key question remains as to what mechanism(s) is(are) shutting off SF in these systems. Applying a similar technique to isolate the youngest quenched systems could prove powerful for constraining quenching processes in ETGs with new samples that have sufficient numbers of massive galaxies with good rest-frame data.
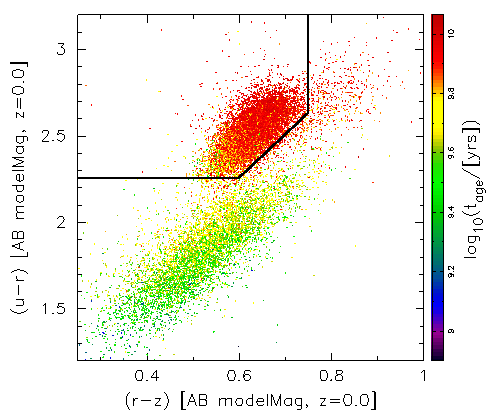
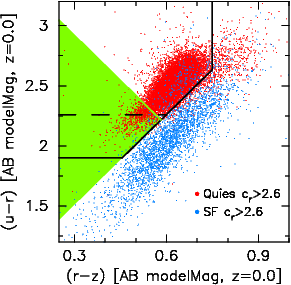
Here, we provide a valuable consistency check to the work of Whitaker et al. (2012) by testing a similar pure, color-color selection of the youngest, non-star-forming ETGs using 35,115 high-mass () SDSS galaxies with automated ETG morphologies (), spectroscopic emission types (§ 3.2), and good light-weighted stellar age estimates from Gallazzi et al. (2005). These data allows us to quantify the ages and emission activity of galaxies meeting the simple selection criteria illustrated in Figure 8. We exploit the fact that the (H12) and (Williams et al., 2009) identifications of non-star-forming galaxies each consist of a polygon with a diagonal boundary that both divides and runs parallel to the two (SF and non-SF) sequences. Therefore, we extend the diagonal boundary of the non-SF region bluewards indefinitely such that all galaxies above this line and to the left of are considered non-star-forming. This region contains 25,900 high-mass ETGs with very low (1%) contamination from galaxies with pure SF emission. The analogous criterion using rest-frame colors would be above the diagonal boundary and to the left of . Next, we use a line perpendicular to the SF/non-SF diagonal to isolate the 5% bluest non-SF ETGs; here, the line is . The criteria in space would be a likewise perpendicular line to the corresponding SF/non-SF diagonal positioned to select a given percentages of the bluest non-SF galaxies. Since the non-SF colors correlate with light-weighted stellar age (Fig. 6), the perpendicular line is roughly a straight age cut. This cut could be modified to select a larger or smaller percentage of the non-SF population. The important thing is that this empirical selection identifies the youngest non-SF population; i.e., the green triangular region shown in Figure 8 selects the most recently quenched ETGs.
The average light-weighted stellar age of galaxies meeting this pure color-color selection is 4 Gyr, with one-third having Gyr and only one-quarter with ages older than 5 Gyr. Put another way, the bluest 5% of non-SF ETGs at low redshift have an average age that is about one-half that of the older non-SF population. This selection identifies 62% of all non-SF galaxies younger than 3 Gyr and 82% of the RQEs we selected in the previous section. We note that more than half of the galaxies selected in this manner have no detectable emission lines, while another one-third are split evenly between galaxies with LINER and composite emission. Seyferts make up 7.6%, with 40% of these having Gyr. In short, using a pure optical-near-infrared color selection of recently quenched ETGs based on the SDSS, for which we can fully exploit spectroscopic estimates of age, we confirm the technique of Whitaker et al. (2012).
| NYU ID | R.A. | Dec | Type | Emission | ||
|---|---|---|---|---|---|---|
| (1) | (2) | (3) | (4) | (5) | (6) | (7) |
| nyu246089 | 7.15144084 | 9.93114501 | 0.050301 | 10.088 | E | LINER |
| nyu27832 | 7.60293981 | 0.15565728 | 0.060158 | 10.048 | E | LINER |
| nyu271516 | 9.76905203 | 9.31515332 | 0.065592 | 10.019 | E | Quies |
| nyu106052 | 11.82478667 | 15.54226519 | 0.07973 | 10.236 | E | Seyfert |
| nyu107049 | 12.01295453 | 16.01610727 | 0.050202 | 10.604 | E | Quies |
| nyu99345 | 13.31444145 | 14.8610745 | 0.06056 | 10.107 | E | LINERa |
Col. (1): galaxy identification number (from the DR4 NYU-VAGC, Blanton et al., 2005). Cols. (2)–(3): Epoch J2000.0 celestial coordinates in degrees from the SDSS. Col. (4): SDSS spectroscopic redshift from the NYU-VAGC. Col. (5): Stellar mass estimates in units of based on SDSS Petrosian photometry and Bell et al. (2003) M/L ratios. Col. (6): Visual classification type (see § 2.2.2 for details). Col. (7): Optical emission type (see § 3.2 for details). Table 3 is published in its entirety in the electronic edition of the journal. A portion is shown here for guidance regarding its form and content.
a LINER based on the Yan et al. (2006) criteria.
4.2 Nature of RQEs
Here we characterize this unique population of low-redshift, high-mass RQEs. These galaxies have either no emission lines or are Seyfert/LINER types and meet the simple color and age criteria given in § 4.1.1. These objects make up only 0.32% of the full DR4 sample with and stellar masses between and . The number density of RQEs is , which represents a lower limit owing to the fact that we have limited our analysis to blue ellipticals with high classification agreement. We find an upper limit of for blue ETGs without clear disk features by including galaxies with uncertain classifications that may be elliptical in morphology; i.e., high-agreement U types and E/U types (with two E and two U classifications). A detailed study of the nature of all SDSS galaxies meeting our recently quenched definition is beyond the scope of this work, but we note that Mendel et al. (2013) identified a larger sample of recently quenched galaxies in the SDSS and found a distinct lack of disk-dominated systems. These authors quote a higher number density of , which mainly reflects their lower mass selection criteria of . It is interesting to compare the number density of RQEs to the simple evolution model for massive () young quiescent galaxies from Whitaker et al. (2012). These authors used the observed population of old quiescent galaxies and modelled the build up of massive red-sequence galaxies under the assumption that all such galaxies passed through a brief young phase that lasted 0.5 Gyr. Their prediction for is , compared to our lower (upper) limit of for RQEs using the same stellar mass cut. Therefore, we identify the bulk (56–70%) of the recently quenched galaxy population necessary to account for the predicted red-sequence growth at late cosmic time.
In Table 4, we compare RQEs against two samples of non-star-forming ETGs: (1) older blue, visually-selected Es and pEs from this work that meet our modified non-SF criteria and have stellar ages Gyr; and (2) red ETGs that meet our modified non-SF color criteria and have reliable age estimates. Note, for both comparison samples we do not exclude any emission types; i.e., these are simply color-selected and have good ages. Using the half-light size and velocity dispersion, we estimate the dynamical mass . To explore the host environments of galaxies, we use the SDSS DR4 galaxy group catalog. Details of the catalog’s construction, completeness and reliability are found in Yang et al. (2007). Briefly, the group catalog provides a number of physically motivated measures of environment for all bright ( mag) galaxies in the NYU-VAGC with redshifts . Here, we make use of (i) a distinction between the highest stellar mass galaxy (centralCEN) and less-massive group members (satellitesSATs); and (ii) an estimate of the dark matter halo mass of the host group, which is determined by ranking groups in terms of characteristic stellar mass and applying halo occupation statistics in the assumed CDM cosmology. Using luminosity, rather than stellar mass, to identify CENs and estimate halo masses does not affect our results. Owing to the magnitude limit of the galaxies used to construct the catalog, groups with are detected with high completeness down to .
We find a number of interesting differences between RQEs and the populations of non-SF red ETGs and non-SF, older blue ellipticals. While the three ETG populations in Table 4 have similar stellar mass and concentration distributions, a majority of RQEs have velocity dispersions and dynamical masses that are lower than the median values for older ETGs. The difference in distributions is partially due to the fact that RQEs are essentially a population while the underlying ETG sample extends to higher masses. This highlights that RQEs are the progenitors of a particular subset of ETGs. But, we also see a clear offset when comparing RQEs and the bulk of ETGs in Figure 9. At a fixed dynamical mass, RQEs typically have a 50% larger stellar mass. In some cases, the stellar masses are clearly unphysical with . This offset likely represents systematic errors in the color-based stellar M/L ratios, which can overestimate by as much as 0.3–0.5 dex for a significant burst of recent SF (Bell & de Jong, 2001). In this light, the majority of RQEs are consistent with a post-starburst population that is unique compared to both red ETGs and older blue ellipticals in terms of their SFHs. It is also possible that some of the dynamical-stellar mass differences reflect that the stars in different ETG populations may probe different typical fractions of their dark halos. Another possibility is that the RQEs could have a larger degree of rotation support resulting in smaller measured velocity dispersions. We note that one should take care in interpreting the sizes of RQEs at fixed stellar mass compared to normal ETGs. In Figure 9, we show that RQEs have similar sizes as older ETGs at a fixed dynamical mass.
Besides dynamical masses, three quarters of RQEs reside in smaller groups than the medians of both comparison samples. Nearly all RQEs are the dominant galaxy in their host group, compared to 70% for red ETGs. RQEs are nearly four times more likely than red ETGs (and 50% more likely than older blue ellipticals) to house a Seyfert AGN and are much more likely to have a post-starburst spectrum. We discuss these properties in more detail with respect to quenching in the next section.
Lastly, RQEs have a skewed stellar metallicity distribution such that half of this sample have values that are 50–100% greater than solar, in contrast to both non-SF comparison samples which have median solar metallicities. One has to be careful in interpreting young galaxies with high metallicities as these follow the well-known age-metallicity relation (Worthey, 1994). Recently, several studies have argued that some anticorrelation between young ages and high metallicities may be real (Graves et al., 2009; Trager & Somerville, 2009), but the SDSS spectroscopic data are too shallow to determine what fraction, if any, of the anticorrelation is real. It will be worthwhile to pin down the metallicities of RQEs since supersolar values may be an indication of metal enrichment from a sustained period of enhanced SF prior to quenching. We note that the lower metallicity nuclear gas found in tidally interacting pairs locally (Kewley et al., 2006; Ellison et al., 2008) is explained by low-metallicity gas flowing from galaxy outskirts during a major interaction (Rupke et al., 2010), but quickly followed by chemical enrichment from the subsequent SF (e.g., Torrey et al., 2012). In this light, metal-rich RQEs would have distinct SFHs from the rejuvenated, low-metallicity ETGs studied by Thomas et al. (2010).
| Comparison Samples | |||
| Property | Recently Quenched | non-SF, Gyr | non-SF |
| Ellipticalsa | Blue Ellipticals | Red ETGs | |
| (km s-1) | 99.4, 122.6, 149.2 | 115.6, 143.4, 179.3 | 128.1, 156.4, 191.5 |
| 10.20, 10.41, 10.64 | 10.40, 10.67, 10.94 | 10.45, 10.68, 10.93 | |
| 10.23, 10.39, 10.58 | 10.29, 10.50, 10.72 | 10.24, 10.43, 10.64 | |
| 11.86, 12.06, 12.36 | 11.95, 12.30, 12.77 | 11.95, 12.38, 13.24 | |
| 0.00, 0.23, 0.34 | 0.10, 0.01, 0.12 | 0.04, 0.04, 0.13 | |
| 9.20, 9.31, 9.39 | 9.64, 9.75, 9.85 | 9.81, 9.88, 9.93 | |
| -band | 2.85, 3.02, 3.24 | 2.88, 3.06, 3.22 | 2.82, 3.00, 3.17 |
| b (kpc h-1) | |||
| Number | 172 | 651 | 23,094 |
| central fraction | 0.90 | 0.84 | 0.69 |
| AGN fractionc | 0.087(0.35) | 0.055(0.29) | 0.024(0.23) |
| disturbed fraction | 0.15 | 0.18 | nad |
| EA fractione | 0.05 | 0.002 | 0 |
Properties of recently quenched ellipticals compared against (1) older ( Gyr), non-SF blue ellipticals, and (2) non-SF red ETGs meeting the same selection. The comparison samples have colors that fall within our modified non-SF regions (see text for detail). For each galaxy sample, we tabulate the 25%, 50% and 75%-tiles of the distributions of velocity dispersion, dynamical mass, stellar mass, halo mass, light-weighted stellar metallicity and age, and -band central-light concentration. In addition, we list the mean half-light size at the same fixed dynamical mass, plus we provide group center, AGN, disturbed morphology, and EA fractions where applicable.
a See § 4.1.1 for selection criteria.
b Mean and standard deviation of the half-light size of galaxies with dynamical masses within a narrow () bin centered on , the median for RQEs.
c Seyfert (Seyfert BPT LINER Yan et al. (2006) weak-LINER) emission type fractions, see § 3.2.
d Visual classifications were not done for red ETGs.
e Based on the Goto (2007a) catalog selected from SDSS DR5.
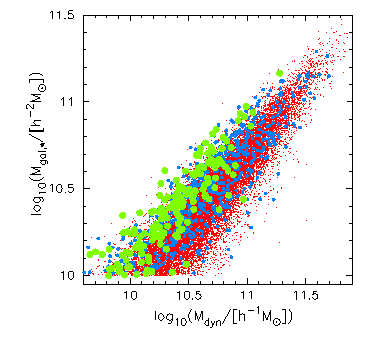
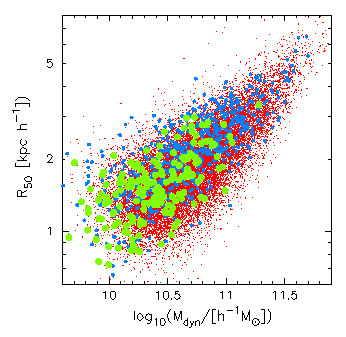
4.3 What Process Quenched Star Formation?
As outlined in the Introduction, the growth of the red-sequence population by the redward migration of blue-cloud galaxies requires both quenching of SF and the production of spheroid-dominated galaxies. By isolating RQEs with the structure of red ellipticals, but the recent SFH of blue galaxies, we can test for quenching processes that are both separate from mechanisms that build spheroids such as environmental effects on gas, and causally linked to major structural changes such as major gas-rich merging. The recently quenched SF in these RQEs may have been triggered in some part, or totally, by minor merging. Determining the amount of new stars and the time since SF shutdown is beyond the scope of this study. Instead, we focus on placing limits on the physics that ultimately quenched the SF in RQEs. In what follows, we include energetic feedback processes which may or may not be directly connected with merging, and we exclude SF regulation processes that are predicted to occur only in disk galaxies such as morphological quenching (e.g., Martig et al., 2009) and bar-driven secular evolution (e.g., Masters et al., 2011).
4.3.1 Environmental Quenching
The local environment of a galaxy can have a dramatic impact on its ability to accrete cold gas and maintain the production of new stars. Foremost, once the temperature of the gas in a galaxy’s halo reaches the virial temperature it will cool and accrete on to the galaxy with lower efficiency. Theoretical calculations predict a relationship between the gas cooling time and the size of a galaxy’s dark matter halo (Rees & Ostriker, 1977; White & Rees, 1978). Cosmological and hydrodynamical simulations indicate that hot gas becomes the dominant medium in halos with masses (Birnboim & Dekel, 2003; Kereš et al., 2005). Once hot gas dominates, feedback mechanisms such as AGN heating may efficiently transfer energy and momentum into the halo atmosphere and impede its subsequent accretion on to galaxies that live in the halo (Cattaneo et al., 2006; Croton et al., 2006; Sijacki & Springel, 2006). Recently, Dekel & Birnboim (2008) have calculated that deposition of gravitational energy from cosmological accretion of dense cold gas clumps might heat halos without the need for AGN feedback. Regardless of the heating source, hot halo quenching (i.e., impeding gas cooling) is predicted to affect both satellite (SAT) and central (CEN) galaxies (e.g., Gabor & Davé, 2012). However, without additional feedback to quench the star-forming fuel supply to the center of the halo, CENs in hot halos less massive than typically continue forming stars efficiently (Kereš et al., 2005, 2012; Nelson et al., 2013).
The preferred environment of RQEs is intriguing in terms of the halo quenching scenario. The majority of the RQEs we identify are CENs in small dark matter halos (88% have ). Therefore, if these galaxies are being quenched by a hot atmosphere in their small host halo, we might expect an increased incidence of AGN. We find that 7% have optical Seyfert emission and an additional 25% have optical LINER emission. If LINER emission and the typical AGN duty cycle are sufficient to maintain halo heating, then hot halo quenching may be the only mechanism required to explain central RQEs in small groups. But, as mentioned earlier, much of LINER emission appears not to reflect AGN activity and non-nuclear ionization sources are not reported to be energetic enough to maintain halo quenching. If, on the other hand, very efficient AGN feedback from an active Seyfert is required to maintain quenching at the centers of such small halos, then additional heating mechanisms would be required if halo quenching is important for most RQEs. Even if quenching was initially triggered by an energetic outflow, additional processes are still needed to prevent subsequent accretion and maintain long term quenching. Besides AGN heating, other options include gravitational heating (Dekel & Birnboim, 2008) and SN feedback (Springel & Hernquist, 2003), but these are expected to work only in larger () and smaller () halos, respectively, than the typical RQE hosts. We note that we do not know for certain whether the host halos of RQEs are hot. RQEs, especially those without optical AGN emission, are good candidates for further testing of halo quenching by looking for extended hot halo gas using ROSAT stacking (e.g., Anderson et al., 2013).
The small SAT fraction suggests that satellite-specific processes are not important for quenching most RQEs. It is possible that even fewer than the small number (17) of these galaxies were not quenched as SATs. First, some of the satellite RQEs may be interlopers. Tests with mock redshift surveys show that the Y07 catalog has an interloper fraction of (Yang et al., 2005). Such contaminants are typically CENs of low-mass halos along the line of sight. We estimate the degree to which interlopers can enhance the RQE central fraction as follows. For the median stellar mass of RQEs, van den Bosch et al. (2008) found that the SAT fraction is roughly 25%. On the one hand, the interloper fraction implies that 3–5% of galaxies are actual additional CENs, which could raise the RQE central fraction to as much as 95%. On the other hand, applying the interloper fraction to only the RQE satellites would add just 1–2%. Secondly, van den Bosch et al. calculated that the fraction of red-sequence SATs that were quenched as satellites drops from 30% at to a few percent at the maximum RQE mass. Assuming that these results apply to the unique subset of RQEs, it is possible that any legitimate SATs might have quenched prior to falling into their host halo; i.e., it is possible that all RQEs were quenched as CENs.
Assuming that some of the RQEs are legitimate SATs, the stripping of the hot gas atmosphere of the galaxy (strangulation) is argued to be both the main quenching mechanism for SATs and efficient at all halo masses (van den Bosch et al., 2008). With regard to ram-pressure stripping, only one-quarter of the satellite RQEs reside in cluster-sized halos (masses larger than ) in which it is expected that rapid motion of the SAT through the ICM can remove gas. Moreover, these SATs all lie at large projected cluster-centric distances ( kpc) where ram-pressure stripping would be least effective. We note that more than half of the SATs are found in halos, which is consistent with the masses needed for hot halo quenching (impeding gas cooling). If this is the responsible quenching mechanism, an open question is when were these previously star-forming ellipticals added to their halo – before or after quenching? If the quenching event marked the halo entry, this would support the idea that the gas accretion rate of a SAT declines rapidly (0.5–1 Gyr) after it enters a large halo (Simha et al., 2009). Conversely, Wetzel et al. (2013) have argued for a ‘delayed-then-rapid’ quenching scenario in which SATs spend 2–4 Gyr forming stars at a normal rate after initial infall, before finally rapidly quenching.
We note that the satellite RQEs have a much higher Seyfert fraction (albeit small numbers: five out of 17 ) and a similar LINER fraction compared to their CEN counterparts. In both cases, the incidence of such activity in SATs does not depend on environmental measures such as halo mass or distance from halo center in agreement with the behavior of the general SAT population (Pasquali et al., 2009). It is interesting to speculate whether some of these SATs, especially the Seyferts, are recent merger remnants that actually mark the centers of substructure in their host group; e.g., McIntosh et al. (2008) argued that SAT-SAT mergers may represent the dynamical centers of subhalos that have recently accreted on to their host. In fact, Simha et al. (2009) showed that mergers between satellite galaxies within infalling substructures are common in cosmological simulations.
4.3.2 Quenching by Energetic Feedback
The addition of energy released from supermassive black hole accretion (AGN feedback) or from super novae and massive-star winds during a burst or strong enhancement of SF (SN or stellar feedback) are argued to be important quenching mechanisms. For example, Kaviraj et al. (2011) make the case for AGN feedback arguing that gas depletion by SF alone is too slow to explain the blue-to-red migration rate observed in local ETGs by Schawinski et al. (2007). Compared to ‘radio mode’ AGN feedback, which simply keeps the atmospheres of groups and clusters hot as discussed in the previous section, simulations show that energetic or mechanical AGN feedback can remove and/or dynamically disrupt the gas resevoirs of isolated elliptical galaxies (e.g., Gaspari et al., 2012). Calculations show that nuclear inflows of gas are caused by non-axisymmetric pertubations from both galaxy interactions (Barnes & Hernquist, 1996; Mihos & Hernquist, 1996; Springel et al., 2005) and from large-scale stellar bars (Shlosman et al., 1989), which provides theoretical grounds for the debate in the literature about whether a major merger-AGN connection exists or not (e.g., Cisternas et al., 2011). Therefore, here we first discuss the evidence for feedback in our sample of RQEs regardless of the triggering mechanism, and in the next section we investigate whether any connections can be made with recent major merging.
We noted the incidence of optical Seyfert and LINER emission in the previous section. As Table 4 shows, Seyfert activity is more than three times higher in RQEs compared to red and dead ETGs. Conversely, there is no difference in the LINER fraction. Including LINERs, the optical AGN fraction (35%) for RQEs is much larger than the 8% quoted by Mendel et al. (2013) using the same BPT criteria for a larger sample of recently quenched SDSS galaxies. We conclude that this difference comes from their sample selection which includes galaxies that are up to times less massive than our low-mass cutoff. An increased AGN fraction and, hence, importance with higher stellar mass may seem natural at first given the fundamental relationship between black hole and galaxy spheroid masses (Ferrarese & Merritt, 2000; Gebhardt et al., 2000). The stellar mass dependence of AGN incidence has been linked to SF quenching efficiency to argue that AGN feedback dominates at (Kaviraj et al., 2007). But, Aird et al. (2012) argue that the distribution of AGN accretion rates are independent of the host galaxy mass and find no direct relation between the presence of an AGN and quenching.
Of all the RQEs, the active Seyferts provide an association between nuclear activity and recent quenching. Our finding is in qualitative agreement with the maximum Seyfert fraction found by S07 and Schawinski et al. (2010) among galaxies in the green valley that are presumably migrating redwards. We note that the Seyfert incidence in RQEs is more than 60% higher than in similarly non-star-forming, but older, blue ellipticals. Yet, Seyfert lifetimes are very brief ( Myr, Martini, 2004; Hopkins & Hernquist, 2006) compared to the RQE phase (presumably A-star lifetime), thus, the observed activity in RQEs is likely unrelated to the actual quenching. It is possible that these Seyferts are the later stage of much more powerful obscured QSO phases (Hopkins et al., 2005) that quenched SF, or they are merely the result of some gas remaining in the nuclei of some RQEs. Likewise, some LINERs might be the very tail end of the quenching AGN as schematically illustrated in Fig. 1 of Hopkins et al. (2008), or they may simply reflect the underlying fraction of ETGs with LINER emission (many of which are not associated with nuclear ionization; e.g., Annibali et al., 2010). The simple fiber emission-line diagnostics we use do not allow us to explore these possibilities. Potentially, a direct AGN feedback link can be demonstrated with observations of high-velocity outflows tied to an AGN in systems that have recently quenched. So far, observations of Seyferts with outflows are quite limited at low redshift (Riffel et al., 2009; Müller-Sánchez et al., 2011; Crenshaw & Kraemer, 2012), and totally lacking for recently quenched galaxies. Assuming that the RQE-Seyfert association reflects the frequency of actual AGN feedback, then the low Seyfert fraction would imply that this mechanism is not important for the majority of high-mass RQEs.
With regard to stellar feedback, we find a remarkably significant, yet low, percentage (5%) of RQEs that are identified as EA by Goto (2007a). Our fraction is in good agreement with that found by Mendel et al. (2013) in recently quenched galaxies extending to lower stellar mass. This percentage is significant compared to older non-SF blue ellipticals (0.2%), red non-SF ETGs (0%), and the total SDSS galaxy sample (0.1%, Goto, 2007a; Wong et al., 2012). The interpretation of the EA signature has long been a large starburst that was rapidly and recently truncated (Dressler & Gunn, 1983; Chilingarian & Zolotukhin, 2012). But, it remains unclear if the burst was responsible for quenching the RQE in the EA subset. Indeed, all of the RQEs are post ‘starburst’ at some level given their unusually blue colors but lack of SF. Our results suggest that most quenching does not involve a starburst big enough to make a long-lived EA signature. Under the assumption that stellar feedback is important only in strong post-starburst systems, then the weak EA association would imply that stellar feedback is not important for the majority of high-mass RQEs. Moreover, if all RQEs (or a large fraction) are examples of first-generation ellipticals, then EA studies are exploring just a small subset of the newly-formed elliptical population.
4.3.3 Quenching by Major Merging
The work of Hopkins, in particular, has given a lot attention to the gas-rich major-merger production of red ellipticals as the natural link between hierarchical evolution and the migration of galaxies necessary to explain the buildup of the red sequence. The merger-fueled formation of new stars followed by efficient quenching of SF is a compelling model that naturally explains blue-to-red color evolution, the destruction of disks, and the formation of elliptical galaxies. Indeed, with sufficiently high gas fractions, this model nicely ties together the evolution of starburst and quasar activity with the production of galaxy spheroids over cosmic time (Hopkins et al., 2006, 2008). While the cold gas fractions in present-day disk galaxies are much lower than at , major merging remains the best way to form new elliptical galaxies and a viable way to quench recent SF. In this context, the RQEs of this study provide an important elliptical galaxy subpopulation with which to test the modern merger hypothesis since it predicts a RQE phase in which the formation of an elliptical and the quenching of SF are clearly causally linked. Here, we discuss to what degree RQEs agree with the major merger scenario and test the plausibility of a major merger-quenching connection by exploring their disturbed fraction, AGN fraction, and preferred environment. We then compare the frequency of RQEs to that of local gas-rich mergers.
Test 1: Morphological Disturbance. An obvious test for a merger-RQE connection is signs of recent tidal activity. Not withstanding our uncertainty in recognizing morphologically peculiar ellipticals, the low disturbed fraction (15%) among RQEs, naively, may conflict with idea that all RQEs are made in major mergers. There are two possible interpretations (where both may be at play): not all RQEs are made in major mergers, or the time-scales for identifying post-merger disturbed morphology are substantially shorter than the time-scale over which the stellar population signatures of RQEs are seen.
It is noteworthy that RQEs do not show an enhanced disturbed fraction over older, non-SF blue ellipticals (see Table 4). As Feldmann et al. (2008) showed, ellipticals with clear morphological disturbances (pE types) could be the result of recent accretion of a minor satellite on to a pre-existing elliptical. Distinguishing new end products of minor and major merging is beyond the scope of this study. If any disturbed RQEs are the result of minor accretion, these galaxies would be consistent with frosting of an existing elliptical galaxy and inconsistent with major merger quenching. Unfortunately, morphology alone does not provide conclusive tests of the merger hypothesis. Multiple studies find a broad association between peculiar morphologies and younger populations (Schweizer & Seitzer, 1992; Tal et al., 2009; Győry & Bell, 2010), which lends support to the notion that recent SF is often associated with some kind of interaction (either minor or major), but the scatter is large in the observed correlations. In this light, the level of morphological disturbances among RQEs is consistent with the scatter in the age-asymmetry correlations.
If we assume that every RQE was formed by a recent major merger of spiral galaxies, the low fraction of obvious (i.e., strong) tidal features may simply provide information about the dynamical age of these galaxies (i.e., time since coalescence). Merger simulations predict that major gaseous disk-disk mergers produce spheroidal remnants that start highly disturbed (qualitatively like our SPM classification), and then dynamically relax and settle into a normal elliptical morphology over time. As with efficiency of merger-induced SF (Cox et al., 2008), the post-merger morphology and its time-scale to relaxation depends on the suite of merger parameters, but typically the strong morphological disturbances are short-lived and insensitive to viewing angle and most merger orbits. For example, strong asymmetries fade in Gyr in realistic images generated from a series of simulated disk-disk mergers spanning major mass ratios and present-day massive spiral gas fractions (Lotz et al., 2008, 2010b, 2010a). Using deeper SDSS Stripe 82 data, Schawinski et al. (2010) argued that major morphological disturbances in green-valley ETGs decline rapidly (in several hundred Myr) after a merger-driven starburst to the levels of quiescent ETGs. It would be interesting to observe RQEs with deeper imaging to look for evidence of fairly recent tidal activity.
Test 2: AGN Fraction. Under the right conditions (e.g., orbital configuration, mass ratio, gas fraction, progenitor morphology), hydrodynamical simulations demonstrate that disk-disk merging produces radial inward gas flows that fuel central SF and supermassive black hole growth (Barnes & Hernquist, 1991, 1996; Mihos & Hernquist, 1994, 1996; Cox et al., 2008; Johansson et al., 2009). As such, energetic AGN and SN feedback are the favored quenching mechanism in new major merger remnants (Springel et al., 2005; Cox et al., 2006; Khalatyan et al., 2008). In this light, the fact that RQEs have the highest incidences of Seyfert emission (9%) and post-starburst signatures (5%) among local ETGs supports the idea that some fraction of this population formed in a gas-rich merger that triggered their quenching. If we assume that the RQEs with LINER emission were formed by a recent merger and we are witnessing the low-power tail end of merger fueled AGN activity, then 35% of RQEs have spectroscopic signatures that are consistent with energetic feedback quenching triggered by a merger. Yet, this merger-AGN connection is tenuous given that a fifth of non-SF red ETGs are LINERs (see Table 4), and given the fact that many LINERs may not be AGNs. On the other hand, Hopkins et al. (2008) argued that major merging could provide at least temporary quenching purely by shock heating the gas, but it is not clear if this would work over very long time-scales. Under the assumption that RQEs are the result of a recent merger, it is possible that this temporary quenching could account for the majority of the RQEs with no AGN (but others argue AGN feedback is mandatory; e.g., Springel et al., 2005). In this light, optical AGN fractions do not provide conclusive interpretations with respect to major merging quenching (see also, Schawinski et al., 2010).
Test 3: Environment. We find that the preferred environment of RQEs agrees well with hierarchical merging predictions. As discussed in the previous sections, 90% of RQEs reside at the centers of their host halo and these host halos are typically small with a median mass of . Hopkins et al. (2008) defined the ‘small group scale’ to describe the lowest-mass halos with the highest probability to host a pair of similar mass galaxies, and showed that major mergers are most likely to occur at the centers of such halos. Further, they calculated the halo mass in which major merging on to the central galaxy is most efficient as a function of galaxy mass (see their Fig. 4). We compare these calculations to the typical halo masses of central RQEs, under the assumption that these galaxies formed in a recent spiral-spiral merger at the center of their host halos. For example, the median stellar mass central RQE has a mass of and lives in a halo. If this galaxy formed by a major 1:3 (or 1:1) merger of a galaxy on to the central object, then Hopkins et al. predict a (12.2) halo to have the maximum efficiency for such a merger when we extrapolate using a characteristic mass for LTG’s (spirals) of from the local Schechter mass function of Bell et al. (2003). Likewise, for central RQEs in halos spanning the upper and lower quartiles of the mass distribution, the peak merger efficiency occurs in halos with small group scale masses between , which is in very good agreement with the RQE percentiles .
Test 4: Comparison to Merger Demographics. As a final test, we compare the incidence of RQEs to the demographics of major spiral-spiral interactions at low redshift. This comparison provides some interesting insights into the likelihood of mergers that produce starbursts, AGNs and quenching in accord with simulations. Using results from a forthcoming analysis of the same complete selection of high-mass SDSS galaxies, we find that the number density of major interactions between two star-forming galaxies based on the H12 criteria is 65% to twice that of RQEs (the range represents the strength of visible disturbances in the galaxy pairs, McIntosh et al., in prep.). If we select the lower limit of spiral pairs with the strongest interaction signatures, and assume that these disturbances are visible for half the typical RQE phase time-scale, then this result suggests that all RQEs could have been formed in such a merger, recently.
4.4 Plausible Descendants of RQEs
As described in § 4.2, the nature of RQEs is unique compared to typical red-and-dead ETGs. In the context of the expected redward evolution of RQEs, it is worthwhile to ask if any red galaxies with similar properties but older stellar ages (i.e., plausible descendants) exist at late cosmic times. To answer this question, we search the red-sequence population of ETGs for older non-star-forming galaxies of similar small velocity dispersion and high stellar metallicities as the RQEs. As shown in Table 4, the velocity dispersion (and related dynamical mass) and metal richness of RQEs are the most striking differences in comparison to typical non-SF red ETGs, aside from AGN and EA fraction differences. Under the simple assumption that the RQEs will experience no new SF, the young stars will evolve and we expect that their descendants should maintain their mass and size as they evolve redwards as long as they do not have many minor mergers in the interim which are predicted to puff up ETG sizes (Bezanson et al., 2009). Clearly, stellar aging will reduce the frequency of systems with post-starburst signatures to zero, and we expect a likewise drop in Seyfert systems since this activity is predicted to be a brief phase, especially if it is tied to merger-driven AGN feedback (e.g., Hopkins et al., 2008).
With the above constraints in mind, we focus our search on red ETGs with the highest values (we use the upper metallicity quartile for non-SF red ETGs, see Table 4), and velocity dispersions that fall within the upper and lower quartiles of the RQE population. Additionally, we require plausible RQE descendants to have light-weighted ages Gyrs, meet the H12 non-SF criteria, be similarly round () as typical RQEs, and have AGN (LINER or Seyfert) emission or be spectroscopically quiescent; i.e., no SF or Comp emission types. These criteria result in 475 plausible descendants with km s-1 and . Thus, we find that low-, round, metal-rich ETGs with older stellar ages do exist at low redshift.
The majority of plausible RQE descendants and RQEs with matched velocity dispersions have comparably small sizes ( kpc). With regard to light-weighted stellar metallicities, we find that the most metal-rich descendant candidates have similar (somewhat lower but within the quoted dex uncertainties) metallicities as RQEs. The metal-rich descendants make up the upper 10% of similar low- red ETGs, which tend to have closer to solar metallicities; i.e., such low-mass, metal-rich ETGs exist, but they are fairly unusual compared to the fraction of metal-rich systems among higher-mass ETGs. In § 4.2, we discussed the issues with interpreting high metallicities in light of the age-metallicity degeneracy (Worthey, 1994). Nevertheless, if we take the RQE and descendant candidate metallicities at face value, we speculate that small differences in median metallicities between these two populations can arise simply from aging of recently formed metal-rich stars and the subsequent decrease of their contribution to the overall luminosity. In terms of basic structural properties, this population of plausible RQE descendants is consistent with evolved RQEs and has a number density of that is 5.5 times greater (at matched ); i.e., there are enough of these galaxies to account for the expected color evolution of RQEs.
We investigate the environments of the plausible descendants and find that the fraction that reside at the center of their host group is only 64%. This value is somewhat lower than for all non-SF red ETGs, and much lower than the 93% central fraction for the RQEs with matched velocity dispersions. The central RQE descendants reside in small groups with an average halo mass of , which is comparable to the size of halos with a central RQE. Therefore, given the larger number density of plausible descendants, every central RQE could evolve on to the red sequence at the center of its host halo and be consistent with the 64% CEN fraction. With regard to quenching, we find that the CEN descendant candidates have high AGN and Seyfert fractions of 51% and 5%, respectively. Given their median age ( Gyrs), these fractions are noteworthy for two reasons. First, it appears that Seyferts can occur in small red ellipticals presumably long after SF was quenched, which calls into question connections between short duty cycle AGNs and blue-to-red migration (e.g. S07). Secondly, the high fraction (46%) of LINER activity in these CENs is consistent with the idea that heating from a low-power AGN (Cattaneo et al., 2006; Croton et al., 2006; Sijacki & Springel, 2006) could be keeping SF shut off at the centers of these small halos, which would otherwise accrete enough gas to remain star-forming (Kereš et al., 2005, 2012; Nelson et al., 2013). Whether the typical ionization source of LINERs is post-AGB stars or a low-accretion black hole, it would be interesting to test if these objects can provide sufficient heating in small dark halos.
5 Summary
We analyze a large sample of high-mass, ETGs from the SDSS DR4 that are unusually blue; i.e., bluer than the empirical red sequence with typically green-valley colors. This sample is volume-limited () and stellar mass-limited (). Through careful morphological inspection we identify an important subsample of 1500 blue elliptical (pure spheroid) galaxies; nearly 10% have morphological peculiarities that are suggestive of recent tidal activity (either major or minor merging). These bluest ellipticals comprise 3.7% of high-central concentration selected () ETGs with stellar masses between and . The vast majority (95%) of visually-selected blue ellipticals have axial ratios of , which is a cut that Zhu et al. (2010) employed to remove S0 galaxies. Moreover, these blue galaxies follow a stellar mass-size relation that is consistent with red-sequence ETGs and distinct from star-forming disk galaxies. Very few blue ellipticals have stellar masses in excess of , which is consistent with the idea that dry merging dominates the mass assembly of the most massive ellipticals (e.g., McIntosh et al., 2008; van der Wel et al., 2009). In terms of nebular emission, we find that unusually blue ellipticals are quite active with distinct emission fractions compared to three control samples: red ETGs, blue disk-dominated galaxies, and blue ETGs with visual disk features (i.e., bulge-dominated spirals and S0 galaxies). The incidence of blue ellipticals with optical SF emission is much greater than that of red ETGs, but lower than for both blue disk galaxy populations. Blue ellipticals are 50% more likely to have strong emission (S/N in all four BPT lines) than red ETGs, yet 40% are spectroscopically quiescent. We divide blue elliptical galaxies by optical emission into several subpopulations in Figure 5 and find that they follow a similar sequence of emission activity in the color-sigma plane as S07 found for a broad selection of ETGs not limited by visual classification, color or stellar mass. We find that the subset of disturbed blue ellipticals prefer to populate the bluer, high-velocity-dispersion edge of this distribution for all emission types except Seyferts. This result is tentative given possible identification biases at the lowest masses, but it is also intriguing in light of scenarios that involve merging and quenching to explain the mass limit of the blue cloud (e.g., Faber et al., 2007).
While high-mass, blue elliptical galaxies with specific emission properties (e.g., star-forming ellipticals) are interesting in their own right, here we focus on one subset, a unique population of RQEs. We find that many quiescent blue ellipticals have distinct – colors (Fig. 7) that extend bluewards of the robust selection of non-star-forming galaxies by H12, and are very young based on Gallazzi et al. (2005) light-weighted stellar age estimates. As such, we confirm a similar color-based selection of young quiescent ETGs at by Whitaker et al. (2012). We use modified non-star-forming colors, Gyr, and a lack of detectable emission from SF to identify 172 RQEs. These are a unique subpopulation of ETGs; i.e., virtually zero red-sequence ETGs have the ages and colors of RQEs. These galaxies clearly experienced a recent quenching of SF and are now transitioning to the red sequence. We argue that RQEs have recent SFHs that are distinct from similarly young and blue ETGs with ongoing SF (i.e., rejuvenated ETGs, Thomas et al., 2010). Compared to older blue and red non-SF ETGs, RQEs are offset to larger stellar masses which likely reflects stellar M/L ratio overestimates from a recent burst of SF (Bell & de Jong, 2001). Given their unusually blue colors, all RQEs are post ‘starburst’ at some level. While we find a significant incidence (5%) of RQEs identified as post-starburst by Goto (2007a), we conclude that most quenching does not involve a starburst big enough to produce an EA signature. Keeping the caveat in mind that one must take care in interpreting young galaxies with high metallicities in light of the age-metallicity degeneracy, we note that the majority of RQEs have Gallazzi et al. stellar metallicity estimates above solar, unlike similar mass rejuvenated ETGs. Taken at face value, metal-rich RQEs are consistent with chemical enrichment from a significant merger-triggered SF event prior to quenching (Torrey et al., 2012). Given the expected redward evolution of RQEs, we identify similarly low-dynamical mass, metal-rich, and non-star-forming ETGs with older stellar ages (plausible RQE descendants) at low redshift with sufficient numbers to account for these RQEs.
RQEs are strong candidates for ‘first-generation’ ellipticals formed in a relatively recent major spiral-spiral merger, thus, RQEs provide a useful test of the modern merger hypothesis for the origin of new ellipticals (e.g., Hopkins et al., 2008). A number of RQE properties are consistent with a recent gas-rich merger origin. Comparing the incidence of RQEs to spiral-spiral major-merging demographics from the SDSS (McIntosh et al., in prep.) suggests that all such mergers can produce a RQE under the simple assumption that the RQE time-scale is twice the tidal interaction visibility time-scale. In terms of environmental metrics from Yang et al. (2007), RQEs reside in smaller groups (90% in ) than red ETGs, and are the most massive (‘central’) galaxy in their host halo more often (90% vs. 70%). The preferred environment of RQEs agrees well with hierarchical merging predictions of Hopkins et al. (2008), such that most reside at the centers of small dark matter halos with masses that match the small group scale in which spiral merging on to the halo center is maximally efficient. We argue that the low (15%) disturbed fraction is consistent with the large scatter in the observed age-asymmetry correlation (Schweizer & Seitzer, 1992; Tal et al., 2009; Győry & Bell, 2010), and likely reflects that the time-scale for identifying post-merger tidal signatures is substantially shorter than the RQE phase lifetime.
The number density of RQEs is ; the upper limit includes blue ETGs with uncertain classifications that may be elliptical in morphology. For masses above , the number density is comparable to the simple evolution model from Whitaker et al. (2012), such that massive RQEs can account for 56–70% of the young quiescent galaxies necessary to match the quiescent red-sequence growth at late cosmic time assuming a 0.5 Gyr time-scale for the RQE phase. As such, RQEs provide a testbed for constraining different quenching processes related to one (possibly the most important) channel of blue-to-red migration – the addition of new ellipticals to the red sequence. If we assume that RQEs were formed by gas-rich mergers, then the higher incidences of Seyfert emission (9%) and EA signatures compared to the bulk of local ETGs are consistent with the idea that some fraction of this population was quenched relatively recently by merger-triggered energetic feedback. But this fraction is small, even if one assumes that Seyfert activity is the tail end of a more powerful QSO and stellar feedback dominates only in strong post-starburst systems. These associations are mainly circumstantial and the emission-line diagnostics we employ do not allow us to make a direct energetic feedback-quenching (either AGN or SN) nor merger-quenching connection for RQEs.
Instead, our analysis allows us to rule out satellite-specific quenching processes for 90% of RQEs and provides a number of constraints on likely quenching mechanisms for most RQEs. Foremost, the high fraction of central RQEs in small () halos indicates that if these galaxies were quenched by the inability of the hot halo atmosphere to cool, then additional feedback mechanisms are needed to maintain the heating and halo quenching (e.g., Kereš et al., 2005). Even if quenching was initially triggered by a very energetic process (e.g., strong AGN feedback), additional processes are still needed to maintain long term quenching. Depending on the assumed duty cycle, the incidence of Seyferts and LINERs may be sufficient to maintain halo heating. While the LINER fraction of RQEs is no different from that of old red ETGs, we find a significant excess () in the LINER incidence among the plausible central RQE descendants residing in similar mass halos, which supports the low-power AGN heating model for keeping SF shut off long after it was initially quenched. But, if LINERs (regardless of the ionizing source) are not energetic enough to effectively heat these halos, then the low frequency of Seyfert activity would imply that additional heating mechanisms must be at play if halo quenching is important for the majority of RQEs. This opens the possibility for unexplored heating processes or for known sources (e.g., SN feedback or gravitational heating) that are effective at halo masses different from what is predicted. Further analysis of RQEs and their likely descendants will provide valuable additions to our understanding of the complex processes that govern galaxy evolution.
Acknowledgements
We thank the anonymous referee for useful comments that strengthened this paper. We are grateful for useful discussions with Alison Coil, Stéphane Courteau, T. J. Cox, Lars Hernquist, Phil Hopkins, Neal Katz, Hans-Walter Rix, Greg Rudnick, Arjen van der Wel and Martin Weinberg during different manifestations of this work. D.H.M., C.W., A.C., and J.M. acknowledge support from the Research Corporation for Science Advancement under the Cottrell College Science Award grant No. 10777. C.W., A.C., and J.M. acknowledge support from the Missouri Consortium of NASA’s National Space Grant College and Fellowship Program. A.G. acknowledges support from the EU FP7/2007-2013 under grant agreement No. 267251 AstroFIt. This publication makes use of the Sloan Digital Sky Survey (SDSS). Funding for the creation and distribution of the SDSS Archive has been provided by the Alfred P. Sloan Foundation, the Participating Institutions, the National Science Foundation, the U.S. Department of Energy, the National Aeronautics and Space Administration, the Japanese Monbukagakusho, the Max Planck Society, and the Higher Education Funding Council for England. The SDSS Web Site is http://www.sdss.org/. The SDSS is managed by the Astrophysical Research Consortium for the Participating Institutions. The Participating Institutions are the American Museum of Natural History, Astrophysical Institute Potsdam, University of Basel, University of Cambridge, Case Western Reserve University, University of Chicago, Drexel University, Fermilab, the Institute for Advanced Study, the Japan Participation Group, Johns Hopkins University, the Joint Institute for Nuclear Astrophysics, the Kavli Institute for Particle Astrophysics and Cosmology, the Korean Scientist Group, the Chinese Academy of Sciences (LAMOST), Los Alamos National Laboratory, the Max-Planck-Institute for Astronomy (MPIA), the Max-Planck-Institute for Astrophysics (MPA), New Mexico State University, Ohio State University, University of Pittsburgh, University of Portsmouth, Princeton University, the United States Naval Observatory, and the University of Washington. This publication also made use of NASA’s Astrophysics Data System Bibliographic Services and TOPCAT (Tools for OPerations on Catalogues And Tables, Taylor, 2005).
References
- Abadi et al. (1999) Abadi M. G., Moore B., Bower R. G., 1999, MNRAS, 308, 947
- Abadi et al. (2003) Abadi M. G., Navarro J. F., Steinmetz M., Eke V. R., 2003, ApJ, 597, 21
- Abazajian et al. (2009) Abazajian K. N., Adelman-McCarthy J. K., Agüeros M. A., Allam S. S., Allende Prieto C., An D., Anderson K. S. J., Anderson S. F., Annis J., Bahcall N. A., et al. 2009, ApJS, 182, 543
- Adelman-McCarthy & et al. (2006) Adelman-McCarthy J. K., et al. 2006, ApJS, 162, 38
- Aird et al. (2012) Aird J., Coil A. L., Moustakas J., Blanton M. R., Burles S. M., Cool R. J., Eisenstein D. J., Smith M. S. M., Wong K. C., Zhu G., 2012, ApJ, 746, 90
- Anderson et al. (2013) Anderson M. E., Bregman J. N., Dai X., 2013, ApJ, 762, 106
- Annibali et al. (2010) Annibali F., Bressan A., Rampazzo R., Zeilinger W. W., Vega O., Panuzzo P., 2010, A&A, 519, A40
- Baldry et al. (2004) Baldry I. K., Glazebrook K., Brinkmann J., Ivezić Ž., Lupton R. H., Nichol R. C., Szalay A. S., 2004, ApJ, 600, 681
- Baldwin et al. (1981) Baldwin J. A., Phillips M. M., Terlevich R., 1981, PASP, 93, 5
- Balogh et al. (2000) Balogh M. L., Navarro J. F., Morris S. L., 2000, ApJ, 540, 113
- Barmby et al. (2006) Barmby P., Alonso-Herrero A., Donley J. L., Egami E., Fazio G. G., Georgakakis A., Huang J.-S., Laird E. S., Miyazaki S., Nandra K., Park S. Q., Pérez-González P. G., Rieke G. H., Rigby J. R., Willner S. P., 2006, ApJ, 642, 126
- Barnes (1992) Barnes J. E., 1992, ApJ, 393, 484
- Barnes (2002) Barnes J. E., 2002, MNRAS, 333, 481
- Barnes & Hernquist (1996) Barnes J. E., Hernquist L., 1996, ApJ, 471, 115
- Barnes & Hernquist (1991) Barnes J. E., Hernquist L. E., 1991, ApJL, 370, L65
- Baugh et al. (1996) Baugh C. M., Cole S., Frenk C. S., 1996, MNRAS, 283, 1361
- Bekki (1998) Bekki K., 1998, ApJL, 502, L133+
- Bekki & Couch (2011) Bekki K., Couch W. J., 2011, MNRAS, 415, 1783
- Bekki et al. (2002) Bekki K., Couch W. J., Shioya Y., 2002, ApJ, 577, 651
- Bekki et al. (2005) Bekki K., Couch W. J., Shioya Y., Vazdekis A., 2005, MNRAS, 359, 949
- Bell & de Jong (2001) Bell E. F., de Jong R. S., 2001, ApJ, 550, 212
- Bell et al. (2004) Bell E. F., McIntosh D. H., Barden M., Wolf C., Caldwell J. A. R., Rix H.-W., Beckwith S. V. W., Borch A., Häussler B., Jahnke K., Jogee S., Meisenheimer K., Peng C., Sanchez S. F., Somerville R. S., Wisotzki L., 2004, ApJL, 600, L11
- Bell et al. (2003) Bell E. F., McIntosh D. H., Katz N., Weinberg M. D., 2003, ApJS, 149, 289
- Bell et al. (2006) Bell E. F., Naab T., McIntosh D. H., Somerville R. S., Caldwell J. A. R., Barden M., Wolf C., Rix H.-W., Beckwith S. V., Borch A., Häussler B., Heymans C., Jahnke K., Jogee S., Koposov S., Meisenheimer K., Peng C. Y., Sanchez S. F., Wisotzki L., 2006, ApJ, 640, 241
- Bell et al. (2012) Bell E. F., van der Wel A., Papovich C., Kocevski D., Lotz J., McIntosh D. H., Kartaltepe J., Faber S. M., Ferguson H., et al. 2012, ApJ, 753, 167
- Bell et al. (2004) Bell E. F., Wolf C., Meisenheimer K., Rix H.-W., Borch A., Dye S., Kleinheinrich M., Wisotzki L., McIntosh D. H., 2004, ApJ, 608, 752
- Bezanson et al. (2009) Bezanson R., van Dokkum P. G., Tal T., Marchesini D., Kriek M., Franx M., Coppi P., 2009, ApJ, 697, 1290
- Birnboim & Dekel (2003) Birnboim Y., Dekel A., 2003, MNRAS, 345, 349
- Blake et al. (2004) Blake C., Pracy M. B., Couch W. J., Bekki K., Lewis I., Glazebrook K., et al. 2004, MNRAS, 355, 713
- Blanton et al. (2003) Blanton M. R., Hogg D. W., Bahcall N. A., Baldry I. K., Brinkmann J., Csabai I., Eisenstein D., et al. 2003, ApJ, 594, 186
- Blanton et al. (2003) Blanton M. R., Hogg D. W., Bahcall N. A., Brinkmann J., Britton M., Connolly A. J., et al. 2003, ApJ, 592, 819
- Blanton et al. (2003) Blanton M. R., Lin H., Lupton R. H., Maley F. M., Young N., Zehavi I., Loveday J., 2003, AJ, 125, 2276
- Blanton & Moustakas (2009) Blanton M. R., Moustakas J., 2009, ARA&A, 47, 159
- Blanton & Roweis (2007) Blanton M. R., Roweis S., 2007, AJ, 133, 734
- Blanton et al. (2005) Blanton M. R., Schlegel D. J., Strauss M. A., Brinkmann J., Finkbeiner D., Fukugita M., Gunn J. E., Hogg D. W., et al. 2005, AJ, 129, 2562
- Boselli & Gavazzi (2006) Boselli A., Gavazzi G., 2006, PASP, 118, 517
- Bournaud et al. (2007) Bournaud F., Jog C. J., Combes F., 2007, A&A, 476, 1179
- Brammer et al. (2011) Brammer G. B., Whitaker K. E., van Dokkum P. G., Marchesini D., Franx M., Kriek M., Labbé I., Lee K.-S., Muzzin A., Quadri R. F., Rudnick G., Williams R., 2011, ApJ, 739, 24
- Brammer et al. (2009) Brammer G. B., Whitaker K. E., van Dokkum P. G., Marchesini D., Labbé I., Franx M., Kriek M., Quadri R. F., Illingworth G., Lee K.-S., Muzzin A., Rudnick G., 2009, ApJL, 706, L173
- Brinchmann et al. (2004) Brinchmann J., Charlot S., White S. D. M., Tremonti C., Kauffmann G., Heckman T., Brinkmann J., 2004, MNRAS, 351, 1151
- Brown et al. (2007) Brown M. J. I., Dey A., Jannuzi B. T., Brand K., Benson A. J., Brodwin M., Croton D. J., Eisenhardt P. R., 2007, ApJ, 654, 858
- Bruzual & Charlot (2003) Bruzual G., Charlot S., 2003, MNRAS, 344, 1000
- Carpineti et al. (2012) Carpineti A., Kaviraj S., Darg D., Lintott C., Schawinski K., Shabala S., 2012, MNRAS, 420, 2139
- Cattaneo et al. (2006) Cattaneo A., Dekel A., Devriendt J., Guiderdoni B., Blaizot J., 2006, MNRAS, 370, 1651
- Cheung et al. (2012) Cheung E., Faber S. M., Koo D. C., Dutton A. A., Simard L., McGrath E. J., Huang et al. 2012, ApJ, 760, 131
- Chilingarian & Zolotukhin (2012) Chilingarian I. V., Zolotukhin I. Y., 2012, MNRAS, 419, 1727
- Cisternas et al. (2011) Cisternas M., Jahnke K., Inskip K. J., Kartaltepe J., Koekemoer A. M., Lisker T., Robaina A. R., et al. 2011, ApJ, 726, 57
- Cole et al. (2000) Cole S., Lacey C. G., Baugh C. M., Frenk C. S., 2000, MNRAS, 319, 168
- Conselice (2003) Conselice C. J., 2003, ApJS, 147, 1
- Courteau et al. (1996) Courteau S., de Jong R. S., Broeils A. H., 1996, ApJL, 457, L73
- Cox et al. (2006) Cox T. J., Dutta S. N., Di Matteo T., Hernquist L., Hopkins P. F., Robertson B., Springel V., 2006, ApJ, 650, 791
- Cox et al. (2006) Cox T. J., Jonsson P., Primack J. R., Somerville R. S., 2006, MNRAS, 373, 1013
- Cox et al. (2008) Cox T. J., Jonsson P., Somerville R. S., Primack J. R., Dekel A., 2008, MNRAS, 384, 386
- Crenshaw & Kraemer (2012) Crenshaw D. M., Kraemer S. B., 2012, ApJ, 753, 75
- Crocker et al. (2012) Crocker A., Krips M., Bureau M., Young L. M., Davis T. A., Bayet E., et al. 2012, MNRAS, 421, 1298
- Croton et al. (2006) Croton D. J., Springel V., White S. D. M., De Lucia G., Frenk C. S., Gao L., Jenkins A., Kauffmann G., Navarro J. F., Yoshida N., 2006, MNRAS, 365, 11
- Darg et al. (2010) Darg D. W., Kaviraj S., Lintott C. J., Schawinski K., Sarzi M., Bamford S., Silk J., Proctor R., Andreescu D., Murray P., Nichol R. C., Raddick M. J., Slosar A., Szalay A. S., Thomas D., Vandenberg J., 2010, MNRAS, 401, 1043
- Dasyra et al. (2006) Dasyra K. M., Tacconi L. J., Davies R. I., Naab T., Genzel R., Lutz D., Sturm E., Baker A. J., Veilleux S., Sanders D. B., Burkert A., 2006, ApJ, 651, 835
- Debattista et al. (2006) Debattista V. P., Mayer L., Carollo C. M., Moore B., Wadsley J., Quinn T., 2006, ApJ, 645, 209
- Dekel & Birnboim (2006) Dekel A., Birnboim Y., 2006, MNRAS, 368, 2
- Dekel & Birnboim (2008) Dekel A., Birnboim Y., 2008, MNRAS, 383, 119
- Di Matteo et al. (2008) Di Matteo T., Colberg J., Springel V., Hernquist L., Sijacki D., 2008, ApJ, 676, 33
- Di Matteo et al. (2005) Di Matteo T., Springel V., Hernquist L., 2005, Nature, 433, 604
- Diamond-Stanic et al. (2012) Diamond-Stanic A. M., Moustakas J., Tremonti C. A., Coil A. L., Hickox R. C., Robaina A. R., Rudnick G. H., Sell P. H., 2012, ApJL, 755, L26
- Dressler (1980) Dressler A., 1980, ApJ, 236, 351
- Dressler & Gunn (1983) Dressler A., Gunn J. E., 1983, ApJ, 270, 7
- Dressler et al. (1997) Dressler A., Oemler A. J., Couch W. J., Smail I., Ellis R. S., Barger A., Butcher H., Poggianti B. M., Sharples R. M., 1997, ApJ, 490, 577
- Ellison et al. (2008) Ellison S. L., Patton D. R., Simard L., McConnachie A. W., 2008, AJ, 135, 1877
- Emsellem et al. (2007) Emsellem E., Cappellari M., Krajnović D., van de Ven G., Bacon R., Bureau M., Davies R. L., de Zeeuw P. T., Falcón-Barroso J., Kuntschner H., McDermid R., Peletier R. F., Sarzi M., 2007, MNRAS, 379, 401
- Faber et al. (2007) Faber S. M., Willmer C. N. A., Wolf C., Koo D. C., Weiner B. J., et al. 2007, ApJ, 665, 265
- Fang et al. (2012) Fang J. J., Faber S. M., Salim S., Graves G. J., Rich R. M., 2012, ApJ, 761, 23
- Farouki & Shapiro (1980) Farouki R., Shapiro S. L., 1980, ApJ, 241, 928
- Farouki & Shapiro (1981) Farouki R., Shapiro S. L., 1981, ApJ, 243, 32
- Feldmann et al. (2008) Feldmann R., Mayer L., Carollo C. M., 2008, ApJ, 684, 1062
- Ferrarese & Merritt (2000) Ferrarese L., Merritt D., 2000, ApJL, 539, L9
- Fujita & Nagashima (1999) Fujita Y., Nagashima M., 1999, ApJ, 516, 619
- Gabor & Davé (2012) Gabor J. M., Davé R., 2012, MNRAS, 427, 1816
- Gallazzi et al. (2006) Gallazzi A., Charlot S., Brinchmann J., White S. D. M., 2006, MNRAS, 370, 1106
- Gallazzi et al. (2005) Gallazzi A., Charlot S., Brinchmann J., White S. D. M., Tremonti C. A., 2005, MNRAS, 362, 41
- Gaspari et al. (2012) Gaspari M., Brighenti F., Temi P., 2012, MNRAS, 424, 190
- Gebhardt et al. (2000) Gebhardt K., Bender R., Bower G., Dressler A., Faber S. M., Filippenko A. V., Green R., Grillmair C., Ho L. C., Kormendy J., Lauer T. R., Magorrian J., Pinkney J., Richstone D., Tremaine S., 2000, ApJL, 539, L13
- Genzel et al. (2001) Genzel R., Tacconi L. J., Rigopoulou D., Lutz D., Tecza M., 2001, ApJ, 563, 527
- Goto (2005) Goto T., 2005, MNRAS, 357, 937
- Goto (2007a) Goto T., 2007a, MNRAS, 381, 187
- Goto (2007b) Goto T., 2007b, MNRAS, 377, 1222
- Governato et al. (2009) Governato F., Brook C. B., Brooks A. M., Mayer L., Willman B., Jonsson P., Stilp A. M., Pope L., Christensen C., Wadsley J., Quinn T., 2009, MNRAS, 398, 312
- Governato et al. (2007) Governato F., Willman B., Mayer L., Brooks A., Stinson G., Valenzuela O., Wadsley J., Quinn T., 2007, MNRAS, 374, 1479
- Granato et al. (2004) Granato G. L., De Zotti G., Silva L., Bressan A., Danese L., 2004, ApJ, 600, 580
- Graves et al. (2009) Graves G. J., Faber S. M., Schiavon R. P., 2009, ApJ, 698, 1590
- Greene et al. (2012) Greene J. E., Murphy J. D., Comerford J. M., Gebhardt K., Adams J. J., 2012, ApJ, 750, 32
- Gunn & Gott (1972) Gunn J. E., Gott J. R. I., 1972, ApJ, 176, 1
- Győry & Bell (2010) Győry Z., Bell E. F., 2010, ApJ, 724, 694
- Hernquist (1993) Hernquist L., 1993, ApJ, 409, 548
- Hernquist et al. (1993) Hernquist L., Spergel D. N., Heyl J. S., 1993, ApJ, 416, 415
- Hibbard & van Gorkom (1996) Hibbard J. E., van Gorkom J. H., 1996, AJ, 111, 655
- Hogg et al. (2002) Hogg D. W., Blanton M., Strateva I., Bahcall N. A., Brinkmann J., Csabai I., Doi M., Fukugita M., Hennessy G., Ivezić Ž., Knapp G. R., Lamb D. Q., Lupton R., Munn J. A., Nichol R., Schlegel D. J., Schneider D. P., York D. G., 2002, AJ, 124, 646
- Holden et al. (2012) Holden B. P., van der Wel A., Rix H.-W., Franx M., 2012, ApJ, 749, 96
- Hopkins et al. (2010) Hopkins P. F., Bundy K., Hernquist L., Wuyts S., Cox T. J., 2010, MNRAS, 401, 1099
- Hopkins et al. (2008) Hopkins P. F., Cox T. J., Kereš D., Hernquist L., 2008, ApJS, 175, 390
- Hopkins et al. (2009) Hopkins P. F., Cox T. J., Younger J. D., Hernquist L., 2009, ApJ, 691, 1168
- Hopkins & Elvis (2010) Hopkins P. F., Elvis M., 2010, MNRAS, 401, 7
- Hopkins & Hernquist (2006) Hopkins P. F., Hernquist L., 2006, ApJS, 166, 1
- Hopkins et al. (2005) Hopkins P. F., Hernquist L., Cox T. J., Di Matteo T., Martini P., Robertson B., Springel V., 2005, ApJ, 630, 705
- Hopkins et al. (2006) Hopkins P. F., Hernquist L., Cox T. J., Di Matteo T., Robertson B., Springel V., 2006, ApJS, 163, 1
- Hopkins et al. (2008) Hopkins P. F., Hernquist L., Cox T. J., Kereš D., 2008, ApJS, 175, 356
- Johansson et al. (2009) Johansson P. H., Naab T., Burkert A., 2009, ApJ, 690, 802
- Kannappan et al. (2009) Kannappan S. J., Guie J. M., Baker A. J., 2009, AJ, 138, 579
- Kartaltepe et al. (2014) Kartaltepe J. S., Mozena M., Kocevski D., McIntosh D. H., Lotz J., Bell E. F., Faber S., Ferguson H., Koo D., et al. 2014, ArXiv e-prints
- Kauffmann et al. (2003) Kauffmann G., Heckman T. M., Tremonti C., Brinchmann J., Charlot S., White S. D. M., Ridgway S. E., Brinkmann J., Fukugita M., Hall P. B., Ivezić Ž., Richards G. T., Schneider D. P., 2003, MNRAS, 346, 1055
- Kauffmann et al. (2003) Kauffmann G., Heckman T. M., White S. D. M., Charlot S., Tremonti C., Peng E. W., Seibert M., Brinkmann J., Nichol R. C., SubbaRao M., York D., 2003, MNRAS, 341, 54
- Kauffmann et al. (1993) Kauffmann G., White S. D. M., Guiderdoni B., 1993, MNRAS, 264, 201
- Kaviraj (2010) Kaviraj S., 2010, MNRAS, 408, 170
- Kaviraj et al. (2009) Kaviraj S., Devriendt J. E. G., Ferreras I., Yi S. K., Silk J., 2009, A&A, 503, 445
- Kaviraj et al. (2007) Kaviraj S., Kirkby L. A., Silk J., Sarzi M., 2007, MNRAS, 382, 960
- Kaviraj et al. (2007) Kaviraj S., Schawinski K., Devriendt J. E. G., Ferreras I., Khochfar S., Yoon S.-J., Yi S. K., et al. 2007, ApJS, 173, 619
- Kaviraj et al. (2011) Kaviraj S., Schawinski K., Silk J., Shabala S. S., 2011, MNRAS, 415, 3798
- Kawata & Mulchaey (2008) Kawata D., Mulchaey J. S., 2008, ApJL, 672, L103
- Kehrig et al. (2012) Kehrig C., Monreal-Ibero A., Papaderos P., Vílchez J. M., Gomes J. M., Masegosa J., Sánchez S. F., et al. 2012, A&A, 540, A11
- Kereš et al. (2005) Kereš D., Katz N., Weinberg D. H., Davé R., 2005, MNRAS, 363, 2
- Kereš et al. (2012) Kereš D., Vogelsberger M., Sijacki D., Springel V., Hernquist L., 2012, MNRAS, 425, 2027
- Kewley et al. (2001) Kewley L. J., Dopita M. A., Sutherland R. S., Heisler C. A., Trevena J., 2001, ApJ, 556, 121
- Kewley et al. (2006) Kewley L. J., Geller M. J., Barton E. J., 2006, AJ, 131, 2004
- Khalatyan et al. (2008) Khalatyan A., Cattaneo A., Schramm M., Gottlöber S., Steinmetz M., Wisotzki L., 2008, MNRAS, 387, 13
- Kormendy & Bender (1996) Kormendy J., Bender R., 1996, ApJL, 464, L119+
- Kormendy & Kennicutt (2004) Kormendy J., Kennicutt R. C., 2004, ARA&A, 42, 603
- Kroupa (2001) Kroupa P., 2001, MNRAS, 322, 231
- Labbé et al. (2005) Labbé I., Huang J., Franx M., Rudnick G., Barmby P., Daddi E., van Dokkum P. G., Fazio G. G., Schreiber N. M. F., Moorwood A. F. M., Rix H.-W., Röttgering H., Trujillo I., van der Werf P., 2005, ApJL, 624, L81
- Larson et al. (1980) Larson R. B., Tinsley B. M., Caldwell C. N., 1980, ApJ, 237, 692
- Lewis et al. (2002) Lewis I., Balogh M., De Propris R., Couch W., Bower R., Offer A., et al. 2002, MNRAS, 334, 673
- Lintott et al. (2011) Lintott C., Schawinski K., Bamford S., Slosar A., Land K., Thomas D., Edmondson E., Masters K., Nichol R. C., Raddick M. J., Szalay A., Andreescu D., Murray P., Vandenberg J., 2011, MNRAS, 410, 166
- Lotz et al. (2008) Lotz J. M., Jonsson P., Cox T. J., Primack J. R., 2008, MNRAS, 391, 1137
- Lotz et al. (2010a) Lotz J. M., Jonsson P., Cox T. J., Primack J. R., 2010a, MNRAS, 404, 590
- Lotz et al. (2010b) Lotz J. M., Jonsson P., Cox T. J., Primack J. R., 2010b, MNRAS, 404, 575
- MacArthur et al. (2003) MacArthur L. A., Courteau S., Holtzman J. A., 2003, ApJ, 582, 689
- Maller et al. (2009) Maller A. H., Berlind A. A., Blanton M. R., Hogg D. W., 2009, ApJ, 691, 394
- Martig et al. (2009) Martig M., Bournaud F., Teyssier R., Dekel A., 2009, ApJ, 707, 250
- Martig et al. (2013) Martig M., Crocker A. F., Bournaud F., Emsellem E., Gabor J. M., et al. 2013, MNRAS, 432, 1914
- Martin (2005) Martin C. L., 2005, ApJ, 621, 227
- Martin et al. (2007) Martin D. C., Wyder T. K., Schiminovich D., Barlow T. A., Forster K., Friedman P. G., Morrissey P., Neff S. G., Seibert M., Small T., Welsh B. Y., Bianchi L., Donas J., Heckman T. M., Lee Y.-W., Madore B. F., Milliard B., Rich R. M., Szalay A. S., Yi S. K., 2007, ApJS, 173, 342
- Martini (2004) Martini P., 2004, Coevolution of Black Holes and Galaxies, p. 169
- Masters et al. (2011) Masters K. L., Nichol R. C., Hoyle B., Lintott C., Bamford S. P., Edmondson E. M., Fortson L., Keel W. C., Schawinski K., Smith A. M., Thomas D., 2011, MNRAS, 411, 2026
- McIntosh et al. (2008) McIntosh D. H., Guo Y., Hertzberg J., Katz N., Mo H. J., van den Bosch F. C., Yang X., 2008, MNRAS, 388, 1537
- McIntosh et al. (2004) McIntosh D. H., Rix H.-W., Caldwell N., 2004, ApJ, 610, 161
- Mendel et al. (2013) Mendel J. T., Simard L., Ellison S. L., Patton D. R., 2013, MNRAS, 429, 2212
- Mihos & Hernquist (1994) Mihos J. C., Hernquist L., 1994, ApJL, 431, L9
- Mihos & Hernquist (1996) Mihos J. C., Hernquist L., 1996, ApJ, 464, 641
- Moore et al. (1999) Moore B., Lake G., Quinn T., Stadel J., 1999, MNRAS, 304, 465
- Müller-Sánchez et al. (2011) Müller-Sánchez F., Prieto M. A., Hicks E. K. S., Vives-Arias H., Davies R. I., Malkan M., Tacconi L. J., Genzel R., 2011, ApJ, 739, 69
- Muzzin et al. (2013) Muzzin A., Marchesini D., Stefanon M., Franx M., Milvang-Jensen B., Dunlop J. S., Fynbo J. P. U., Brammer G., Labbé I., van Dokkum P., 2013, ApJS, 206, 8
- Naab & Burkert (2003) Naab T., Burkert A., 2003, ApJ, 597, 893
- Naab et al. (1999) Naab T., Burkert A., Hernquist L., 1999, ApJL, 523, L133
- Naab et al. (2006) Naab T., Jesseit R., Burkert A., 2006, MNRAS, 372, 839
- Naab et al. (2009) Naab T., Johansson P. H., Ostriker J. P., 2009, ApJL, 699, L178
- Naab et al. (2007) Naab T., Johansson P. H., Ostriker J. P., Efstathiou G., 2007, ApJ, 658, 710
- Nelson et al. (2013) Nelson D., Vogelsberger M., Genel S., Sijacki D., Kereš D., Springel V., Hernquist L., 2013, MNRAS, 429, 3353
- Norman et al. (1996) Norman C. A., Sellwood J. A., Hasan H., 1996, ApJ, 462, 114
- Oser et al. (2012) Oser L., Naab T., Ostriker J. P., Johansson P. H., 2012, ApJ, 744, 63
- Oser et al. (2010) Oser L., Ostriker J. P., Naab T., Johansson P. H., Burkert A., 2010, ApJ, 725, 2312
- Pasquali et al. (2009) Pasquali A., van den Bosch F. C., Mo H. J., Yang X., Somerville R., 2009, MNRAS, 394, 38
- Patel et al. (2012) Patel S. G., Holden B. P., Kelson D. D., Franx M., van der Wel A., Illingworth G. D., 2012, ApJL, 748, L27
- Peek & Graves (2010) Peek J. E. G., Graves G. J., 2010, ApJ, 719, 415
- Pogge et al. (2000) Pogge R. W., Maoz D., Ho L. C., Eracleous M., 2000, ApJ, 532, 323
- Postman & Geller (1984) Postman M., Geller M. J., 1984, ApJ, 281, 95
- Quilis et al. (2000) Quilis V., Moore B., Bower R., 2000, Science, 288, 1617
- Quintero et al. (2004) Quintero A. D., Hogg D. W., Blanton M. R., Schlegel D. J., Eisenstein D. J., Gunn J. E., Brinkmann J., Fukugita M., Glazebrook K., Goto T., 2004, ApJ, 602, 190
- Rees & Ostriker (1977) Rees M. J., Ostriker J. P., 1977, MNRAS, 179, 541
- Riffel et al. (2009) Riffel R. A., Storchi-Bergmann T., Dors O. L., Winge C., 2009, MNRAS, 393, 783
- Robaina et al. (2009) Robaina A. R., Bell E. F., Skelton R. E., McIntosh D. H., Somerville R. S., Zheng X., Rix H., et al. 2009, ApJ, 704, 324
- Robaina et al. (2010) Robaina A. R., Bell E. F., van der Wel A., Somerville R. S., Skelton R. E., McIntosh D. H., Meisenheimer K., Wolf C., 2010, ApJ, 719, 844
- Robertson et al. (2006) Robertson B., Bullock J. S., Cox T. J., Di Matteo T., Hernquist L., Springel V., Yoshida N., 2006, ApJ, 645, 986
- Rothberg & Joseph (2004) Rothberg B., Joseph R. D., 2004, AJ, 128, 2098
- Rupke et al. (2010) Rupke D. S. N., Kewley L. J., Barnes J. E., 2010, ApJL, 710, L156
- Salim et al. (2012) Salim S., Fang J. J., Rich R. M., Faber S. M., Thilker D. A., 2012, ApJ, 755, 105
- Sánchez-Blázquez et al. (2009) Sánchez-Blázquez P., Gibson B. K., Kawata D., Cardiel N., Balcells M., 2009, MNRAS, 400, 1264
- Sanders et al. (1988) Sanders D. B., Soifer B. T., Elias J. H., Madore B. F., Matthews K., Neugebauer G., Scoville N. Z., 1988, ApJ, 325, 74
- Sazonov et al. (2005) Sazonov S. Y., Ostriker J. P., Ciotti L., Sunyaev R. A., 2005, MNRAS, 358, 168
- Schawinski et al. (2010) Schawinski K., Dowlin N., Thomas D., Urry C. M., Edmondson E., 2010, ApJL, 714, L108
- Schawinski et al. (2007) Schawinski K., Kaviraj S., Khochfar S., Yoon S.-J., Yi S. K., Deharveng J.-M., et al. 2007, ApJS, 173, 512
- Schawinski et al. (2009) Schawinski K., Lintott C., Thomas D., Sarzi M., Andreescu D., Bamford S. P., Kaviraj S., Khochfar S., Land K., Murray P., Nichol R. C., Raddick M. J., Slosar A., Szalay A., Vandenberg J., Yi S. K., 2009, MNRAS, 396, 818
- Schawinski et al. (2007) Schawinski K., Thomas D., Sarzi M., Maraston C., Kaviraj S., Joo S.-J., Yi S. K., Silk J., 2007, MNRAS, 382, 1415
- Schawinski et al. (2010) Schawinski K., Urry C. M., Virani S., Coppi P., Bamford S. P., Treister E., et al. 2010, ApJ, 711, 284
- Schlegel et al. (1998) Schlegel D. J., Finkbeiner D. P., Davis M., 1998, ApJ, 500, 525
- Schweizer & Seitzer (1992) Schweizer F., Seitzer P., 1992, AJ, 104, 1039
- Serra & Trager (2007) Serra P., Trager S. C., 2007, MNRAS, 374, 769
- Shapiro et al. (2010) Shapiro K. L., Falcón-Barroso J., van de Ven G., de Zeeuw P. T., Sarzi M., et al. 2010, MNRAS, 402, 2140
- Shen et al. (2003) Shen S., Mo H. J., White S. D. M., Blanton M. R., Kauffmann G., Voges W., Brinkmann J., Csabai I., 2003, MNRAS, 343, 978
- Shlosman et al. (1989) Shlosman I., Frank J., Begelman M. C., 1989, Nature, 338, 45
- Sijacki & Springel (2006) Sijacki D., Springel V., 2006, MNRAS, 366, 397
- Simha et al. (2009) Simha V., Weinberg D. H., Davé R., Gnedin O. Y., Katz N., Kereš D., 2009, MNRAS, 399, 650
- Skelton et al. (2009) Skelton R. E., Bell E. F., Somerville R. S., 2009, ApJL, 699, L9
- Snyder et al. (2011) Snyder G. F., Cox T. J., Hayward C. C., Hernquist L., Jonsson P., 2011, ApJ, 741, 77
- Spitzer & Baade (1951) Spitzer L. J., Baade W., 1951, ApJ, 113, 413
- Springel et al. (2005) Springel V., Di Matteo T., Hernquist L., 2005, ApJL, 620, L79
- Springel & Hernquist (2003) Springel V., Hernquist L., 2003, MNRAS, 339, 289
- Springel & Hernquist (2005) Springel V., Hernquist L., 2005, ApJL, 622, L9
- Stasińska et al. (2008) Stasińska G., Vale Asari N., Cid Fernandes R., Gomes J. M., Schlickmann M., Mateus A., Schoenell W., Sodré Jr. L., Seagal Collaboration 2008, MNRAS, 391, L29
- Steinmetz & Navarro (2002) Steinmetz M., Navarro J. F., 2002, New Astronomy, 7, 155
- Strateva et al. (2001) Strateva I., Ivezić Ž., Knapp G. R., Narayanan V. K., Strauss M. A., Gunn J. E., Lupton R. H., Schlegel D., et al. 2001, AJ, 122, 1861
- Strauss et al. (2002) Strauss M. A., Weinberg D. H., Lupton R. H., Narayanan V. K., Annis J., Bernardi M., Blanton M., Burles S., Connolly A. J., Dalcanton J., Doi M., Eisenstein D., Frieman J. A., Fukugita M., et al. 2002, AJ, 124, 1810
- Tal et al. (2009) Tal T., van Dokkum P. G., Nelan J., Bezanson R., 2009, AJ, 138, 1417
- Taylor (2005) Taylor M. B., 2005, in Shopbell P., Britton M., Ebert R., eds, Astronomical Data Analysis Software and Systems XIV Vol. 347 of Astronomical Society of the Pacific Conference Series, TOPCAT STIL: Starlink Table/VOTable Processing Software. p. 29
- Thomas et al. (2010) Thomas D., Maraston C., Schawinski K., Sarzi M., Silk J., 2010, MNRAS, 404, 1775
- Toomre (1977) Toomre A., 1977, in Evolution of Galaxies and Stellar Populations Mergers and Some Consequences. pp 401–+
- Toomre & Toomre (1972) Toomre A., Toomre J., 1972, ApJ, 178, 623
- Torrey et al. (2012) Torrey P., Cox T. J., Kewley L., Hernquist L., 2012, ApJ, 746, 108
- Trager et al. (2000) Trager S. C., Faber S. M., Worthey G., González J. J., 2000, AJ, 119, 1645
- Trager & Somerville (2009) Trager S. C., Somerville R. S., 2009, MNRAS, 395, 608
- Tremonti et al. (2007) Tremonti C. A., Moustakas J., Diamond-Stanic A. M., 2007, ApJL, 663, L77
- van den Bosch et al. (2008) van den Bosch F. C., Aquino D., Yang X., Mo H. J., Pasquali A., McIntosh D. H., Weinmann S. M., Kang X., 2008, MNRAS, 387, 79
- van der Wel et al. (2008) van der Wel A., Holden B. P., Zirm A. W., Franx M., Rettura A., Illingworth G. D., Ford H. C., 2008, ApJ, 688, 48
- van der Wel et al. (2009) van der Wel A., Rix H., Holden B. P., Bell E. F., Robaina A. R., 2009, ApJL, 706, L120
- Wetzel et al. (2013) Wetzel A. R., Tinker J. L., Conroy C., van den Bosch F. C., 2013, MNRAS
- Whitaker et al. (2012) Whitaker K. E., Kriek M., van Dokkum P. G., Bezanson R., Brammer G., Franx M., Labbé I., 2012, ApJ, 745, 179
- Whitaker et al. (2011) Whitaker K. E., Labbé I., van Dokkum P. G., Brammer G., Kriek M., Marchesini D., Quadri R. F., Franx M., Muzzin A., Williams R. J., Bezanson R., Illingworth G. D., Lee K.-S., Lundgren B., Nelson E. J., Rudnick G., Tal T., Wake D. A., 2011, ApJ, 735, 86
- White et al. (2007) White M., Zheng Z., Brown M. J. I., Dey A., Jannuzi B. T., 2007, ApJL, 655, L69
- White & Rees (1978) White S. D. M., Rees M. J., 1978, MNRAS, 183, 341
- Williams et al. (2009) Williams R. J., Quadri R. F., Franx M., van Dokkum P., Labbé I., 2009, ApJ, 691, 1879
- Willmer et al. (2006) Willmer C. N. A., Faber S. M., Koo D. C., Weiner B. J., Newman J. A., Coil A. L., Connolly A. J., Conroy C., Cooper M. C., Davis M., et al. 2006, ApJ, 647, 853
- Wilman et al. (2009) Wilman D. J., Oemler Jr. A., Mulchaey J. S., McGee S. L., Balogh M. L., Bower R. G., 2009, ApJ, 692, 298
- Wong et al. (2012) Wong O. I., Schawinski K., Kaviraj S., Masters K. L., Nichol R. C., Lintott C., Keel W. C., Darg D., Bamford S. P., Andreescu D., Murray P., Raddick M. J., Szalay A., Thomas D., Vandenberg J., 2012, MNRAS, 420, 1684
- Worthey (1994) Worthey G., 1994, ApJS, 95, 107
- Wuyts et al. (2011) Wuyts S., Förster Schreiber N. M., van der Wel A., Magnelli B., Guo Y., Genzel R., Lutz D., et al. 2011, ApJ, 742, 96
- Wuyts et al. (2009) Wuyts S., Franx M., Cox T. J., Förster Schreiber N. M., Hayward C. C., Hernquist L., Hopkins P. F., Labbé I., Marchesini D., Robertson B. E., Toft S., van Dokkum P. G., 2009, ApJ, 700, 799
- Wuyts et al. (2007) Wuyts S., Labbé I., Franx M., Rudnick G., van Dokkum P. G., Fazio G. G., Förster Schreiber N. M., Huang J., Moorwood A. F. M., Rix H.-W., Röttgering H., van der Werf P., 2007, ApJ, 655, 51
- Yan & Blanton (2012) Yan R., Blanton M. R., 2012, ApJ, 747, 61
- Yan et al. (2006) Yan R., Newman J. A., Faber S. M., Konidaris N., Koo D., Davis M., 2006, ApJ, 648, 281
- Yang et al. (2005) Yang X., Mo H. J., van den Bosch F. C., Jing Y. P., 2005, MNRAS, 356, 1293
- Yang et al. (2007) Yang X., Mo H. J., van den Bosch F. C., Pasquali A., Li C., Barden M., 2007, ApJ, 671, 153
- Yang et al. (2006) Yang Y., Tremonti C. A., Zabludoff A. I., Zaritsky D., 2006, ApJL, 646, L33
- Yang et al. (2004) Yang Y., Zabludoff A. I., Zaritsky D., Lauer T. R., Mihos J. C., 2004, ApJ, 607, 258
- Yang et al. (2008) Yang Y., Zabludoff A. I., Zaritsky D., Mihos J. C., 2008, ApJ, 688, 945
- Yi et al. (2005) Yi S. K., Yoon S.-J., Kaviraj S., Deharveng J.-M., Rich R. M., Salim S., et al. 2005, ApJL, 619, L111
- York et al. (2000) York D. G., Adelman J., Anderson J. E., Anderson S. F., Annis J., Bahcall N. A., Bakken J. A., Barkhouser R., Bastian S., Berman E., et al. 2000, AJ, 120, 1579
- Zabludoff & Mulchaey (1998) Zabludoff A. I., Mulchaey J. S., 1998, ApJ, 496, 39
- Zabludoff et al. (1996) Zabludoff A. I., Zaritsky D., Lin H., Tucker D., Hashimoto Y., Shectman S. A., Oemler A., Kirshner R. P., 1996, ApJ, 466, 104
- Zhu et al. (2010) Zhu G., Blanton M. R., Moustakas J., 2010, ApJ, 722, 491