A Thorough Investigation of Distance and Age of the Pulsar Wind Nebula 3C 58
Abstract
Context. A growing number of researchers present evidence that the pulsar wind nebula 3C 58 is much older than predicted by its proposed connection to the historical supernova of A.D. 1181. There is also a great diversity of arguments. The strongest of these arguments rely heavily on the assumed distance of 3.2 kpc determined with H i absorption measurements.
Aims. This publication aims at determining a more accurate distance for 3C 58 and re-evaluating the arguments for a larger age.
Methods. I have re-visited the distance determination of 3C 58 based on new H i data from the Canadian Galactic Plane Survey and our recent improvements in the knowledge of the rotation curve of the outer Milky Way Galaxy. I have also used newly determined distances to objects in the neighbourhood, which are based on direct measurements by trigonometric parallax.
Results. I have derived a new more reliable distance estimate of 2 kpc for 3C 58. This makes the connection between the pulsar wind nebula and the historical event from A.D. 1181 once again much more viable.
Key Words.:
ISM: individual (3C 58), ISM: supernova remnants, pulsars: individual (J 0205+6449)1 Introduction
Of all the supernova remnants (SNRs) that are linked to historically observed supernova events the most disputed one is probably the connection between the pulsar wind nebula (PWN) 3C 58 and the supernova explosion observed in A.D. 1181 by Chinese and Japanese astronomers. Stephenson (1971) and Stephenson & Green (2002) claim that there is a high probability for a connection between the Guest Star from A.D. 1181 and the supernova explosion that created 3C 58. The length of the visibility of the Guest Star and the similarity in the description in independent sources indicate a supernova explosion. The lack of any other supernova remnant candidate in the area strongly supports the identification of 3C 58 with this historical supernova explosion. Although it is difficult to escape this argument, strong evidence against such a young age for 3C 58 has been mounting with a great diversity of support from expansion studies, theoretical modeling of the evolutionary path, and comparisons of the pulsar’s and the pulsar wind nebula’s characteristics to other SNRs and PWNe of known age (for a list of the main arguments see e.g. Fesen et al., 2008, Table 3).
Many of the strong arguments against a young age for 3C 58 rely heavily on the assumed distance of 3.2 kpc (Roberts et al., 1993). This distance was determined kinematically from H i absorption measurements by comparing the resulting systemic velocity for 3C 58 with a flat rotation curve for the Outer Galaxy. For Perseus arm objects in particular this can lead to a significant overestimate of the distance. A spiral shock in the Perseus arm is “pushing” objects, including H ii regions, SNRs, and PWNe towards the Galactic centre, giving them – from our point of view – a higher negative radial velocity, which makes them appear to be farther away than they actually are (Roberts, 1972). Examples of this effect on distance estimates of SNRs and PWNe can be found, e.g. in Kothes et al. (2002, 2003) and Foster et al. (2004) and most recently in Kothes & Foster (2012). SNRs and PWNe in particular rely heavily on kinematic distance determinations, since their distances cannot easily be determined directly or by relating them to embedded stars as in the case for H ii regions.
In this paper I discuss a new distance estimate for 3C 58. Based on this newly determined distance I will re-evaluate evidence presented in the literature against the historical connection between 3C 58 and the Guest Star of A.D. 1181. I will show that the new distance changes some of the PWN’s characteristics quite dramatically. This leads once more to a higher probability for its historical connection. I will describe the H i observations of the Canadian Galactic Plane Survey in Section 2. H i emission around 3C 58, its newly determined H i absorption characteristics, and the resulting systemic velocity are discussed in Section 3 and a thorough evaluation of the distance is presented in Section 4. In section 5 I will re-visit all arguments contra and pro a young age, develop a model in Section 6 for the evolution of 3C 58 that explains all observations, and give a short summary in Section 7. Preliminary results of this project were published in Kothes (2010).
2 Observations
The data for this new H i absorption study towards 3C 58 were obtained with the Synthesis Telescope at the Dominion Radio Astrophysical Observatory (DRAO, Landecker et al., 2000) as part of the Canadian Galactic Plane Survey (CGPS, Taylor et al., 2003). Single antenna data were incorporated into the interferometer maps after suitable filtering in the Fourier domain. This assures the accurate representation of atomic hydrogen emission from the largest structures down to the resolution limit of about 1′. The low spatial frequency data were drawn from the Low-Resolution DRAO Survey (LRDS) of the CGPS region, which was observed with the 26-m radio telescope at DRAO (Higgs & Tapping, 2000). The resolution in the final data sets varies slightly across the images as about . At the centre of 3C 58 the resolution of the CGPS H i data is at an angle of for the major axis (counter-clockwise from the Galactic longitude axis). The RMS noise is about 3 K in each velocity channel of width 0.82446 km s-1. The frequency band used for the CGPS H i observations is 1 MHz wide, which gives a velocity coverage of about 210 km s-1 at a velocity resolution of 1.3 km s-1. In this area of the Milky Way Galaxy the CGPS H i data are centred at a radial velocity of km s-1 relative to the local standard of rest.
3 Results
3.1 H i Absorption Towards 3C 58
The first attempt to derive an H i absorption distance to 3C 58 was carried out by Williams (1973), who found absorption at negative velocities down to km s-1, which was translated to a distance of 8.2 kpc. However, those observations were obtained with a single-dish telescope and the “off position” to determine the background H i emission for the absorption profile was taken away from the centre of 3C 58. Green & Gull (1982) who did the first absorption study towards 3C 58 with an interferometer argue that most of the absorption components at high negative velocities in the work of Williams (1973) are artificial due to the highly structured interstellar medium. They found no absorption beyond km s-1 and determined a systemic velocity of about km s-1, which they translated with a Schmidt rotation model (Schmidt, 1965) for our Galaxy to a distance of 2.6 kpc. The latest distance determination for 3C 58 by H i absorption measurements resulted in a systemic velocity of km s-1 and a Perseus arm location (Roberts et al., 1993). This was translated with a flat rotation model for our Galaxy and the IAU supported values for the Sun’s Galacto-centric distance of kpc and the Sun’s circular motion around the Galactic centre of km s-1 to a distance of 3.2 kpc.
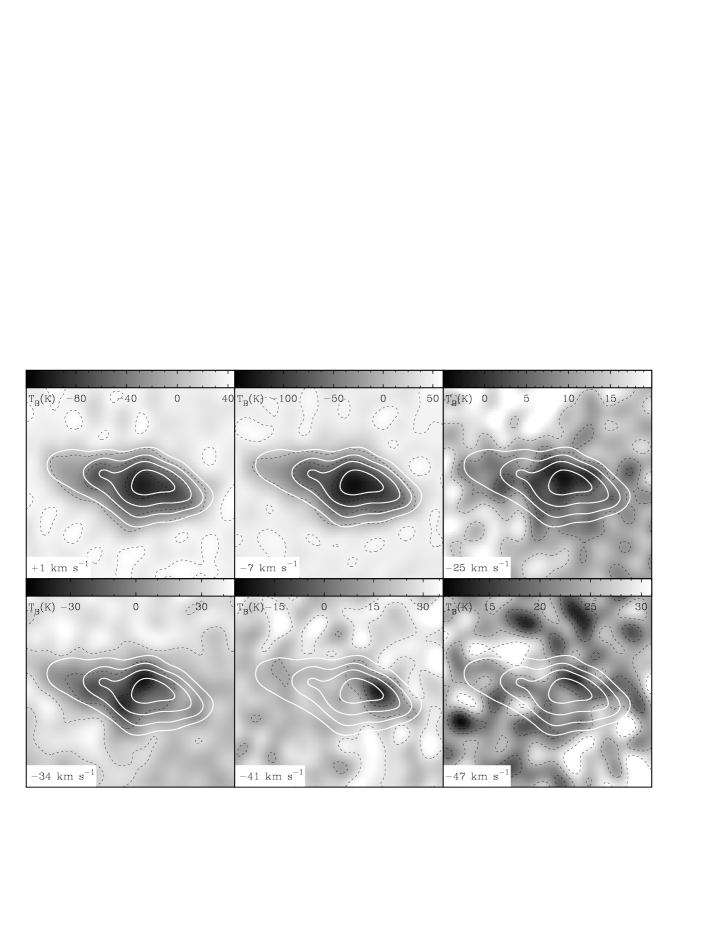
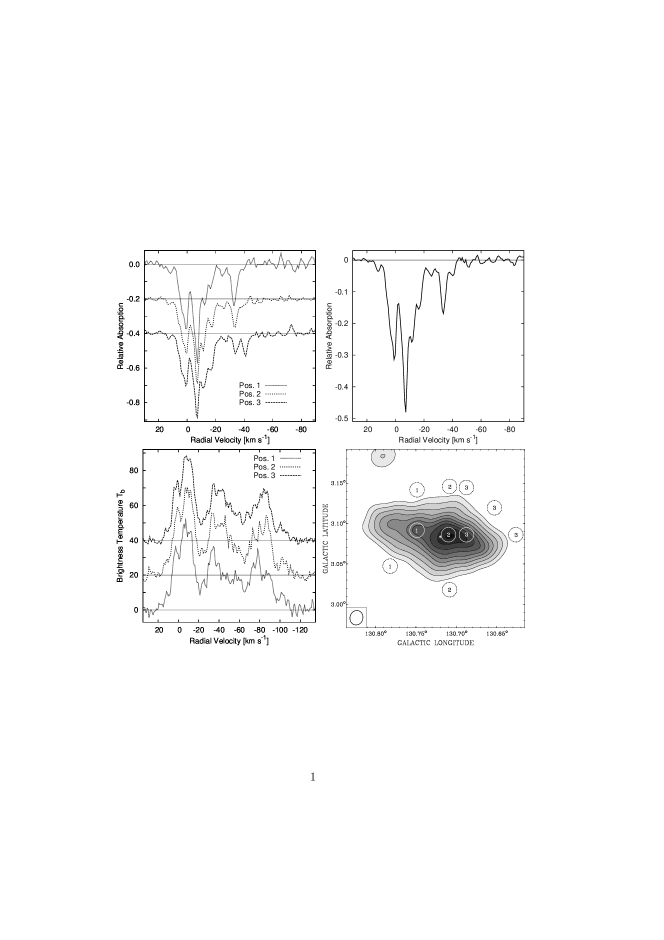
I used the H i data of the CGPS to conduct a new H i absorption study towards 3C 58 to investigate not only the integrated absorption spectrum, but also any possible significant changes over the PWN: if absorbing clouds are small then the absorption by those clouds may be washed out in an integrated profile. This could cause the loss of important information about the velocity range in which 3C 58 is absorbed. In Fig. 1 I show three absorption profiles towards individual positions on 3C 58. To calculate the displayed spectra I subtracted the averaged emission profiles as indicated on the map in the lower right panel of Fig. 1. For the integrated absorption profile I averaged over all pixels on 3C 58 that display a surface brightness in excess of 100 K in the 1420 MHz continuum maps of the CGPS. Each pixel was weighted by its brightness above the background. For the background emission profile the average over all locations marked in Fig. 1 was calculated. The resulting profiles are shown in Fig. 1. H i channel maps taken at the major peaks of the integrated absorption spectrum are displayed in Fig. 2. These peaks can be found at and km s-1 which represents local gas, at km s-1 representing the Perseus spiral arm and for a small area in the right part of 3C 58 at km s-1. In addition I added two maps averaged over 10 velocity channels in the inter-arm area between the Local and the Perseus arm and 10 velocity channels just beyond the last visible absorption component at km s-1.
The integrated absorption spectrum is almost identical to the one published by Roberts et al. (1993). Every peak and wiggle is perfectly reproduced, which is not surprising since 3C 58 is a very bright source. At the local velocities and in the inter-arm area between the Local arm and Perseus arm the absorption looks quite constant over the PWN. However, I found that the weak peak, seen as a faint wiggle at around km s-1 is actually a real absorption feature. It is not seen over the entire PWN, but only on the right hand side at position 3 (see Figs. 1 and 2). This is likely the reason why this feature was not obvious in previously published integrated absorption spectra. The Perseus arm absorption component around km s-1 seems to be confined to the left hand side of the PWN and is absent from the lower right. The reason for this is probably the structured interstellar medium. In the local medium clouds have a bigger angular size than in the Perseus arm simply because they are much closer. Hence the absorbing clouds in the Perseus arm show structure on smaller angular scale.
3.2 H i Emission Around 3C 58
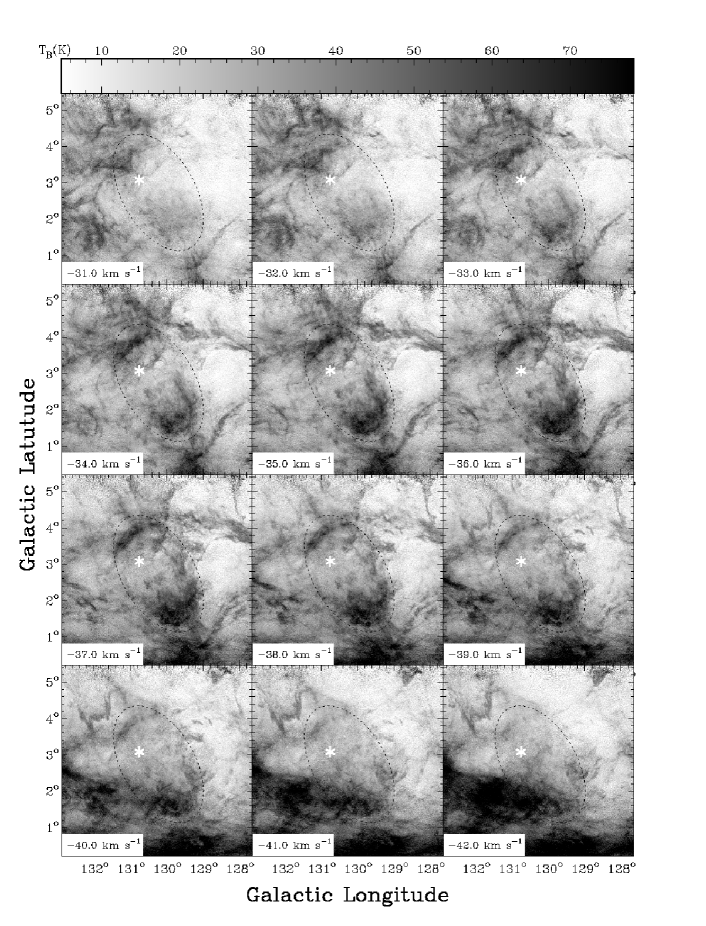
Wallace et al. (1994) discussed the possible association of 3C 58 with a large bi-polar interstellar bubble which they detected in low resolution H i data. An inspection of the CGPS H i data sets reveals that this double-shell structure is actually a relatively smooth object (see Fig. 3). This bubble is visible from about to km s-1 and its structure is essentially unchanging over that entire velocity range. No caps are obvious in emission, neither at more nor at less negative velocities. The systemic velocity of this structure is about km s-1. It seems to appear at about to km s-1 without any dynamical connection to all the other filaments that are visible in this velocity range and disappears the same way at about to km s-1. The fact that this bubble seems to be stationary through many velocity channels and does not show any cap moving towards or away from us does not contradict its interpretation as an expanding bubble. Cazzolato & Pineault (2005) simulated H i observations of expanding stellar wind bubbles and found that this is not unexpected. Stationary rings or shells and weak or undetectable caps are the result of velocity dispersion. A very nice example for an actual observation of such a structure is the stellar wind bubble around the SNR 3C434.1, where the receding cap is seen absorbing warm background H i emission (Foster et al., 2004).
3C 58 can be found projected onto the top left area of this bubble. If 3C 58 was located inside this structure, the last absorption feature at about km s-1 must be produced by the cap of this bubble which is expanding towards us. After correction for the off-centre position of 3C 58 this would result in an expansion velocity of 6 to 7 km s-1 for the bubble.
3.3 The Systemic Velocity of 3C 58
Roberts et al. (1993) found a systemic velocity of about km s-1 (LSR = Local Standard of Rest), which they translated to a distance of 3.2 kpc, in the Perseus arm. This systemic velocity was confirmed with the discovery of the large bubble by Wallace et al. (1994). The CGPS H i absorption profile (Fig. 1) shows an additional absorption feature at about km s-1 and a systemic velocity of about km s-1 for the bubble. There is no absorption at velocities beyond km s-1. In Fig. 2 the map averaged around km s-1, representative of the inter-arm between the Local arm and the Perseus arm shows significant absorption. However, the map averaged over velocities beyond km s-1 is free of absorption even though this velocity range should represent a location inside a spiral arm with denser gas than the inter-arm around km s-1. This confirms the Perseus arm location of 3C 58. 3C 58 is most likely located inside the bubble shown in Fig. 3 and the last absorption feature, which is only partly visible in the absorption profile of 3C 58 is a part of that bubble moving towards us. The emission profiles show bright emission peaks for all major absorption components indicating that those are major parts of the ISM. The only exception is the absorption feature at km s-1, which has no obvious related emission component. There is some enhanced H i emission around km s-1 in off-positions 2 and 3 (see Fig. 1), but only the absorption profile in position 3 shows absorption. This indicates that this absorption feature must be caused by a small localized cloud, which is not part of the grand kinematic scheme of the Galaxy.
This would, however, be typical for the broken cap of an expanding bubble, which are very difficult to detect due to velocity dispersion (Cazzolato & Pineault, 2005). However, such a cap could reveal itself in absorption in particular with a bright background source like 3C 58. Kothes & Kerton (2002) show many examples of expanding H i shells around compact H ii regions which are revealed by H i absorption of the H ii region’s radio continuum emission by the approaching shell.
Based on these results I will adopt a systemic velocity of about km s-1 for 3C 58, which is consistent with earlier estimates. This is independent of whether 3C 58 is located inside the bubble or not, because the absorption feature at km s-1 represents the absorption by a small cloud that would not be taken into account for the determination of a systemic velocity. And the last absorption feature, related to a major structure of the ISM, seen in bright supernova remnants is typically very close to the actual systemic velocity of these objects (e.g. Kothes et al., 2003).
4 The Distance to 3C 58
The method of Foster & MacWilliams (2006) was used to determine a new distance-velocity relation in the direction of 3C 58 (Fig. 4). This is a kinematic-based distance tool, which accounts for not only circular motion of the Galaxy as in a flat rotation curve model, but also for radial motions produced by spiral shocks. To determine the distance to 3C 58, H i profiles were obtained from a CGPS mosaic. This mosaic was first processed by a new cloud filtering technique described in Foster & Cooper (2010), which produces a datacube of the smooth intercloud medium by removing unwanted small clouds that may not follow large-scale Galactic dynamics.

To produce the distance-velocity relation displayed in Fig. 4, H i profiles along ten separate lines of sight (LOS) around 3C 58 and a location in the midplane at the same longitude were fitted independently. For the systemic velocity of 3C 58, between and km s-1, the only possible location is at the velocity discontinuity produced by the Perseus arm spiral shock at 2 kpc. The distance to the spiral shock varies only slightly between the different lines of sight, resulting in a very small uncertainty. This leads to a distance of kpc for 3C 58.
There is a second independent method to determine a distance to 3C 58: relate the PWN to a nearby object or nearby objects which themselves have an independent or a more reliable distance estimate. The W 3/4/5 H ii region complex and the related SNR HB 3 are just a few degrees away from 3C 58. Both, HB 3 and W 3/4/5, have very similar systemic velocities (e.g. Routledge et al., 1991), indicating that they are all located in Perseus spiral arm. The distances to HB 3, W 5, and the nearby H ii region Sh 2-190 were also determined by Foster & MacWilliams (2006) with the same method used here for 3C 58. For all three objects the distance was found to be kpc. This is consistent with our current result. The descrepancy in the results and errors is likely due to the application of the cloud filter in our study, which significantly reduces the uncertainties caused by small-scale clouds.
For W 3 the distance was independently determined with trigonometric parallax to related masers to be kpc and kpc by Xu et al. (2006) and Hachisuka et al. (2006), respectively. This very nicely confirms the 2 kpc I estimated for 3C 58 from the systemic velocity of its host stellar wind bubble.
I believe there is compelling evidence for a location of 3C 58 in the Perseus arm spiral shock and from now on I will assume that 3C 58 is located at a distance kpc.
4.1 The Progenitor of 3C 58
Interstellar material is compressed in the spiral shock, forms molecules, and later stars. The shock provides the perfect environment for the formation of massive stars that later explode as a supernova like the progenitor star of 3C 58. It takes a long time for those stars – some years – to migrate to a position beyond the Perseus arm spiral shock (e.g. Arvidsson et al., 2009; Kothes & Foster, 2012, for similar calculations). At a distance of 2 kpc the average radius of the bubble would be about 35 pc. With an average expansion velocity of 6.5 km s-1 this results in a dynamic age of yr for a pure stellar wind bubble produced by a single star (Weaver et al., 1977). Considering the age of this bubble the location of 3C 58, about away from the geometric centre, requires a velocity of about 5 to 6 km s-1 perpendicular to the line of sight for the progenitor star, which is certainly not unusual.
From the age of the stellar wind bubble we can determine approximately the type of the progenitor star assuming that it alone was responsible for the bubble’s formation. A lifetime of yr would point to a late O-type star with an initial mass between 20 and 30 M⊙.
5 The Age of 3C 58
There is a large number of arguments against and only very few for a connection between the PWN 3C 58 and the historical supernova explosion from A.D. 1181. A quite comprehensive list can be found in Fesen et al. (2008, Table 3). The discussion in the literature of the age of 3C 58 has been based on an assumed distance of 3.2 kpc. I will discuss and re-evaluate all of the arguments, pro and contra a young age based on the newly determined distance of 2 kpc. The results of the discussion below are summarized in Table 1. In the end I will try to create a compelling picture that explains the results of all observations and theoretical models.
5.1 The Guest Star from A.D. 1181
The strongest arguments for the connection between 3C 58 and the Guest Star of A.D. 1181 remain those by Stephenson (1971) and Stephenson & Green (2002). The length of the visibility of the Guest Star and the similarity of the description in the four independent Chinese and Japanese sources indicate that this Guest star was the result of a supernova explosion. The lack of any other supernova remnant candidate for the event other than 3C 58 strongly supports the identification of 3C 58 with the supernova remnant, in particular, since such a recent event should leave an easily detectable remnant behind. The connection of 3C 58 with the Guest Star of A.D. 1181 implies an age of about 830 yr.
5.1.1 Supernova Peak Brightness
According to Stephenson & Green (2002) the supernova had at its peak a visual apparent brightness of about 0 magnitudes, maybe somewhat brighter. This would translate to an absolute brightness between -13.4 and -14.3 mag, using the range of possible values for visual extinction (Shibanov et al., 2008, 1.9 to 2.8,) and the newly determined distance of 2 kpc. This is a very low brightness even if we assume an additional uncertainty of mag.
However, other low luminosity supernova explosions have been observed before. Spiro & Pastorello (2009) have reviewed the literature about underluminous type II-P supernovae and reach the conclusion that those are a quite homogenous group of supernovae with low peak luminosities, red colours, slow moving ejecta, and small ejected 56Ni mass. However, the presence of the stellar wind bubble around 3C 58 indicates that the progenitor star produced a strong stellar wind implying a supernova of type Ib or Ic, or at least a type IIL or IIb supernova since the progenitor must have lost a significant amount of material through that wind, unless the bubble is unrelated to 3C 58, in which case it could have been a member of the underluminous type II-P group.
There have been observations of supernovae of type IIL and IIb which showed a low visual peak brightness. A good example is SN1987a, which was a faint type IIb supernova explosion with an absolute visual brightness of -15.5 mag at its peak (Arnett et al., 1989, and references therein). The mass of the progenitor star of SN1987a would be in approximate agreement with the progenitor mass proposed for 3C 58 through the age of the stellar wind bubble (Arnett et al., 1989, and references therein). However, even SN1987a was still more than 1 mag brighter at its peak than the predicted maximum brightness for 3C 58. And to the best of my knowledge there has not been a core-collapse supernova, other than a type IIP, observed with a visual peak brightness comparable to the value predicted for 3C 58. The low absolute visual brightness at peak is still problematic. It is possible that one of the main reasons for this low brightness is a low explosion energy, and that may explain why we still do not see the radio remnant of the supernova explosion. Other possible reasons are small ejected 56Ni masses (Spiro & Pastorello, 2009) and a small radius of the progenitor star, which would lead to a longer period with large diffusion time scales. During this period the expanding star will lose heat by adiabatic expansion. The latter reason was proposed for the low luminosity of SN1987a (Arnett et al., 1989).
5.2 Spin Down Age, Neutron Star Cooling, and Other Pulsar-Related Arguments
5.2.1 Spin Down Age
Murray et al. (2002) found a pulsar spin down age, also called the characteristic age, of yr for J 0205+6449, the pulsar inside 3C 58 (, : pulsar period). However, a large discrepancy between the characteristic age and the real age is not unusual for young pulsars, and Murray et al. (2002) point out that their result is not in disagreement with the connection to the supernova of A.D. 1181. The characteristic age is only a good estimate of the real age if the intrinsic period is significantly shorter than the current period. There are many other examples of pulsars with a characteristic age significantly larger than their actual age. One extreme example would be the SNR G11.20.3 which is linked to a historically observed supernova explosion from 386 A.D. (Stephenson & Green, 2002) and hosts the pulsar J18111925. This pulsar is a little over 1600 yr old and has a characteristic age of 23,300 yr (Torii et al., 1999). The radio pulsar wind nebula in G11.20.3 is much fainter than 3C 58 (Kothes & Reich, 2001), which probably can be explained by the much lower energy loss rate resulting from a weaker magnetic field at birth.
5.2.2 Neutron Star Cooling
Slane et al. (2002) fitted neutron star cooling models to CHANDRA X-ray observations of J 0205+6449 and calculated strong upper limits for the thermal emission originating from the surface of the neutron star in 3C 58. These fall far below predictions for standard neutron star cooling. However, this does not necessarily imply a larger age for the pulsar in 3C 58 but it implies the presence of exotic cooling processes no matter whether we assume an age of 830 yr or any other age proposed for 3C 58 in the literature. The minimum age for 3C 58 if cooling were to follow standard models is about 25,000 yr (see Fig. 4 in Slane et al., 2002), far beyond any age that has been proposed for 3C 58. Exotic cooling processes must be in operation in this pulsar, and this result does not favour any of the proposed ages.
5.2.3 Glitches
Livingstone et al. (2009) found two large spin up glitches in a long-term timing analysis of the pulsar in 3C 58. They point out that such glitches are more typical for pulsars with characteristic ages between 5 and 10 kyr, but suggest that glitches could be related to the surface temperature of the neutron star rather than the actual age, and we have just noted (Section 5.2.2) that the pulsar in 3C 58 has a very unusually low surface temperature.
5.2.4 Pulsar Proper Motion
Gotthelf et al. (2007) found a circular thermal X-ray shell surrounding the pulsar inside 3C 58 from XMM-Newton observations. However, the pulsar is offset by from the centroid of this shell. If 3C 58 is the result of the 1181 supernova explosion the pulsar requires a velocity of 500 km s-1 (300 km s-1) perpendicular to the line of sight to reach its current position assuming that it was born at the very centre of this spherical shell and that its distance is 3.2 kpc (2.0 kpc). Gotthelf et al. (2007) argue that if the pulsar in 3C 58 had the same transverse velocity as the Crab pulsar ( km s-1) it must be much older than the event from A.D. 1181.
Hobbs et al. (2005) have made a statistical analysis of pulsar proper motions; the proper motion of pulsar J 0205+6449 inside 3C 58 is close to the average of their sample. The average for normal pulsars is about 246 km s-1, for pulsars in SNRs 227 km s-1, and for pulsars with a characteristic age below yr 310 km s-1. Hence, the pulsars’s predicted proper motion at a distance of 2 kpc supports its connection with the supernova of A.D. 1181.
5.2.5 Other Pulsar Characteristics
Shearer & Neustroev (2008) say that the low optical efficiency of the emission and the low radio to X-ray luminosity ratio observed from the pulsar inside 3C 58 indicate a low age, when compared with other pulsars detected at optical wavelength. Abdo et al. (2009) point out that the ratio between X-ray and -ray luminosity of that pulsar is more similar to the middle aged Vela pulsar than the young Crab pulsar and B1509-58. Kuiper et al. (2010) say that the spectral properties of PSR J0205+6449 inside 3C 58 confirm that we are dealing with a young pulsar, and suggest a real age between those of Vela and PSR B1509-58, favouring its characteristic age of 5.4 kyr over the connection to SN 1181. However, these emission characteristics cannot be taken as a means to determine the age of the pulsar, quite simply because we have no information about the pulsar’s emission characteristics from the time it was born.
5.3 PWN Evolution and Energetics
Chevalier (2004) discussed evolutionary models of the expansion of the 3C 58 pulsar wind nebula into the expanding ejecta of a supernova explosion. He assumed a power law density distribution for the ejecta into which the PWN is expanding and that the ejecta is swept up into a thin spherically symmetric shell. He finds for the ejecta mass:
| (1) |
and for the swept-up mass:
| (2) |
Here, is the energy loss rate of the pulsar in erg s-1, the explosion energy in erg, the PWN radius in pc, and the age of the PWN in yr.
For the explosion energy I assume the canonical value of erg and for the average energy loss rate of the pulsar since birth of erg s-1, assuming an age of 830 yr. The lower and upper limits (in brackets) represent maximum and minimum coupling between the pulsar wind bubble and the swept up material, respectively (Chevalier, 2004). In Chevalier (2004) the theoretical results for swept up and ejecta mass and internal energy are compared with those from observations. All of these results rely heavily on the assumed distance.
In the following subsections I apply these equations to various aspects of the 3C 58 situation, and I emphasize the major changes in the interpretation that flow from adopting the distance 2 kpc as opposed to 3.2 kpc.
5.3.1 Ejecta Mass
With equation 1, a distance of 3.2 kpc, and an age of 830 yr the ejecta mass results in 0.1 - 0.2 M⊙ for 3C 58. This changes to 0.3 - 0.6 M⊙ for a distance of 2 kpc. This is still a very low value for a core collapse supernova explosion (Chevalier, 2004). If the explosion energy is much lower than the canonical value of erg, which is a possible explanation for the low peak brightness of the supernova explosion (see section 5.1.1), the ejecta mass would be again much lower.
With deep optical observations Fesen et al. (2008) revealed two distinct kinematic populations of expanding optical knots within the boundary of the pulsar wind nebula, the slower population is interpreted as circumstellar mass-loss material from the 3C 58 progenitor and the higher velocity population as expanding supernova ejecta forming a thick shell. This indicates that the density distribution the PWN is expanding into is not well represented by a power law and the ejecta is not entirely swept up into a thin shell. In addition Fesen et al. (2008) reported that the distribution of the ejecta in their observations is not spherically symmetric but exhibits a strong bipolar expansion pattern. Therefore the theoretical estimate of the ejecta mass becomes very uncertain.
5.3.2 Swept Up Mass
Bocchino et al. (2001) determined from their X-ray observations a swept-up mass for the expanding PWN of M⊙, assuming a radius of , which results in 0.1 M⊙ for a distance of 3.2 kpc.
We can calculate the ratio between the mass of observed and theoretical (Equation 2) swept up material to be: . Hence, for an age of 830 yr and the distance of 3.2 kpc the observed swept up mass is about 10-20 times higher than the theoretical one. Even with the relatively high uncertainty of this kind of calculation the large discrepancy suggests a much larger age for 3C 58. For a distance of 2 kpc this ratio decreases to 0.9 - 1.7 so that the two results for the swept-up mass now agree within the uncertainties. According to Chevalier (2004) the theoretical estimate of the swept up mass does not rely strongly on the distribution of the ejecta. This is easily understandable since in principle the equation calculates the mass that could have been swept up based on the available energy. To extrapolate the total amount of ejecta from this of course relies heavily on the assumed distribution of the ejecta material and makes the theoretical estimate of the ejecta mass very uncertain.
The strong dependence of the theoretically calculated swept-up mass on the age now actually pretty much negates an age significantly larger than 830 yr. For an age of 1500 yr the ratio between observed and theoretically calculated swept up mass decreases to 0.1 - 0.2, which despite the uncertainties in theoretical estimates of that kind makes an age significantly higher than 830 yr very unlikely.
5.3.3 Energy
Another argument of Chevalier (2004) against an age of 830 yr is that the minimum energy required to produce the observed synchrotron emission is higher than the total energy released by the pulsar. is about erg assuming equipartition between the energy in the magnetic field and the relativistic particles with (Chevalier, 2004). The total energy released by the pulsar into the nebula, however, can be approximated by (Chevalier, 2004) assuming yr. is distance independent. We can calculate this value a little more accurately by integrating the equation for the evolution of the energy loss rate, , of a pulsar over its lifetime. is defined by (e.g. Pacini & Salvati, 1973):
| (3) |
Here is related to the nature of the braking torque (, and is the braking index of the pulsar), is the real age of the pulsar, is its energy loss rate at the time it was born, and is its intrinsic characteristic age. Integrating equation 3 over the lifetime of 3C 58 assuming an age of 830 yr and a dipolar magnetic field results in erg. This is still significantly lower than . However, for a distance of 2 kpc decreases to erg, which is now much lower than the total energy released by the pulsar, which remains unchanged.
5.3.4 MHD simulations
van der Swaluw (2003) performed MHD simulations of a magnetized pulsar wind interacting with either a uniform interstellar medium or freely expanding ejecta. For 3C 58 he found that the observed radio expansion velocity does not agree with the radius and the age implied by the connection with the supernova of A.D. 1181. van der Swaluw (2003) suggest that there are two ways out of this. One would be a much larger age. The second possibility is that 3C 58 is being compressed by a reverse shock. According to van der Swaluw (2003) this would not only explain the decrease in expansion velocity, but also the radio flux density increase of 3C 58 (Green, 1987), a very low cooling break, and it would decrease the wind termination shock. The ratio between the wind termination shock and the PWN radius is remarkably small in 3C 58 (Frail & Moffett, 1993). The question remains, why do we not detect a radio bright shell corresponding to the blast-wave of the supernova if indeed the PWN is compressed by a reverse shock? And why don’t we detect thermal X-ray emission from the entire ejecta mass?
5.4 Expansion Studies

A supernova explosion is a one-time event. For any expansion study of a supernova remnant observed features related to this event could have been decelerated since the time of the explosion but not accelerated. This may not be true for synchrotron emitting filaments related to a pulsar wind nebula, because those have a continuous source of energy in the central pulsar. Hence, the interpretation of expansion studies of synchrotron filaments inside a pulsar wind nebula is not straightforward.
A comparison of the two major expansion studies in optical (Fesen et al., 2008, age yr) and radio (Bietenholz, 2006, yr) already implies significant deceleration for the synchrotron filaments relative to the optically observed knots unless the energy released by the pulsar significantly accelerated all the supernova ejecta. In this context – given the age approximations of the two expansion studies – significantly means that more than 80 % of the kinetic energy of the optical knots must have been provided by the pulsar. A comparison of the typical explosion energy of erg released in a supernova with the approximate energy released by the pulsar since birth of erg (see above) negates that possibility entirely. Hence, we can assume that the low expansion velocity observed for the radio synchrotron filaments is the result of significant deceleration.
Most of the optical filaments are created by material accelerated through the supernova explosion. Because those filaments could have been decelerated but not accelerated’ a simple averaging of the expansion velocity of all the filaments would not necessarily lead to a good age estimate unless the scatter is entirely produced by uncertainties in the observations or systematic errors, which is certainly not the case in the careful study of Fesen et al. (2008). The fastest filament should be taken, since it presumably shows the lowest deceleration. Or better in this case would be the “youngest” filament which is the filament that indicates the lowest age by simply dividing its distance from the pulsar by its velocity. There is quite a wide spread in velocity in the optical study by Fesen et al. (2008), even among those knots that are, according to that study, related to the explosion and not to the circumstellar material ejected by the progenitor star’s wind. This again indicates that a lot of the emitting material must have been decelerated. Therefore the assumption of insignificant deceleration for the optical knots is invalid as well. This weakens the case for a large age based on the optical and radio expansion studies.
In Fig. 5 I display a diagram of the optical knots constructed from the data by Fesen et al. (2008). The absolute radial velocity is plotted as a function of radius from the central pulsar. This radius was calculated assuming that 3C 58 is 2 kpc away from the sun. Since the optical knots can have been decelerated but not accelerated any valid expansion law for the PWN has to encompass all of these knots.
In Fig. 5 I also display several possible expansion laws. For all a spherical geometry has been adopted. Assuming a connection to the supernova from 1181 A.D. the resulting best fitting functions to encompass all expanding knots do not seem to fit very well. Free expansion leads to a velocity-radius ratio which is too high and for the Sedov solution this ratio is too low. The best fit expansion law indicated by the solid line represents either free expansion for an age of about 1600 yr or Sedov expansion for an age of about 630 yr. Sedov expansion would result in about 0.012 for the ratio of explosion energy ( erg) and the ambient density (cm-3), which implies either a very high ambient density of a very low explosion energy.
Free expansion gives only an upper limit for the age in any case since we neglect any kind of deceleration and the Sedov age can only be a lower limit, since the ejecta mass is neglected. Therefore the age of 3C 58 must be between 630 and 1600 yr. We must be in the transition between free and Sedov expansion where neither law is sufficiently accurate to describe the expansion. The large spread in radial velocities for the optical knots indicates a lower rather than a larger age, since it indicates that a lot of the ejecta must have been decelerated already. But in principle the results support any age between 630 and 1600 yr. More accurate calculations are unfortunately not possible since we lack information about the total mass of the supernova ejecta and the explosion energy.
5.5 Radio Flux Evolution
A very strong argument for a young age is the fact that the radio flux density of 3C 58 at 408 MHz increased between 1967 and 1986 at a rate of % yr-1 (Green, 1987). This is not an insignificant amount considering that the pulsar has been pumping energy into the nebula since its birth and at a decreasing rate. The radio synchrotron emission of 3C 58 depends on the energy released by the pulsar into the nebula. Increasing radio flux implies that the energy in magnetic field and relativistic particles is still being generated by the pulsar faster than it is being radiated away by the nebula.
Although it is not easy to directly link the radio synchrotron emission to the total amount of energy in the nebula by a simple equation, we can find an estimate for the age by assuming equipartition between relativistic particles and magnetic field. In this case we find that the flux density depends on the minimum energy : .

A flux density increase of % yr-1 implies an energy increase between about 0.11 and 0.26 % yr-1. With equation 3 this results in an age range between 350 and 810 yr (for the time range discussed in Green, 1987), assuming no energy loss and a dipolar magnetic field for the pulsar. Constant or increasing energy loss would decrease that age range. In Fig. 6 I displayed the rate of radio flux density increase of 3C 58 over the last few hundred years predicted for different possible ages for 3C 58 assuming negligible energy loss. Only a current age of 830 yr would be located within the error bars observed by Green (1987). However, even for 830 yr the presence of an additional energy source is more likely. This additional energy source could be the reverse shock produced by the interaction of the supernova shock-wave with circumstellar material, which would be required according to the MHD simulations of van der Swaluw (2003) (see also Section 5.3.4) to explain the observations. For any larger age the presence of a significant reverse shock would be essential. This would imply the remnant has already entered Sedov phase, which implies significant deceleration, which would indicate that the ages derived from expansion studies are significant overestimates. A connection to the supernova of 1181 A.D. is the only possibility to make all the observations consistent.
Method 830 yr 1500 yr yr Section A.D. 1181 Gueststar 5.1 Peak Brigthness of SN 1181 5.1.1 yr 5.2.1 NS Cooling 5.2.2 Glitches 5.2.1 Proper Motion 5.2.3 Ejecta Mass 5.3.1 Swept Up Mass 5.3.2 Energetics 5.3.3 MHD Simulations 5.3.4 Radio Expansion 5.4 Optical Expansion 5.4 Radio Flux Evolution 5.5
6 The Story 3C 58, a Proposal
The progenitor star of 3C 58 must have been a massive star, which was of late O-type during its Main Sequence phase. Its strong stellar wind carved out the large stellar wind bubble we find in H i. The dynamic age of that bubble of about yr indicates a mass between 20 and 30 M⊙ for the progenitor star when it was formed, assuming the bubble was blown by that single star. In its late evolutionary phase this star must have been a red giant, supergiant star or even a blue super giant similar to the progenitor of SN1987a, as indicated by the production of a massive low velocity wind which is implied by the slowly expanding optical knots found by Fesen et al. (2008). When the star exploded it left the neutron star that powers 3C 58 behind and the shock-wave of the explosion expanded into the very low density interior of the stellar wind bubble which was partly filled with high density clouds expelled by the progenitor star in its wind before it exploded. Consequently, the early expansion of the supernova shock wave has to be treated as expanding into a cloudy instead of a homogeneous medium. This explains the not limb-brightened partly centrally peaked thermal X-ray emission which was observed by Gotthelf et al. (2007, their Fig. 8, right panel) and the lack of non-thermal radio emission related to the supernova remnant (not the PWN) (e.g. White & Long, 1991). The low brightness of the supernova explosion at the peak of its light curve can be explained by a low explosion energy, small mass of ejected 56Ni, a small progenitor radius, or various other situations. The interaction with the circumstellar material is sapping the shock wave of its energy and generates reverse shocks moving back into the interior. These are decelerating the ejecta, creating the large velocity spread inside a thick shell. This reverse shock is also decelerating and compressing the PWN thereby increasing its energy. This explains the continuous significant increase of radio flux from the PWN.
Although the new distance estimate explains many of the unusual characteristics found for 3C 58 a few problems still remain:
-
•
Why did the supernova explosion that created 3C 58 have such a low peak brightness?
-
•
Where is the radio remnant of the supernova explosion?
-
•
Why is the extrapolated mass of the ejecta so low?
-
•
Why does the neutron star display such a low surface temperature?
7 Summary
I have derived a new more reliable distance of 2 kpc to the PWN 3C 58, by means of H i absorption in combination with a newly determined distance-velocity relation and by relating this PWN to a nearby H ii region and SNR complex of well known distance. This new distance changes many characteristics of this PWN quite dramatically. The new results point once again to the historical connection of 3C 58, because only an age of 830 yr makes most of the observations and theoretical calculations consistent.
Acknowledgements.
I would like to thank Tyler Foster for providing me with a distance-velocity diagram in the direction of 3C 58 using his modeling technique of the Galactic hydrogen distribution. I would also like to thank Tom Landecker for careful reading of this manuscript. The Dominion Radio Astrophysical Observatory is a National Facility operated by the National Research Council of Canada. The Canadian Galactic Plane Survey is a Canadian project with international partners, and is supported by the Natural Sciences and Engineering Research Council (NSERC).References
- Abdo et al. (2009) Abdo, A. A., Ackermann, M., Ajello, M., et al. 2009, ApJ, 699, L102
- Arnett et al. (1989) Arnett, W. D., Bahcall, J. N., Kirshner, R. P., & Woosley, S. E. 1989, ARA&A, 27, 629
- Arvidsson et al. (2009) Arvidsson, K., Kerton, C. R., & Foster, T. 2009, ApJ, 700, 1000
- Bietenholz (2006) Bietenholz, M. F. 2006, ApJ, 645, 1180
- Bocchino et al. (2001) Bocchino, F., Warwick, R. S., Marty, P., et al. 2001, A&A, 369, 1078
- Cazzolato & Pineault (2005) Cazzolato, F. & Pineault, S. 2005, AJ, 129, 2731
- Chevalier (2004) Chevalier, R. A. 2004, Advances in Space Research, 33, 456
- Fesen et al. (2008) Fesen, R., Rudie, G., Hurford, A., & Soto, A. 2008, ApJS, 174, 379
- Foster & Cooper (2010) Foster, T. & Cooper, B. 2010, in Astronomical Society of the Pacific Conference Series, Vol. 438, Astronomical Society of the Pacific Conference Series, ed. R. Kothes, T. L. Landecker, & A. G. Willis, 16–+
- Foster & MacWilliams (2006) Foster, T. & MacWilliams, J. 2006, ApJ, 644, 214
- Foster et al. (2004) Foster, T., Routledge, D., & Kothes, R. 2004, A&A, 417, 79
- Frail & Moffett (1993) Frail, D. A. & Moffett, D. A. 1993, ApJ, 408, 637
- Gotthelf et al. (2007) Gotthelf, E. V., Helfand, D. J., & Newburgh, L. 2007, ApJ, 654, 267
- Green (1987) Green, D. A. 1987, MNRAS, 225, 11P
- Green & Gull (1982) Green, D. A. & Gull, S. F. 1982, Nature, 299, 606
- Hachisuka et al. (2006) Hachisuka, K., Brunthaler, A., Menten, K. M., et al. 2006, ApJ, 645, 337
- Higgs & Tapping (2000) Higgs, L. A. & Tapping, K. F. 2000, AJ, 120, 2471
- Hobbs et al. (2005) Hobbs, G., Lorimer, D. R., Lyne, A. G., & Kramer, M. 2005, MNRAS, 360, 974
- Kothes (2010) Kothes, R. 2010, in Astronomical Society of the Pacific Conference Series, Vol. 438, Astronomical Society of the Pacific Conference Series, ed. R. Kothes, T. L. Landecker, & A. G. Willis, 347
- Kothes & Foster (2012) Kothes, R. & Foster, T. 2012, ApJ, 746, L4
- Kothes & Kerton (2002) Kothes, R. & Kerton, C. R. 2002, A&A, 390, 337
- Kothes & Reich (2001) Kothes, R. & Reich, W. 2001, A&A, 372, 627
- Kothes et al. (2003) Kothes, R., Reich, W., Foster, T., & Byun, D.-Y. 2003, ApJ, 588, 852
- Kothes et al. (2002) Kothes, R., Uyaniker, B., & Yar, A. 2002, ApJ, 576, 169
- Kuiper et al. (2010) Kuiper, L., Hermsen, W., Urama, J. O., et al. 2010, A&A, 515, A34+
- Landecker et al. (2000) Landecker, T. L., Dewdney, P. E., Burgess, T. A., et al. 2000, A&AS, 145, 509
- Livingstone et al. (2009) Livingstone, M. A., Ransom, S. M., Camilo, F., et al. 2009, ApJ, 706, 1163
- Murray et al. (2002) Murray, S. S., Slane, P. O., Seward, F. D., Ransom, S. M., & Gaensler, B. M. 2002, ApJ, 568, 226
- Pacini & Salvati (1973) Pacini, F. & Salvati, M. 1973, ApJ, 186, 249
- Roberts et al. (1993) Roberts, D. A., Goss, W. M., Kalberla, P. M. W., Herbstmeier, U., & Schwarz, U. J. 1993, A&A, 274, 427
- Roberts (1972) Roberts, Jr., W. W. 1972, ApJ, 173, 259
- Routledge et al. (1991) Routledge, D., Dewdney, P. E., Landecker, T. L., & Vaneldik, J. F. 1991, A&A, 247, 529
- Schmidt (1965) Schmidt, M. 1965, in Galactic Structure, ed. A. Blaauw & M. Schmidt, 513–+
- Sedov (1959) Sedov, L. I. 1959, Similarity and Dimensional Methods in Mechanics (New York: Academic Press)
- Shearer & Neustroev (2008) Shearer, A. & Neustroev, V. V. 2008, MNRAS, 390, 235
- Shibanov et al. (2008) Shibanov, Y. A., Lundqvist, N., Lundqvist, P., Sollerman, J., & Zyuzin, D. 2008, A&A, 486, 273
- Slane et al. (2002) Slane, P. O., Helfand, D. J., & Murray, S. S. 2002, ApJ, 571, L45
- Spiro & Pastorello (2009) Spiro, S. & Pastorello, A. 2009, in American Institute of Physics Conference Series, Vol. 1111, American Institute of Physics Conference Series, ed. G. Giobbi, A. Tornambe, G. Raimondo, M. Limongi, L. A. Antonelli, N. Menci, & E. Brocato, 460–463
- Stephenson (1971) Stephenson, F. R. 1971, QJRAS, 12, 10
- Stephenson & Green (2002) Stephenson, F. R. & Green, D. A. 2002, Historical supernovae and their remnants, by F. Richard Stephenson and David A. Green. International series in astronomy and astrophysics, vol. 5. Oxford: Clarendon Press, 2002, ISBN 0198507666, 5
- Taylor et al. (2003) Taylor, A. R., Gibson, S. J., Peracaula, M., et al. 2003, AJ, 125, 3145
- Torii et al. (1999) Torii, K., Tsunemi, H., Dotani, T., et al. 1999, ApJ, 523, L69
- van der Swaluw (2003) van der Swaluw, E. 2003, A&A, 404, 939
- Wallace et al. (1994) Wallace, B. J., Landecker, T. L., & Taylor, A. R. 1994, A&A, 286, 565
- Weaver et al. (1977) Weaver, R., McCray, R., Castor, J., Shapiro, P., & Moore, R. 1977, ApJ, 218, 377
- White & Long (1991) White, R. L. & Long, K. S. 1991, ApJ, 373, 543
- Williams (1973) Williams, D. R. W. 1973, A&A, 28, 309
- Xu et al. (2006) Xu, Y., Reid, M. J., Zheng, X. W., & Menten, K. M. 2006, Science, 311, 54