Helioseismology from SODISM and HMI Intensity Images
Abstract
Continuum intensity images from PICARD/SODISM and SDO/HMI covering a 209-day period in 2011 are analyzed in order to extract mode parameters for spherical harmonics up to . SODISM helioseismology signal is affected by the low orbit of PICARD and by important gaps and CCD persistence effects. SODISM intensity signal has a lower signal to noise ratio and duty cycle than HMI and less modes were successfully fitted over the same period. A comparison of the rotation profiles obtained from both sets of continuum images shows however that the results remain compatible within one standard deviation of HMI formal errors.
1 Laboratoire Lagrange, UMR7293, Université de Nice Sophia-Antipolis, CNRS, Observatoire de la Côte d’Azur, Bd. de l’Observatoire, 06304 Nice, France
2 CEA/IRFU/Service d’Astrophysique, AIM, CE Saclay, 91191 Gif sur Yvette, France
3 Institut d’Astrophysique Spatiale, CNRS-Université Paris XI, UMR 8617, 91405 Orsay Cedex, France
1 Introduction
One-minute cadence low-resolution images ( pixels of about arc-seconds) recorded by the SODISM telescope (Meftah et al. 2013) on board PICARD satellite (Thuillier et al. 2006) are available for a helioseismology “medium-” program in intensity (Corbard et al. 2008). We first discuss the calibration steps of the raw SODISM data and then we compare the internal rotation rates inferred by inverting the frequency splittings obtained from both SODISM and HMI continuum images (at 535.7 and 617.3 nm respectively) over the same 209-day period in 2011.
2 Characteristics of SODISM signal and data calibration
Three main characteristics of the SODISM signal can be outlined:
- •
-
•
Orbital period around the Earth of about 100 minutes produces aliased peaks in the power spectra of the low-degree p-mode signals.
-
•
Presence of CCD persistence affecting about 10% of the images.
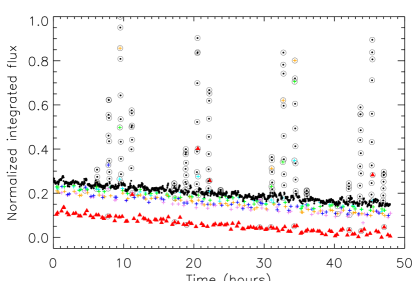
Figure 1 clearly shows that the photometric level at a given minute depends on what was recorded 1-min before (dark current or images at different wavelengths for the astrometric program of PICARD). Different photometric offsets are thus introduced in the helioseismic observations. This is the most problematic source of noise for helioseismic analysis. As its origin is not fully understood yet (see also Hochedez et al. 2013), a posteriori ad hoc correction of the data is performed. The routine interruptions for the astrometric program also create a 2-min aliasing in the power spectrum.
SODISM data calibration for helioseismic analysis must therefore include the following steps: identification of the measurements taken in the SAA through the geo localization of the spacecraft, ad hoc correction of the CCD persistence and high-pass filtering of the light curves by fitting e.g. Legendre polynomials. Finally, gaps smaller than 5 minutes are filled using a linear prediction algorithm, which also helps in reducing the 2-min aliasing.

3 Results and comparison with HMI
The power spectra, mode parameters and internal rotation rates obtained from SODISM images at 535 nm for the 209-day period going from 2011 April 16 to 2011 November 10 were presented in Corbard et al. (2013). Figure 2 further shows an example of rotation-corrected -averaged spectrum. The first spatial leaks are visible with a clear leakage asymmetry. Such asymmetry was already mentioned by Korzennik (1998) in the MDI intensity data but remained unexplained. However, Hill & Howe (1998) discussed that an error in the image radius can lead to a leakage asymmetry around the target mode. A proper understanding of all instrumental effects affecting the geometry of SODISM or HMI images is required to properly build the leakage matrix.
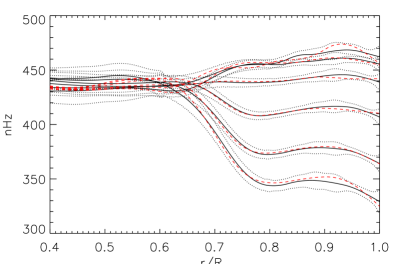
HMI continuum images at 607 nm covering the same 209-day period were first reduced to pixels and then processed through the same pipeline as SODISM images. HMI images are recorded every 45 s with a duty cycle of 98% while SODISM images, recorded every minute, reach only 74 % of duty cycle. The signal-to-noise ratio in the power spectra is clearly better for HMI for which we were able to fit about 100 more modes with (865 modes versus 769 for SODISM). Up to 9 splitting coefficients were fitted for each mode and Fig. 3 shows a comparison of the rotation profiles obtained from both datasets by inverting the frequency splittings. In both cases we used a regularized least square method (Corbard et al. 1997) together with the generalized cross validation criteria of Wahba (1977) for the choice of the regularization parameter. The uncertainties associated to each fitted splitting coefficient are propagated through the inverse process leading to the formal error bars shown on Fig. 3 (dotted lines). The results obtained from the two datasets remain compatible within one sigma for all latitudes and depths. The main differences are found very close to the surface where higher modes would be needed to increase the resolution and at the equator where the local maximum found at from SODISM data (see also Corbard et al. 2013) is less pronounced with HMI.
4 Conclusions
Because of the low orbit of the satellite and the interruptions of the helioseismic sequence for other science objectives, the calibration of SODISM helioseismology data is a difficult task. The first comparison with HMI continuum intensity data shows however that we have reached a first satisfactory level of calibration. In order to fit higher modes, a major issue for both HMI and SODISM is to properly model the leakage matrix. Comparison between the two datasets can help for this and we have now developed a full pipeline that is able to handle intensity images from both instruments.
Acknowledgments
We acknowledge the work of SODISM and HMI instrument teams who provided the data. D. Salabert acknowledges financial support from CNES.
References
- Corbard et al. (1997) Corbard, T., Berthomieu, G., Morel, P., Provost, J., Schou, J., & Tomczyk, S. 1997, A&A, 324, 298
- Corbard et al. (2008) Corbard, T., Boumier, P., Appourchaux, T., Jiménez-Reyes, S. J., Gelly, B., & PICARD Team 2008, Astronomische Nachrichten, 329, 508
- Corbard et al. (2013) Corbard, T., Salabert, D., Boumier, P., Appourchaux, T., Hauchecorne, A., Journoud, P., Nunge, A., Gelly, B., Hochedez, J. F., Irbah, A., Meftah, M., Renaud, C., & Turck-Chièze, S. 2013, Journal of Physics Conference Series, 440, 012025
- Hill & Howe (1998) Hill, F., & Howe, R. 1998, in Structure and Dynamics of the Interior of the Sun and Sun-like Stars, edited by S. Korzennik, vol. 418 of ESA Special Publication, 225
- Hochedez et al. (2013) Hochedez, J.-F., Timmermans, T., Hauchecorne, A., & Meftah, M. 2013, A&A, submitted
- Irbah et al. (2012) Irbah, A., Meftah, M., Hauchecorne, A., Cisse, E. h. M., Lin, M., & Rouzé, M. 2012, in Space Telescopes and Instrumentation 2012: Optical, Infrared, and Millimeter Wave, vol. 8442 of SPIE Conference Series, 84425A
- Korzennik (1998) Korzennik, S. G. 1998, in Structure and Dynamics of the Interior of the Sun and Sun-like Stars, edited by S. Korzennik, vol. 418 of ESA Special Publication, 933
- Meftah et al. (2013) Meftah, M., Hochedez, J.-F., Irbah, A., Hauchecorne, A., Boumier, P., Corbard, T., Turck-Chièze, S., Assus, P., Bertran, E., Bourget, P., Buisson, F., Chaigneau, M., Damé, L., Djafer, D., Dufour, C., Etcheto, P., Ferrero, P., Hersé, M., Marcovici, J.-P., Meissonnier, M., Morand, F., Poiet, G., Prado, J.-Y., Renaud, C., Rouanet, N., Rouzé, M., Salabert, D., & Vieau, A.-J. 2013, Solar Phys., accepted
- Thuillier et al. (2006) Thuillier, G., Dewitte, S., & Schmutz, W. 2006, Advances in Space Research, 38, 1792
- Wahba (1977) Wahba, G. 1977, SIAM J. Numer. Anal., 14, 651