Muon Identification with VERITAS using the Hough Transform
Abstract
Imaging atmospheric Cherenkov telescope (IACT) arrays such as VERITAS are used for ground-based very high-energy gamma-ray astronomy. This is accomplished by the detection and analysis of the Cherenkov light produced by gamma-ray-initiated atmospheric air showers. IACTs also detect the Cherenkov light emitted by individual muons. Identification of these muons is useful because their Cherenkov light can be used to calibrate the telescopes. Muons create characteristic annular patterns in the cameras of IACTs, which may be identified using parametrization algorithms. One such algorithm, the Hough transform, has been successfully used to identify muons in VERITAS data. Details of this technique are presented here, including results regarding its effectiveness.
1 VERITAS
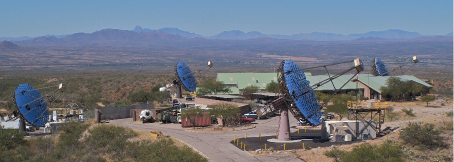
VERITAS (shown in figure 1) is an array of four 12m imaging atmospheric Cherenkov telescopes (IACTs) located at the base of Mount Hopkins in southern Arizona. Very high energy gamma rays interact with nuclei in the atmosphere, producing extensive air showers. The particles in the air showers move faster than the speed of light in air, emitting Cherenkov light. This light is collected and focused with large segmented reflectors onto arrays of light sensitive photomultiplier tubes (PMTs) called cameras. The PMTs produce signals that are proportional to the amount of light detected. These signals are converted into digital information, providing images of the air showers. The directions of the incident gamma rays are determined by the geometry of the images. The energies of the gamma rays are related to the geometry of the images and the amount of light detected [1]. In order to measure the energies of the incident gamma rays, the intensity of the signals recorded must be related to the amount of light detected. This relationship is a poorly constrained parameter in the energy calibration of IACTs. Muons can be used as calibrated light sources to better determine this relationship [2].
2 Muons
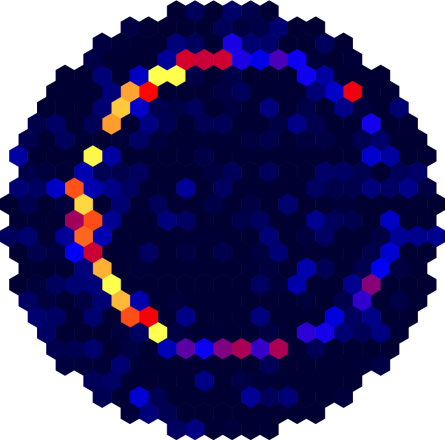
Figure courtesy of S. Fegan & V. Vassiliev.
Muons emit Cherenkov light in a cone at a nearly constant angle as they propagate through the lower atmosphere. This creates annular patterns in IACT cameras, with radii determined by the Cherenkov angles of the muons [2]. Muons propagating parallel to the optical axis (on-axis muons) that hit the center of the reflector (impact parameter ) appear as complete rings with azimuthally symmetric light distributions in the cameras. On-axis muons with but less than the radius of the reflector appear as complete rings with azimuthally dependent light distributions in the cameras as shown in figures 2 and 3. Distant on-axis muons with appear as incomplete rings (arcs) in the cameras. Muons propagating at angles not parallel to the optical axis appear as rings or arcs with centers offset from the center of the cameras. The amount of light produced by muons with known Cherenkov angles and impact parameters is well understood. Therefore muons can be used to calibrate the energy measurements of the telescopes. Since muons produce characteristic patterns, these images can be parametrized using feature finding algorithms such as the Hough transform.
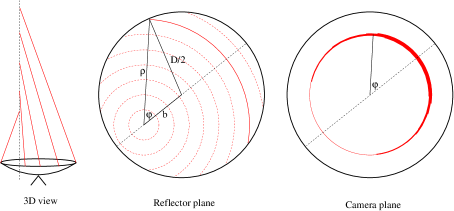
Figure courtesy of S. Fegan & V. Vassiliev.
3 Hough transform
The Hough transform is an algorithm used for parametrizing assumed shapes (in this case, circles) in digital images. This algorithm converts the problem of iteratively fitting a circle in image space into a problem of finding the best parameters for a circle in a parameter space. Each parameter must have a limited range and resolution defined by the user. Therefore, each pixel in a digital image is intersected by a finite number of circular parametrizations. Each of the circles describes a point in a 3D parameter space , where is the center of the circle and is the radius [3]. The Hough transform employs a histogram called an accumulator array to accumulate votes in the parameter space. This is accomplished by adding the intensity values of each pixel in the image to the bins of the accumulator array that correspond to the circles that pass through those pixels. Once the accumulator array has been filled, the best circular parametrization of the image corresponds to the coordinates of the bin with the highest number of votes [3]. A lookup table was constructed consisting of lists of circular parametrizations associated with each pixel of the VERITAS cameras. This was accomplished by determining which pixels were intersected by various circular parametrizations. The locations of the centers of each PMT in the VERITAS cameras were used as the location of the centers of the circles, and the radii of the circles consisted of values from 3 PMT diameters to 11 PMT diameters, incremented by a third of a PMT diameter. This choice of parametrizations resulted in 12475 distinct circles being used to generate the lookup table. This lookup table was used to perform the Hough transform on VERITAS events.
4 Muon identification parameters
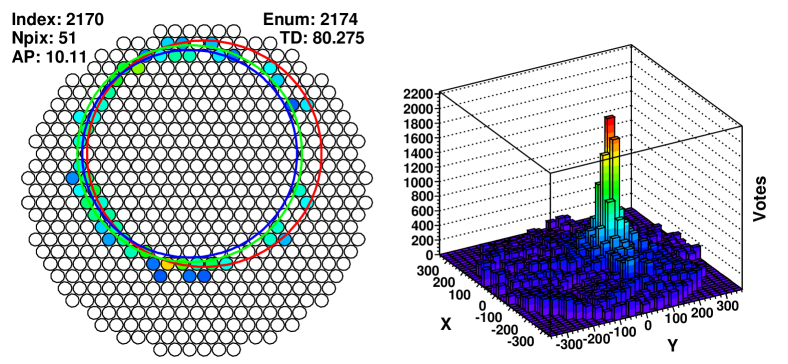
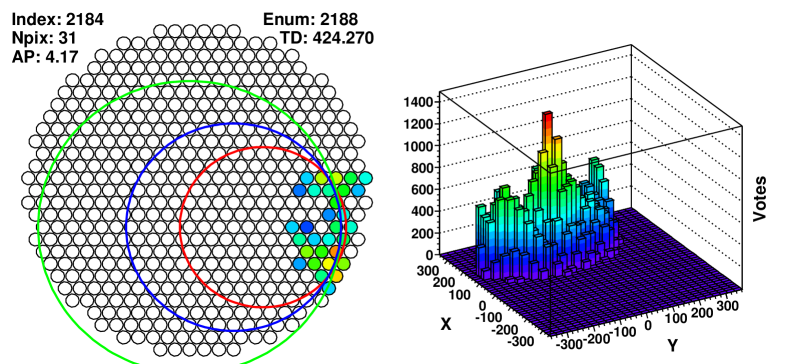
Figure 4 shows the pixel intensity patterns (left) and 2D parameter
space projections in the plane (right) for a muon event (top) and a
non-muon event (bottom). The red, green and blue circles superimposed
over the pixel patterns correspond to the coordinates of the bins of
the accumulator array with the highest, second highest and third
highest values. For the muon event, the three best parametrizations
trace the pixel pattern quite well and a sharp peak can be seen in
parameter space projection. For the non-muon event, the three best
parametrizations differ significantly in center locations and radii
and a less peaked distribution can be seen in the parameter space
projection. These features were used to motivate the first two muon identification
parameters described below:
The parameter: the value of the bin of the accumulator
array with the most votes divided by the average non-zero bin
value. Specifically:
The parameter can be thought of as a measure of the strength
or signal to noise ratio of the best parametrization of the
event. Since muon events produce sharp peaks in the accumulator array,
they should have large values.
The parameter: the sum of the distances in the parameter space
between the three best parametrizations of the event. Specifically, if
and represent the
best, second best and third best parametrizations of the event,
then:
where,
The parameter can be thought of as a measure of the unanimity of
the parametrizations, or the continuity of the parameter space
distribution. Since the three best parametrizations are similar for
muon events, these events should have small values.
The parameter: the number of pixels with non-zero values after standard image processing is applied.
5 Cuts and results
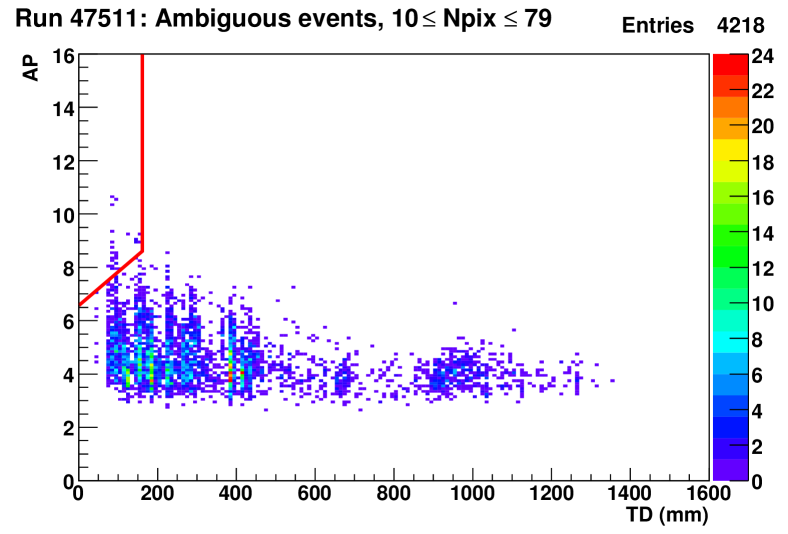
In order to test the effectiveness of the parameters described in the previous section for muon identification, 22774 events from the same run were visually inspected and categorized. These events were labeled muons, non-muons or ambiguous. Events with fewer than 10 hit pixels were not categorized due to the fact that circular patterns were difficult to identify in those images. 1516 events were categorized as muons, 17027 events were categorized as non-muons and 4231 events were categorized as ambiguous. The cuts on the muon identification parameters were optimized on the first half of the visually categorized events so that no non-muon events passed. The cuts that resulted in the greatest number of muons were found to be:
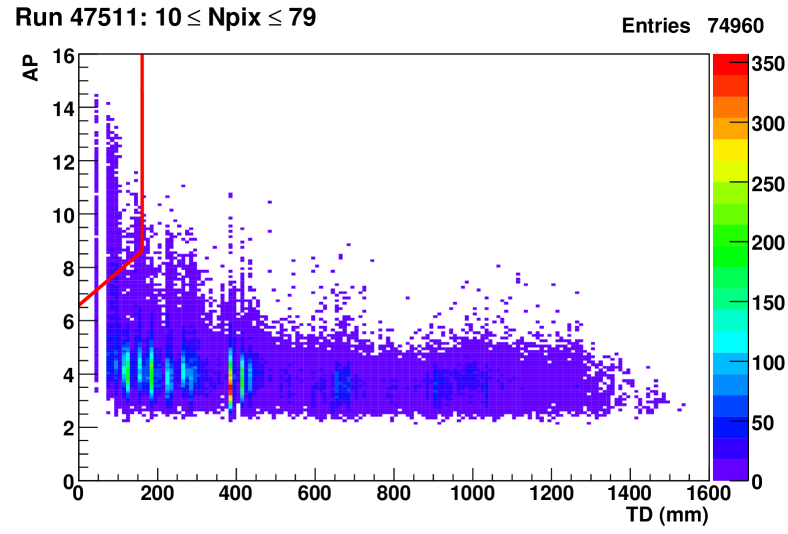
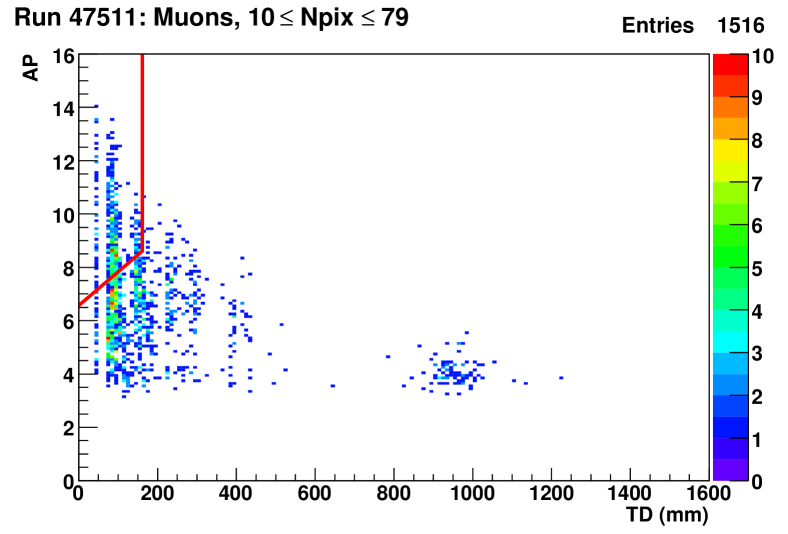
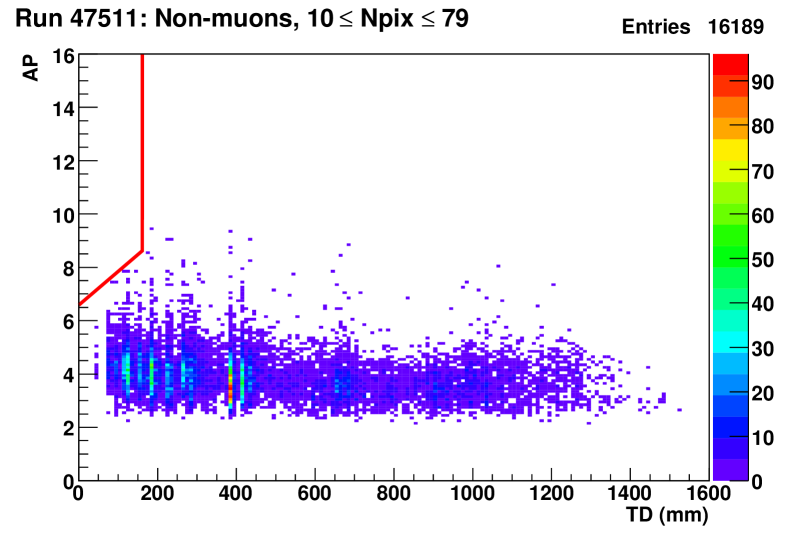
Figure 5 shows the distribution for each category of event with . The upper-left plot shows all events, the upper-right plot shows muon events, the lower-left plot shows non-muon events and the lower-right plot shows ambiguous events. The red lines indicate the cuts on and . The results of applying these cuts to the first half of the visually categorized events are shown in table 1. These cuts were then applied to the other half of the visually categorized events and were found to produce a pure muon sample with an estimated efficiency of approximately 29 percent. The results of applying the cuts to the second half of the visually categorized events are shown in table 2. These cuts were found to produce highly pure muon samples when applied to other runs, as shown in table 3.
| Total | Muons | Non-muons | Ambiguous | |
|---|---|---|---|---|
| Before | 10921 | 795 | 7918 | 2208 |
| After | 239 | 225 | 0 | 14 |
| Total | Muons | Non-muons | Ambiguous | |
|---|---|---|---|---|
| Before | 11853 | 721 | 9109 | 2023 |
| After | 228 | 210 | 0 | 18 |
| Run | Events | Passing cuts | False positives |
|---|---|---|---|
| 47511 | 274991 | 1617 | 5 |
| 40839 | 184048 | 1105 | 2 |
| 40840 | 166224 | 730 | 4 |
| 40841 | 184451 | 1101 | 3 |
6 Conclusions
The Hough transform was found to be effective at parametrizing the circular pixel patterns produced by muons in the VERITAS cameras. The cuts on the muon identification parameters obtained from the accumulator array were optimized using the visually categorized events and found to produce highly pure muon samples when applied to other runs. This technique is currently being implemented in the VERITAS offline analysis software. Upon completion, the technique will be used to identify muons for calibration work. Future research will involve improving the technique by investigating the efficiencies of different muon identification parameters as well as assessing the usefulness of the Hough transform algorithm for event reconstruction.
Acknowledgments: The author gratefully acknowledges the help of Ken Ragan, David Hanna, Andrew McCann, Micheal McCutcheon, Gernot Maier, Roxanne Guenette, Sean Griffin, Gordana Tesic, Simon Archambault, David Staszak, Jean-Francois Rajotte and Paul Mercure. This research is supported by grants from the U.S. Department of Energy Office of Science, the U.S. National Science Foundation and the Smithsonian Institution, by NSERC in Canada, by Science Foundation Ireland (SFI 10/RFP/AST2748) and by STFC in the U.K. We acknowledge the excellent work of the technical support staff at the Fred Lawrence Whipple Observatory and at the collaborating institutions in the construction and operation of the instrument.
References
-
[1]
Valcarcel, L. VERITAS, 1ES 1218 + 30.4 and the
Extragalactic Background Light. PHD thesis, McGill University, 2008.
-
[2]
Vacanti G. et al. Muon ring images with an atmospheric
Cerenkov telescope. Astroparticle Physics 2 (1994) 1-11
-
[3]
Tsui, T. Through-Going Muons at the Sudbury Neutrino
Observatory. PHD thesis, University of British Columbia,
2009.