Using Raster Scans of Bright Stars to Measure the Relative Total Throughputs of Cherenkov Telescopes
Abstract
Gamma-ray astronomy at energies in excess of 100 GeV is carried out using arrays of imaging Cherenkov telescopes. Each telescope comprises a large reflector, of order 10 m diameter, made of many mirror facets, and a camera consisting of a matrix of photomultiplier pixels. Differences in the total throughput between nominally identical telescopes, due to aging of the mirrors and PMTs and other effects, should be monitored to reduce possible systematic errors. One way to directly measure the throughput of such telescopes is to track bright stars and measure the photocurrents produced by their light falling on camera pixels. We have developed such a procedure using the four telescopes in the VERITAS array. We note the technique is general, however, and could be applied to other imaging Cherenkov experiments. For this measurement, a raster scan is performed on a single star such that its image is swept across the central pixels in the camera, thus providing a statistically robust set of measurements in a short period of time to reduce time-dependent effects on the throughput. Photocurrents are measured using the starlight-induced baseline fluctuations of the pixel outputs, as recorded by the standard readout electronics. In this contribution we describe details of the procedure and report on feasibility studies carried out during the 2012-2013 observing season.
1 Introduction
Very-high-energy (VHE) gamma-ray astronomy makes use of arrays of imaging atmospheric Cherenkov telescopes (IACTs). Observations made with more than one telescope achieve better background rejection, improved energy and angular resolution, and are immune to the effects of local muons. An issue that arises when using multiple telescopes is that of their relative calibration. Differences between nominally identical telescopes can come about from differential aging of mirror facets and photomultiplier tubes (PMTs) or from different maintenance or upgrade schedules. A simple parameter that can be used to correct for the overall effect of such changes is the relative total throughput of a telescope. This parameter can be estimated using a variety of techniques, such as the inclusive rate for cosmic-ray showers [1], analysis of shower-image sizes [2], signals from local muons [3] acquired using special triggers, and observations of scattered light from a distant laser beam [4, 5]. A solid understanding of a telescope’s calibration will result in the same number emerging from each of the techniques and the origin of changes to the number can be determined by examining data from component-specific calibration procedures such as light-pulse PMT calibration [6] and whole-dish mirror reflectivity measurements [10].
In this contribution we describe a total-throughput measurement procedure based on using photocurrents induced by the image of a bright star falling on PMTs in a telecope’s camera. The method was developed for the VERITAS array and we report here on initial tests made with that instrument. However the method is quite general and can be used for other arrays. Initial tests were conducted using magnitude 7 stars with spectra very different from the standard Cherenkov spectrum relevant to air-shower detection. We are currently exploring the use of ultraviolet filters, already acquired for observing under bright moonlight, to extend this technique to shorter wavelengths.
2 The VERITAS IACT Array
VERITAS comprises an array of four IACTs located at the Whipple Observatory at the base of Mount Hopkins in southern Arizona [7, 8]. Each of the telescopes is based on a 12-m diameter Davies-Cotton reflector focussing light onto a 499-pixel camera made from close-packed Hamamatsu R10560 PMTs coupled to conical light concentrators. Each reflector is made up of 345 identical mirror facets, the alignment of which is such that the on-axis point-spread-function is smaller than a pixel diameter [9].
3 Raster Scanning
The total throughput of one of the telescopes could be measured by tracking a single star and measuring the photocurrent from the camera’s central pixel. However it is statistically more powerful to illuminate several pixels, in sequence, in order to average out effects such as differences in the wavelength dependence of quantum efficiency in different PMTs. The standard tracking software for VERITAS is designed to map a telescope’s nominal pointing direction onto the central pixel and to change that to an arbitrary pixel required modifications. Such modifications were implemented as part of the VERITAS mirror alignment scheme [9] whereby a raster scan over a grid centred on a bright star is performed. We have adapted this scanning technique to cause the image of a star to sweep over the central pixels of the camera in a controlled fashion and with a grid step that is small enough to obtain data with the star image very close to the centre of a given pixel.
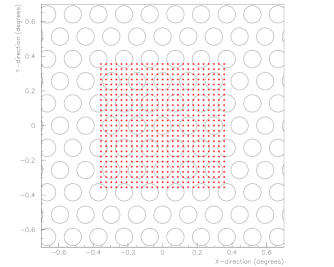
For the data reported on here we used a 25-by-25 array of pointings with a step size of 0.03 degrees. A VERITAS pixel has a field-of-view diameter of 0.15 degree so the grid should cover a square array of order 25 pixels. The mis-match between the hexagonal nature of the PMT positions and the square scan grid reduces this to 23 pixels (Figure 1).
4 Photocurrent Measurement
The readout electronics for a VERITAS pixel consist of a preamp in the PMT base followed by an amplifier and a 500 MS/s FADC located in the electronics shed under the telescope. The signals are AC coupled; a capacitor before the preamp blocks the DC photocurrent. However, a resitive path to ground upstream of the capacitor is provided for purposes of monitoring this current. Low-resolution (0.5 A step size) measurements are available, mainly to allow for switching off the high-voltage to a PMT in case of excess currents. For our purposes we need finer granularity. To obtain this we make use of the fact that baseline fluctuations (pedestal variations) as recorded by the FADC readout can be used as a proxy for photocurrent. This can be motivated by a simple model that posits current as coming from a stream of single-photoelectron pulses approximated as narrow digital pulses. The empirical proof of the correlation is shown in Figure 2.
Data for this figure were extracted from standard observing runs made under partial moonlight but while the moon was setting so the currents vary over an interesting range. In the upper left panel we plot the current readings for an arbitrary pixel as a function of time in minutes.
In the upper right panel we plot the corresponding smoothed baseline variances. For every event (approximately 300 times per second for these runs; the rate is random and dominated by cosmic ray triggers) a 16-sample FADC trace is recorded for each pixel and the variance can be calculated. Most traces are empty except for fluctuations due to night sky background photons (the scale of these fluctuations is much less than the scale of Cherenkov pulses). However, since the data were acquired under normal trigger conditions, there are some traces with Cherenkov pulses in them and these cause long tails in the variance distributions. To deal with this we use a “mean of medians” technique. First, we divide the data stream into groups of 300 events. These are further subdivided into 60 subgroups of 5 and we average the 60 medians from each 5-member subgroup, obtaining an average variance estimate approximately once per second.
In the lower left panel we plot the average variances as a function of current. The linear correlation is evident and justifies the use of baseline variance as a proxy for current in the following. The slopes of the fitted line from plots like that in Figure 2 are used to convert the increment in baseline variance due to the effect of the star to an increment in photocurrent.

5 Test Results
Raster-scan data for this study were acquired on two separate occasions. For each run a magnitude 7 star was chosen as the target and the telescopes were slewed to its coordinates. The raster scan was then performed and at the end the telescopes returned to their nominal tracking directions. The scan was carried out with a one-second dwell time at each pointing and one second between points for slewing and settling so the 625-point scan took just over 20 minutes. The target star was selected to be rising and close to transit; even though the run was reasonably short, we wanted to avoid systematic effects due to changes in flux due to atmospheric absorption. Data were acquired by externally triggering the array at a fixed rate of 300 Hz.
Results from the central pixel in one of the telescopes are shown in Figure 3 where we plot baseline variance (current proxy) as a function of time in seconds. The elevated currents at the beginning and end of the run are due to the tracking of the target star such that its image is contained within the central pixel. This feature is absent in Figure 4 where data from an off-centre pixel are plotted. In both figures one sees structure resulting from the scan where currents rise and fall as the star image is swept across the pixel field-of-view and the maximum of each peak rises and falls as the distance of the scan line from the centre of the pixel varies. In the following, we use the amplitude of the largest peak to make an estimate of the current that would result if the star’s image were exactly centred on the pixel.


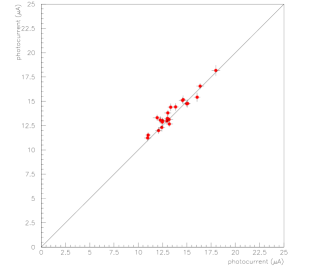
In Figure 5 we plot the peak currents achieved on one night vs the peak currents from the previous night for a single telescope. It is clear that the results obtained are reproducible over the short term and that the statistical errors are understood.
The peak currents from this telescope for a single night (i.e. the x projection of data plotted in Figure 5) are plotted in Figure 6. The dispersion is relatively large; the RMS is slightly more than 10% of the mean. The reasons for this are under study but may be partly due to the fact that the star’s image does not cross over the exact center of every camera pixel.
Similar results have been obtained from all telescopes in the VERITAS array and we are currently evaluating the level of systematic errors to be expected. Already the statistical errors indicate that we can expect to measure differences in relative throughput of a few percent.

6 Conclusions
We have tested a method for measuring the net throughputs of different telescopes in an array. The procedure requires no specialized equipment and can be carried out in less than 30 minutes, possibly during periods where moonlight or non-optimal weather lessen the competition for observing time. The initial results are very encouraging and we expect to pursue this in the future to look at long-term stability and possible improvements to the precision of the method.
Acknowledgments: We warmly thank our colleagues in the VERITAS collaboration for their support of this work and for assistance with data acquisition. VERITAS research is supported by grants from the U.S. Department of Energy Office of Science, the U.S. National Science Foundation and the Smithsonian Institution, by NSERC in Canada, by Science Foundation Ireland (SFI 10/RFP/AST2748) and by STFC in the U.K. We acknowledge the excellent work of the technical support staff at the Fred Lawrence Whipple Observatory and at the collaborating institutions in the construction and operation of the instrument.
References
- [1] S. LeBohec and J. Holder, Astroparticle Physics 19 (2003), 221
- [2] W. Hofmann, Astroparticle Physics, 20 (2003), 1
- [3] G. Vacanti, et al., Astroparticle Physics 2 (1994), 1
- [4] N. Shepherd et al, Proc. 29th International Cosmic Ray Conference, Pune (2005)
- [5] C.M. Hui, Proc. 30th International Cosmic Ray Conference, Merida (2007)
- [6] D. Hanna, A. McCann, M. McCutcheon and L. Nikkinen, NIM-A 612 (2010) 278
- [7] J. Holder et al., Astroparticle Physics 25 (2006), 391
- [8] T.C. Weekes et al., Astroparticle Physics 17 (2002), 221
- [9] A. McCann, D. Hanna, J. Kildea and M. McCutcheon, Astroparticle Physics 32 (2010) 325
- [10] S. Archambault, S. Griffin and D. Hanna, Proc. 33rd International Cosmic Ray Conference, Rio de Janeiro (2013)