Critical speeding-up near the monopole liquid-gas transition
in magnetoelectric spin-ice
Abstract
Competing interactions in the so-called spin-ice compounds stabilize a frustrated ground-state with finite zero-point entropy and, interestingly, emergent magnetic monopole excitations. The properties of these monopoles are at the focus of recent research with particular emphasis on their quantum dynamics. It is predicted that each monopole also possesses an electric dipole moment, which allows to investigate their dynamics via the dielectric function . Here, we report on broadband spectroscopic measurements of in Dy2Ti2O7 down to temperatures of 200 mK with a specific focus on the critical endpoint present for a magnetic field along the crystallographic [111] direction. Clear critical signatures are revealed in the dielectric response when, similarly as in the liquid-gas transition, the density of monopoles changes in a critical manner. Surprisingly, the dielectric relaxation time exhibits a critical speeding-up with a significant enhancement of as the temperature is lowered towards the critical temperature. Besides demonstrating the magnetoelectric character of the emergent monopole excitations, our results reveal unique critical dynamics near the monopole condensation transition.
The magnetic rare earth ions of the spin-ice compounds like Dy2Ti2O7 form a lattice of corner-sharing tetrahedra. The strong influence of crystal fields forces the magnetic moments to point along the axis connecting the centers of adjacent tetrahedra giving rise to a description in terms of effective Ising spins. In zero magnetic field, the ground state is characterized by a 2-in/2-out spin state configuration, i.e., there are two spins for each tetrahedron that point inwards and two that point outwards. The ground state, however, is not unique as there is a multitude of possible realizations of this 2-in/2-out arrangement giving rise to a finite zero-point entropy. Given the resemblance to the proton configurations of water-ice, this peculiar magnetism is known as spin-ice Harris1997 ; Ramirez1999 ; Bramwell2001 . Flipping a single spin breaks the 2-in/2-out ice rule for two adjacent tetrahedra: the resulting magnetic dipole excitation decomposes into an emergent magnetic monopole and anti-monopole pair that interact via a long-range magnetic Coulomb law Castelnovo2008 ; Ryzhkin2005 . Spin-ice thus offers a rare example of fractionalized excitations in a three-dimensional material.
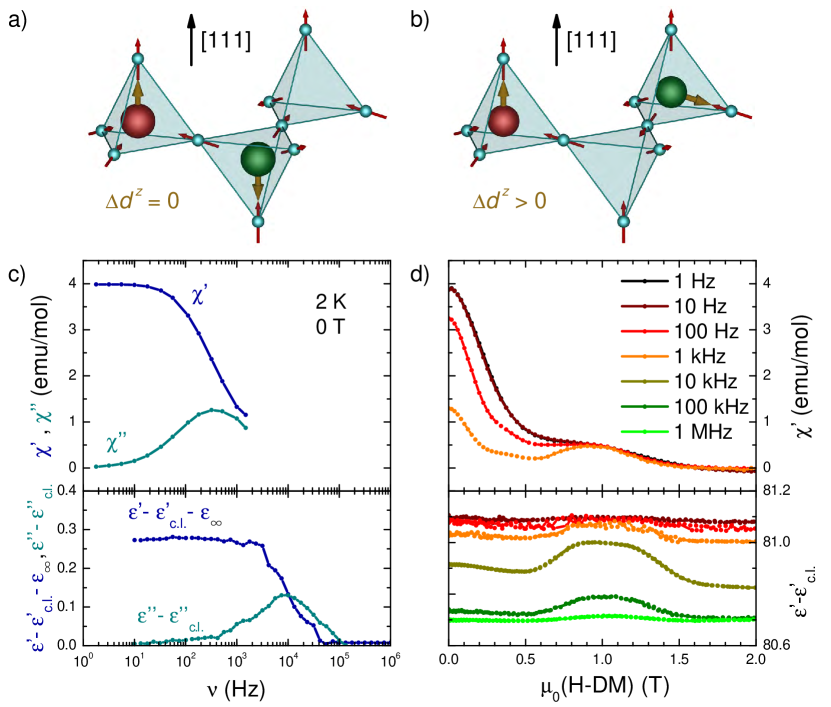
Recently, it has been pointed out by D. Khomskii Khomskii2012 that each magnetic monopole is also accompanied by an electric dipole. The presence of a magnetic monopole on a tetrahedron results in an electric dipole moment either due to a spontaneous charge redistribution or due to a magnetoelastic coupling. This dipole moment always points along the corner of the tetrahedron that is occupied by the spin which is singled out by the 1-in/3-out or the 1-out/3-in configuration, see Fig. 1(a) and (b). Furthermore, the hopping of monopoles from one tetrahedron to another is accompanied by a change of the net electric dipole moment. The dynamics of monopoles within the material thus leads to characteristic fluctuations of the electric polarization that, in principle, can be investigated with the help of the dielectric function . This is remarkable as it would provide means to probe explicitly the magnetic monopole excitations in spin-ice. Whereas the magnetic response is sensitive to both, magnetic monopoles that break the ice rules as well as collective spin-fluctuations that leave them intact, the magnetic part of the dielectric response is mainly susceptible to the former. First experimental indications for a magnetoelectric coupling in Dy2Ti2O7 were reported by Saito et al. Saito2005 . However, in their work the permittivity was only measured for a fixed frequency of 1 kHz. In the present work, we use broad-band dielectric spectroscopy and present measurements of in Dy2Ti2O7 for a wide range of frequencies, 1 Hz 1 MHz, and temperatures down to 200 mK.
A comparison between the magnetic and dielectric response in Dy2Ti2O7 is shown in Fig. 1. The spin dynamics up to kHz frequencies was already intensively explored by magnetic ac-susceptibility measurements Snyder2001 ; Matsuhira2011 ; Yaraskavitch2012 ; Matthews2012 ; Bovo2013 . In zero magnetic field the corresponding spin relaxation time is found to be temperature independent between 3 and 12 K but increases exponentially at lower temperatures as the ice rules start to establish themselves. A spectrum of is shown in the upper frame of Fig. 1(c). The loss peak in the imaginary part at a temperature of 2 K is located at Hz, and the resulting relaxation time, , is in nice agreement with previously reported results Matthews2012 ; Matsuhira2011 ; Yaraskavitch2012 . Although our spectral range for is also experimentally limited to kHz, it is already apparent that the real part levels off at a finite value at higher frequencies. One expects that a second relaxation process, which has not been detected yet, eventually leads to a vanishing of at even larger . Such a two-stage process is common in paramagnetic materials with the slow relaxation process being attributed to the spin-lattice interaction Snyder2001 ; Bovo2013 .
A spectrum of the dielectric response is shown in the lower frame of Fig. 1(c). We find that is insensitive to the slow relaxation process that governs . Instead, its relaxation dynamics is roughly two orders of magnitude faster with a loss peak in located at roughly kHz. At this point, it is however unclear whether this relaxation process is related to magnetism or rather has a non-magnetic origin.
In order to identify the magnetic contribution to the dielectric response, we investigated its magnetic field dependence. Particularly interesting is the application of a magnetic field along the direction. A quarter of all spins then align with the magnetic field at low temperatures due to the Zeeman energy. The remaining spins occupy sites of decoupled two-dimensional Kagome lattices. The ground state manifold consistent with the ice rules is still degenerate and thus realizes Kagome-ice. At a critical internal field of T in Dy2Ti2O7, Sakakibara2003 ; Hiroi2003 ; Aoki2004 ; Kolland2012 it becomes advantageous to break the ice rules and to quench the remaining zero-point entropy in order to minimize the Zeeman energy further. Correspondingly, at the transition monopoles proliferate and are accommodated into the magnetic ground state at larger fields.
Neglecting the magnetic Coulomb force among monopoles, this transition is approximated by a two-dimensional Ising model in a longitudinal field Isakov2004 . However, the long-range interaction promotes quantum fluctuations so that the transition becomes first-order and also extends to finite Castelnovo2008 . The resulting line of first-order transitions terminates at a critical endpoint at a finite temperature mK Sakakibara2003 ; Hiroi2003 ; Aoki2004 ; Kolland2012 . It was argued in Ref. Shtyk2010 that the universality of this endpoint is equivalent to the one in critical uniaxial ferroelectrics that show mean-field behavior with logarithmic corrections.
In Kagome-ice, the low-energy monopole excitations carry an electric dipole that is parallel or antiparallel aligned with the applied magnetic field, see Fig. 1(a). Other configurations like Fig. 1(b) have an excitation energy of approximately 4 K close to the critical field so that they are frozen out at lower temperatures. On the other hand, in the limit of large fields each tetrahedron houses a monopole whose electric dipoles are antiferroelectrically ordered with respect to each Kagome plane. Correspondingly, it was suggested in Ref. Khomskii2012 that antiferroelectricity is a secondary order parameter of the transition at with the concomitant signatures in .
The magnetic field dependence of the magnetic response at K is shown in the upper frame of Fig. 1(d) for frequencies up to 1 kHz. At small fields is strongly dispersive but it becomes practically frequency independent at higher fields. This change of dispersion is less attributed to a field dependence of the relaxation rate but rather to a quench of the slow relaxation process as the magnetic field increases towards , i.e. the weight of the loss peak in is suppressed with increasing Matthews2012 ; Bovo2013 . The field dependence of the dielectric response to an ac electric field longitudinal to the [111] axis is displayed in the lower frame of Fig. 1(d). Again, is insensitive to the slow relaxation dominating but only exhibits faster relaxation that becomes visible for frequencies exceeding 1 kHz. At the same time, a pronounced magnetic field dependence appears with a maximum close to the critical field.
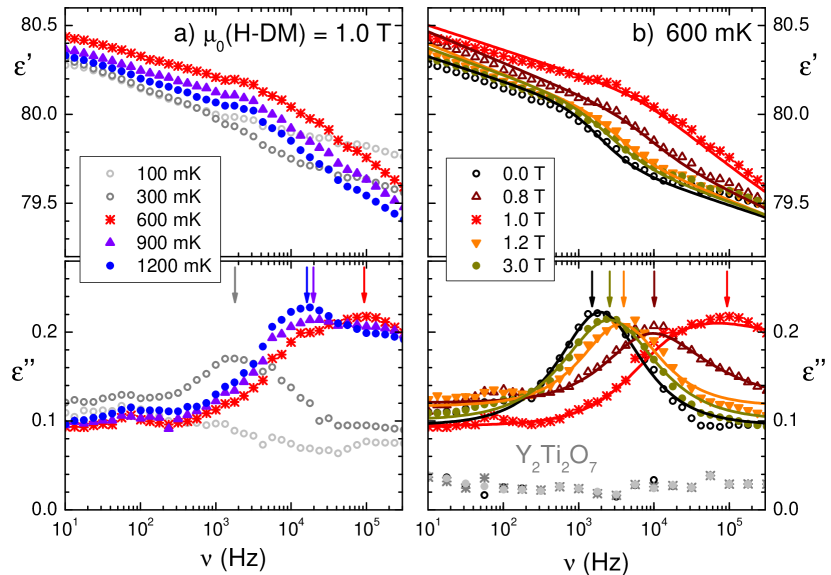
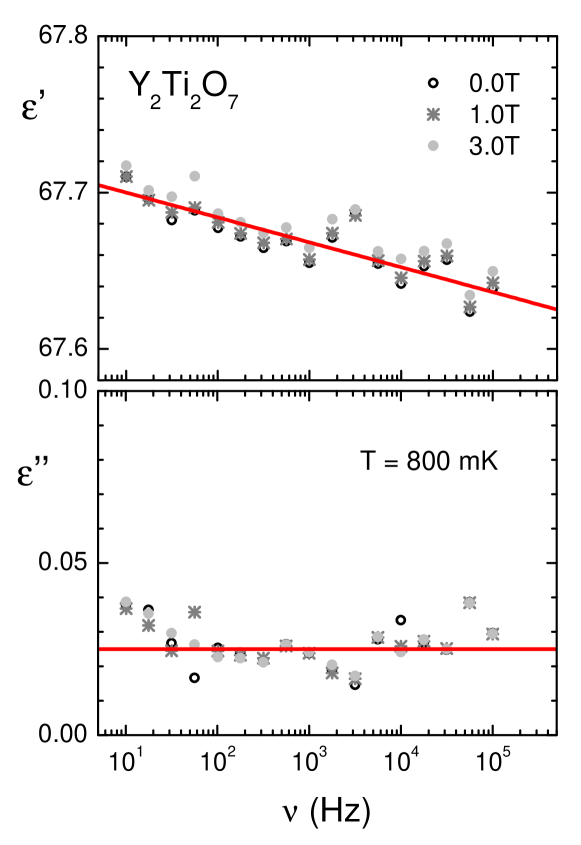
Full spectra of the dielectric response are presented in Fig. 2 for selected magnetic fields and temperatures. The spectra contain a constant field-independent contribution to , which translates via the Kramers-Kronig relations to giving rise to a constant negative slope in the permittivity on a logarithmic frequency scale. Such a constant loss is known from other titanate based quantum-paraelectric materials like SrTiO3 Hemberger1994 . It has been attributed to quantum tunneling between narrow off-centered positions of the Ti-ions, which are also responsible for the very high absolute value of the low-temperature permittivity of about . A comparison of the dielectric loss with measurements on the non-magnetic iso-structural compound Y2Ti2O7 at 600 mK plotted in grey in Fig. 2(b) shows that the peak is absent while a constant loss contribution remains. This constant loss was subtracted from the data shown in Fig. 1.
After considering the large constant background and the constant loss, the remaining dielectric relaxation was modeled using a Havriliak-Negami function, which in principle can be related to an asymmetrically broadened distribution of relaxation times (see Kremer2003 and SI). It yields a very good description of the complex permittivity spectra as demonstrated in Fig. 2(b). A full set of fitting parameters is given in the SI.
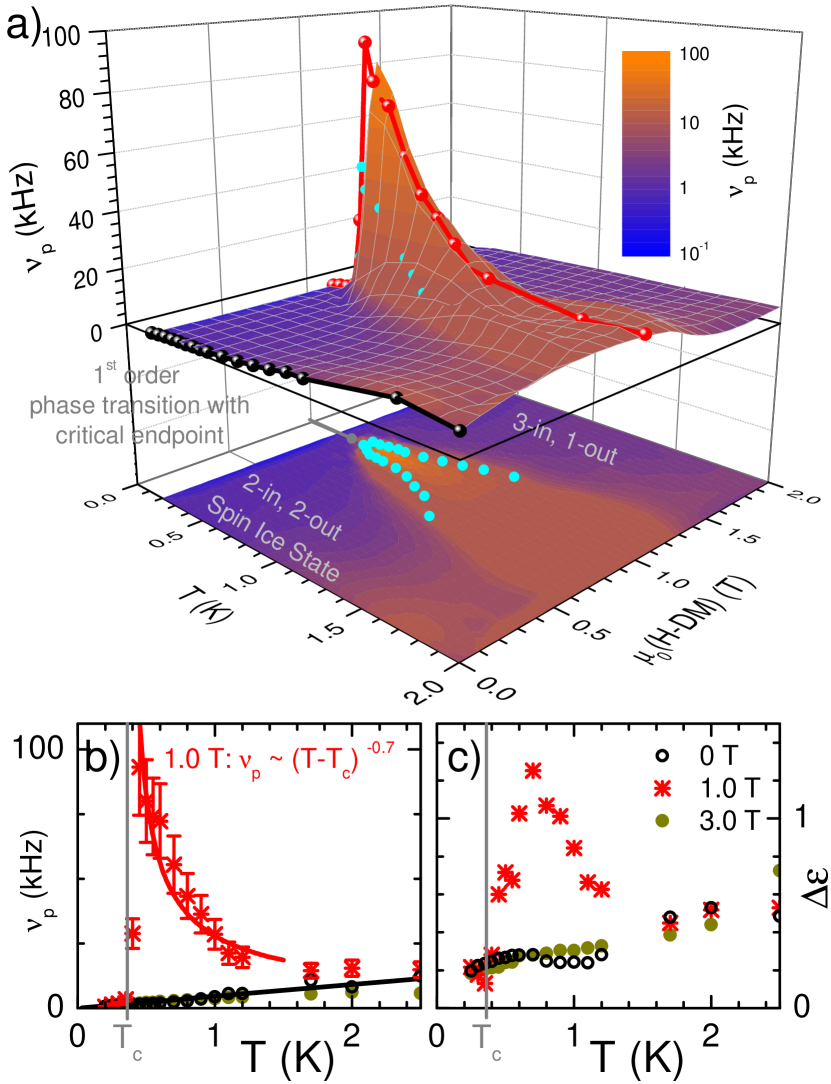
The most important parameter characterizing the relaxational dynamics is the position, , of the loss peak (see arrows in Fig. 2) that defines a dielectric relaxation rate . The dependences of for temperatures, , below 2 K and internal magnetic fields, , up to 2 T is shown in Fig. 3(a). Away from the critical field, T, the relaxation rate is remarkably independent of field. As shown in more detail in Fig. 3(b), the rate at zero field and 3 T almost coincide. Such a field-independent relaxation in the dielectric response is likely to be of non-magnetic origin although the comparison in Fig. 2(b) with the non-magnetic compound Y2Ti2O7 suggests otherwise. However, a strong magnetic influence indisputably appears close to the critical field. The relaxation rate changes dramatically as a function of field and temperature, and it reflects the critical behavior associated with the monopole liquid-gas endpoint. We therefore conclude that the dielectric dynamics is sensitive to the criticality of magnetic monopoles close to their condensation transition.
Besides establishing the magnetoelectric coupling in spin-ice, the results of Fig. 3 also reveal unexpected critical dynamics. Away from the critical field, the relaxation rate decreases monotonically with temperature, see SI for more details. However, as the critical endpoint is approached, the relaxation changes dramatically with a sharp increase in . This implies that the polarization decorrelates faster close to criticality. Assuming critical dynamic scaling, we can relate the relaxation time to the correlation length, , via the dynamical exponent . At the critical field the correlation length is assumed to diverge as a function of temperature, with the correlation length exponent , so that
| (1) |
Usually, the dynamical exponent is positive resulting in the canonical behavior of critical slowing-down. Here, we find instead a negative dynamical exponent implying a critical speeding-up of the dynamics. Close to the critical temperature this speeding-up is particularly dramatic as a function of field with growing by two orders of magnitude. From a fit within the temperature range from 450 mK to 1.2 K we can estimate the exponents to be approximately , see Fig. 3(b).
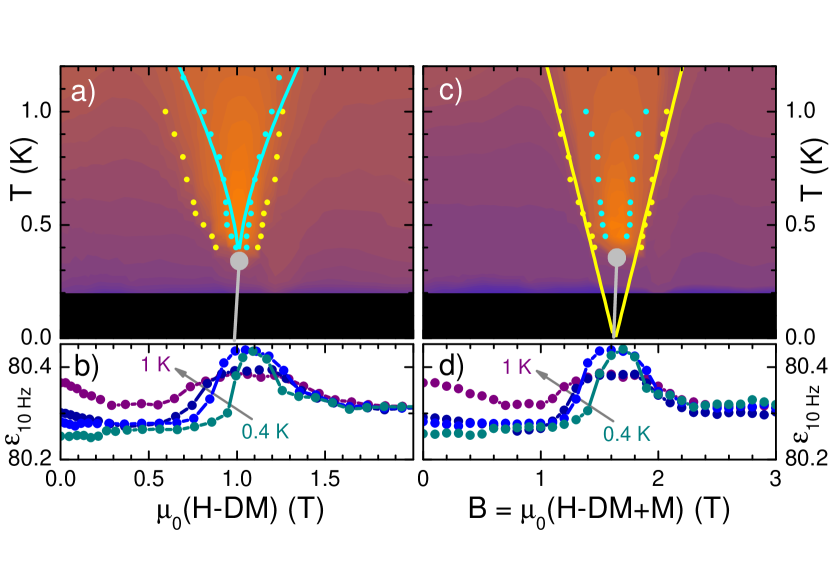
We can define a crossover scale by locating the positions of the full width at half maximum (FWHM) of the function , which yield the blue dots in Fig. 3(a). These crossover lines first follow the mean-field prediction Shtyk2010 , , as shown by the blue solid lines in Fig. 4(a). A similar scaling close to the endpoint is also observed in the specific heat Hiroi2003 . Closer inspection, however, reveals deviations very close to the critical temperature. Indeed, critical speeding-up comes to an halt at a temperature of 450 mK just before mK, and abruptly drops towards zero, see Fig. 3(b) This sudden qualitative change of behavior could have different origins. It might be attributed either to inhomogeneous demagnetization fields smearing the critical behavior or a slight misalignment of the applied field with respect to the [111] axis. Alternatively, it could indicate a crossover to a more conventional behavior of critical slowing-down. The relaxation process is also very asymmetric with respect to the critical temperature. It is indistinguishable from the non-critical background for .
The weight of the dielectric loss, i.e., the relaxation strength is shown in Fig. 3(c). Again, the weight at zero field and 3 T are barely distinguishable but a strong enhancement appears close to the critical field. As a function of decreasing temperature, the weight starts to increase at around 1.5 K but peaks at approximately 700 mK before dropping back to the non-critical background. The location of this peak position emphasizes the qualitative change of the relaxation dynamics upon approaching the critical temperature as already observed in the relaxation rate.
The quasi-static limit of the dielectric response, , measured at Hz is shown in Fig. 4(b). As pointed out in Ref. Saito2005 , the two plateaus emerging at low temperatures can be related to a magnetic renormalization of the permittivity, , and reflect the constant magnetization of Kagome ice and its saturation at low and high fields, respectively. In principle, one expects that the static permittivity exhibits signatures at the critical crossover, i.e., at the blue lines Fig. 4(a). However, such signatures are not observed and are possibly beyond the resolution of our measurement. The peak of close to the critical field gives rise to inflection points whose positions are marked as yellow dots in Fig. 4(a), which instead define an additional crossover that, interestingly, is markedly different from the one extracted from the FWHM of . It is characterized by a different -dependence and and it is also asymmetric with respect to the critical field. The presence of an additional crossover and its asymmetry is unexpected for an endpoint in the Ising universality class.
The same data is plotted in Fig. 4(c) against the magnetic flux density that approximately corresponds to the applied magnetic field for our disc-shape sample, . Here, remarkably, the additional crossover becomes symmetric and extrapolates linearly to zero temperature (yellow lines), . Such a linear scaling to zero temperature is reminiscent of the effective short-range Ising model for spin-ice Isakov2004 . We therefore interpret tentatively the yellow crossover extracted from the quasi-static permittivity as a signature for the onset of critical short-range correlations. Interestingly, the development of these correlations coincides with the magnetic field dependence of the dielectric dynamics. Outside the regime enclosed by the yellow crossover lines the dielectric relaxation is practically field independent but it gets strongly modified inside indicated by its orange shading in Fig. 4(a) and (c).
The emergent magnetic monopoles in spin-ice are accompanied by an electric dipole moment giving rise to intrinsic magnetoelectric coupling Khomskii2012 . We confirmed this magnetoelectricity in Dy2Ti2O7 and, in addition, demonstrated that the dielectric dynamics gets dramatically modified close to the monopole liquid-gas transition resulting in a critical speeding-up. Besides revealing a peculiar aspect of the dynamical critical behavior of monopole condensation, our findings provide a proof of principle for dielectric spectroscopy of monopoles in spin-ice.
Acknowledgements.
We thank S. Bramwell, D. Khomskii, T. Lorenz, and A. Rosch for useful conversations. This work is supported by the Deutsche Forschungsgemeinschaft via SFB608 (Cologne), FOR960, and research grant HE-3219/2-1.References
- (1) M. Harris, S. Bramwell, D. McMorrow, T. Zeiske, and K. Godfrey Phys. Rev. Lett. 79, 2554 (1997).
- (2) A. P. Ramirez, A. Hayashi, R. J. Cava, R. Siddharthan, and B. S. Shastry, Nature 399, 333 (1999).
- (3) S. T. Bramwell and M. J. Gingras, Science 294, 1495 (2001)
- (4) C. Castelnovo, R. Moessner, and S.L. Sondhi, Nature 415, 42-45 (2008)
- (5) I. A. Ryzhkin, JETP 101, 481-486 (2005).
- (6) D. I. Khomskii, Nature Communications 3, 904 (2012)
- (7) M. Saito, R. Higashinaka, and Y. Maeno, Phys. Rev. B 72, 144422 (2005)
- (8) J. Snyder, J. S. Slusky, R. J. Cava, and P. Schiffer, Nature 413, 48-51 (2001)
- (9) K. Matsuhira, C. Paulsen, E. Lhotel, C. Sekine, Z. Hiroi, and S. Takagi, JPSJ 80, 123711 (2011)
- (10) L. Yaraskavitch, H. M. Revell, S. Meng, K. A. Ross, H. M. L. Noad H.A. Dabkowska, B. D. Gaulin, and J. B. Kycia, Phys. Rev. B 85 020410(R) (2012)
- (11) M.J. Matthews, C. Castelnovo, R. Moessner, S.A. Grigera, D. Prabhakaran, and P. Schiffer, Phys. Rev. B 86, 214419 (2012)
- (12) L. Bovo, J. A. Bloxsom, D. Prabhakaran, G. Aeppli, and S. T. Bramwell, Nature communications 4, 1535 (2013)
- (13) T. Sakakibara, T. Tayama, Z. Hiroi, K. Matsuhira, and S. Takagi, Phys. Rev. Lett. 90, 207205 (2003)
- (14) Z. Hiroi, K. Matsuhira, S. Takagi, T. Tayama, and T. Sakakibara, Journal of the Physics Society Japan 72, 411-418 (2003)
- (15) H. Aoki, and T. Sakakibara, K. Matsuhira, and Z. Hiroi, Journal of the Physics Society Japan 73, 2851-2856 (2004)
- (16) G. Kolland, O. Breunig, M. Valldor, M. Hiertz, J. Frielingsdorf, T. Lorenz, Phys. Rev. B 86, 060402 (2012).
- (17) S. V. Isakov, K. S. Raman, R. Moessner, and S. L. Sondhi, Phys. Rev. B 70, 104418 (2004)
- (18) F. Kremer and A. Schönhals, Broadband Dielectric Spectroscopy, Springer (2003)
- (19) R. Viana, P. Lunkenheimer, J. Hemberger, R. Böhmer, and A. Loidl, Phys. Rev. B 50, 601 (1994)
- (20) A. V. Shtyk and M. V. Feigel’man, JETP Letters 92, 799-803 (2010).
- (21) G. Kolland, Thermal Conductivity of the Spin-Ice Compound Dy2Ti2O7 and the Spin-Chain System BaCo2V2O8, Dissertation, Universität zu Köln, (2013).
- (22) http://www.esrf.eu/Accelerators/Groups/InsertionDevices/Software/Radia
I Supplementary information
I.1 Methods
Single crystals of Dy2Ti2O7 were grown using a floating zone method. The structural characterization by X-ray diffraction revealed phase purity and the expected cubic structure. The samples were prepared as thin platelets normal to the [111] direction with a typical thickness of mm and an area of mm2. The measurements of the complex dielectric permittivity were performed in the frequency range from 1 Hz to 1 MHz employing a frequency-response analyzer Novocontrol Alpha-A with stimuli of typically 1 V/mm. For these measurements contacts of silver paste were applied at opposite sides of the crystal platelets. The samples were oriented with magnetic and electric fields in the crystalline [111] direction. The magnetic-field range up to 3.5 T and the temperature range from 100 mK to 5 K for the dielectric measurements were covered using a QuantumDesign PPMS magneto-cryostat and a Oxford Kelvinox 3He/4He dilution refrigerator. The magnetic AC-susceptibility measurements were performed in a QuantumDesign MPMS SQUID with AC-Option with AC-magnetic field stimuli of 2 Oe parallel to the applied DC-field along [111] direction.
I.2 Constant loss behaviour in quantum paralectric titanates
Titanates with Ti- configuration in an octahedral oxygen environment usually show a large polarizability due to the off-center motion of the titanium ions. Aside from the prototypical ferroelectric BaTiO3 the quantum paraelectric sister compound SrTiO3 is a well known example Hemberger1994 . In quantum paraelectrics the ferrolectric order is suppressed due to quantum fluctuations, leading to a saturation of the dielectric permittivity at relatively large values at low temperatures.
Within this regime the dielectric response exhibits a constant, i.e. frequency independent, loss contribution Hemberger1994 . Such a contribution in the imaginary part of the response function is via the Kramers-Kronig relations connected to a corresponding contribution in the real part, which shows a constant negative slope:
| (2) |
| (3) |
Here denotes a reference frequency which in the following was chosen as 10 Hz. In Fig. 5 we show measurements of the dielectric response of non-magnetic Y2Ti2O7. On top of the typically large dielectric background of one finds the signatures of constant loss behavior, i.e. a frequency independent contribution to and a negative slope on . Such a type of contribution can also be found in Dy2Ti2O7 as described in the paper.
I.3 The Havriliak-Negami function
For the evaluation of the peak position, the step height in and the relaxation time , the spectra of the dielectric loss were fitted with a Havriliak-Negami function Kremer2003 and a nearly constant loss contribution:
| (4) |
| (5) |
The shape of the permittivity spectra is determined by the parameters and ranging between unity and zero. For the Havriliak-Negami function replicates the Debye-relaxation. If the spectra are symmetrically broadened with respect to the Debye case. For the spectra are asymmetrically broadened. Both cases reflect the presence of a (symmetric or asymmetric) distribution of relaxation times in contrast to the mono-dispersive Debye-relaxator. In that case the parameter does not reflect the most probable relaxation time , i.e. the inverse of the peak frequency . But the fit parameters can be used to calculate the peak position and the corresponding relaxation time using
| (6) |
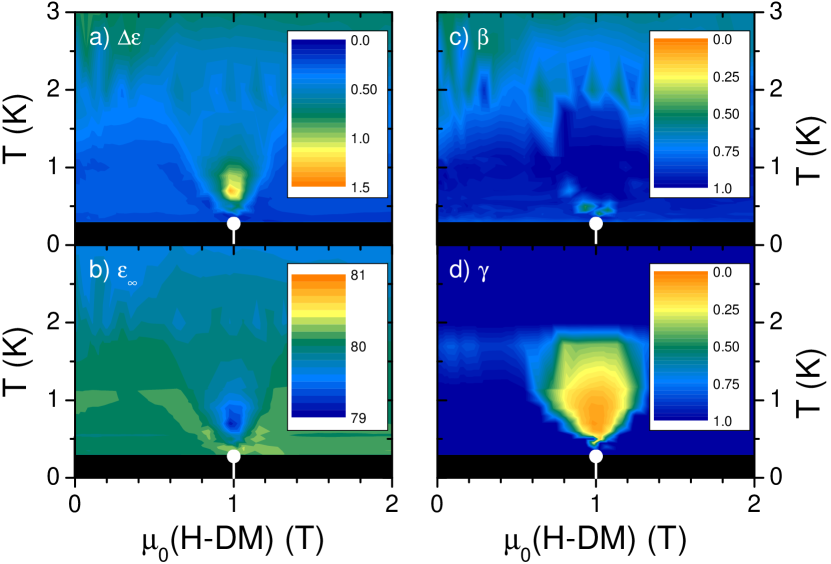
Fig. 6 displays the results for the parameters , , , and . Whereas the broadening parameter in panel (c) stays close to unity within the examined -regime, the other fitting parameters vary substantially. In particular, it is apparent that at the fitting parameters assume maximal values approximately K above the critical temperature mK. This indicates a qualitative change of the relaxation dynamics as the critical endpoint is approached, see also discussion in the main text.
I.4 Demagnetization fields
For technical reasons, dielectric measurements were performed on a disc-like sample of Dy2Ti2O7 with a demagnetization factor that is almost 1 resulting in substantial demagnetization fields within the sample. The internal magnetic field strength has been calculated numerically using magnetization data for Dy2Ti2O7 in [111] magnetic field published in SI-kolland , the radia software package provided by the ESRF SI-radia , and the dimensions of the rectangular sample.
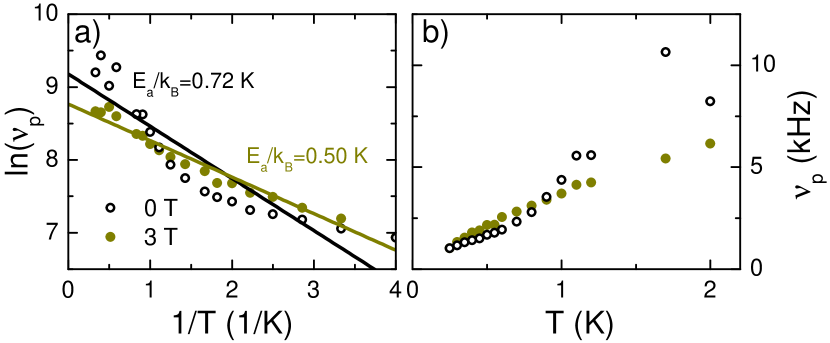
I.5 Temperature dependence of dielectric relaxation away from the critical field
Away from the critical field, the dielectric relaxation is approximately independent of magnetic field, see Fig. 4(c) of the main text. Fig. 7 focusses on the temperature dependence of the peak frequency at zero field and T. Both decrease monotonically with temperature but the precise functional dependence is not evident. At T the dependence can be approximately described by an Arrhenius law with an activation energy of K, see solid lines.