Deep Chandra Observations of Abell 2199: The Interplay Between Merger-Induced Gas Motions and Nuclear Outbursts in a Cool Core Cluster
Abstract
We present new Chandra observations of Abell 2199 that show evidence of gas sloshing due to a minor merger, as well as impacts of the radio source, 3C 338, hosted by the central galaxy, NGC 6166, on the intracluster gas. The new data are consistent with previous evidence of a Mach shock from the cluster center, although there is still no convincing evidence for the expected temperature jump. Other interpretations of this feature are possible, but none is fully satisfactory. Large scale asymmetries, including enhanced X-ray emission southwest of the cluster center and a plume of low entropy, enriched gas reaching to the north of the center, are signatures of gas sloshing induced by core passage of a merging subcluster about 400 Myr ago. An association between the unusual radio ridge and low entropy gas are consistent with this feature being the remnant of a former radio jet that was swept away from the AGN by gas sloshing. A large discrepancy between the energy required to produce the shock and the enthalpy of the outer radio lobes of 3C 338 suggests that the lobes were formed by a more recent, less powerful radio outburst. Lack of evidence for shocks in the central indicates that the power of the jet now is some two orders of magnitude smaller than when the shock was formed.
Subject headings:
X-rays: galaxies: clusters – galaxies: clusters: individual (Abell 2199) – intergalactic medium – cooling flows1. Introduction
The nearby rich cluster Abell 2199 (hereafter A2199) is a prototypical “cooling flow” cluster. On large scales, the morphology of its intracluster medium (ICM) is smooth and highly symmetric, as revealed by Einstein (Forman & Jones, 1982), ROSAT (Siddiqui et al., 1998), and ASCA (Markevitch et al., 1999) observations. Embedded in the cool cluster core is the cD galaxy NGC 6166, which hosts the spectacular and unusual radio source 3C 338 (Burns et al., 1983). Using ROSAT/HRI and VLA observations, Owen & Eilek (1998) examined the disturbed morphology of the core gas and concluded that nuclear outbursts have likely deposited a significant amount of energy in the core, thus dramatically modifying the gas dynamics. Through analysis of early Chandra observations, Johnstone et al. (2002) confirmed and extended our understanding of the gas dynamics in A2199, revealing an X-ray cavity associated with the eastern radio lobe and quantifying the gas heating required to maintain the cool core in a steady state. From these Chandra observations, Sanders & Fabian (2006) found a surface brightness discontinuity in the gas from the cluster center, which they attributed to an isothermal shock driven into the gas by the supersonic inflation of the 3C 338 radio lobes.
In this paper we present results from new Chandra observations of A2199, providing approximately four times the exposure and a larger field of view than the earlier observations. Section 2 describes the data preparation. Section 3 presents an overview of the X-ray and radio structures. Section 4 discusses the effects of sloshing and outbursts from the active nucleus as the origin of the various structures summarized in section 3. Section 5 summarizes the results. We adopt a luminosity distance of 127 Mpc ( kpc) for A2199, based on the redshift of NGC 6166 (; de Vaucouleurs et al., 1991). Uncertainties are quoted at the 90% confidence level, unless otherwise stated. All spectral fits include foreground absorption ().
2. Chandra and VLA Observations
2.1. Chandra Imaging Analysis Methods
Chandra observed A2199 on six occasions, with two 20 ksec ACIS-S observations in 1999 – 2000 and four ACIS-I observations, for a total exposure of 120 ksec, in 2009. A log of the Chandra observations is given in Table 1. In this work, we use data collected by the S3 CCD in the two ACIS-S observations and data from the I0 – 3 CCDs in the ACIS-I observations.
All six observations were reprocessed with CIAO v4.2, using the corresponding calibration files and following standard reduction procedures. The light curves indicate that the instrumental background for each observation was fairly quiescent. Filtering out periods of high background using clipping with the CIAO LC_CLEAN script111http://cxc.harvard.edu/ciao/ahelp/lc_clean.html resulted in 10% exposure loss (Table 1). Our analysis was restricted to the 0.5 – 8 keV range. Exposure maps for the observations were generated using energy weights determined from a thermal plasma model (APEC), with a temperature of 4 keV and abundances of 0.3 solar on the scale of Anders & Grevesse (1989), plus fixed foreground absorption (WABS), appropriate for the large-scale X-ray emission from A2199. We also accounted for the energy-dependence in the effective area of the S3 CCD and I CCDs, so that the count rates given in this paper are appropriate to ACIS-I. “Blank sky” data222http://cxc.harvard.edu/ciao/threads/acisbackground/ were used to generate the sky+particle background for each observation, after calibrating the particle background level in the 10 – 12 keV range. Background levels are generally less than a few percent for the data analyzed here. Artifacts due to photons recorded during CCD readout were accounted for, following the technique of Markevitch et al. (2000). This procedure simulates photon events recorded during readout for individual observations. These “out-of-time” events were combined with the “blank sky” events to form a fiducial background to be subtracted from the observations.
Like almost every X-ray mission to date, Chandra’s broad band response is insensitive to the gas temperature for values in the range of interest here. For example, for a fixed gas emission measure, reducing the nominal gas temperature from 4 to 3 keV would increase the 0.5 – 2 keV count rate in ACIS-I by , while increasing it to 5 keV would reduce the count rate by . The effect of such temperature variations alone would be imperceptible in our images. With other parameters fixed, the count rate is proportional to the emission measure, i.e., to the square of the gas density within a fixed volume. Away from shocks, the gas remains close to local pressure equilibrium, so that an abrupt temperature change is usually acompanied by an abrupt change in the density. In that case, the density change accompanying a temperature reduction from 4 to 3 keV would boost the count rate by , while that accompanying a temperature boost from 4 to 5 keV would decrease the count rate by . Thus, under local pressure equilibrium, changes in the 0.5 – 2 keV surface brightness are dominated by the impact of the change in density. In a weak shock, both the temperature and the density increase, with the fractional temperature change being the smaller of the two (to first order, by a factor of in monatomic gas), so that the density change is also the dominant cause of changes in brightness associated with shocks. The 0.5 – 2 keV response of Chandra is also quite insensitive to the abundances. For example, doubling the abundance from 0.3 to 0.6 solar in the thermal model used to make the exposure map would increase the image brightness by . In summary, structure in the X-ray images is almost completely determined by structure in the gas density.
For the imaging analysis, we projected the individual count, exposure and background maps to a common tangent point at the optical center of NGC 6166 to produce summed images of the combined field of view. The central of A2199 is covered by all six observations, whereas the central – region is covered by the four ACIS-I observations. Point sources detected across the combined field of view, apart from the X-ray nucleus of NGC 6166, were excluded from further quantitative analysis. The merged, background subtracted and exposure corrected image is shown in Fig. 1 and discussed below.
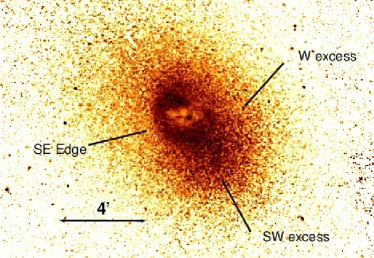
For the purpose of highlighting residual structure in the X-ray image, the two-dimensional X-ray surface brightness distribution was fitted with an elliptical -model using CIAO Sherpa and the C-statistic to measure goodness of fit. The best fitting parameters depend to some extent on the region fitted (Table 2), but they are in reasonable agreement with previous results from ROSAT (Owen & Eilek, 1998; Siddiqui et al., 1998). Parameters for the range – were used to make the residual images of Fig. 2. To obtain the image in Fig. 3, the X-ray image was divided by a beta model fitted to the azimuthally averaged surface brightness profile, highlighting departures from azimuthal symmetry. We note that the features seen in the images are insensitive to the underlying cluster profiles.
2.2. Chandra Spectral Analysis Methods
For spectral analysis of the ICM, we extracted spectra and produced instrument response files for individual observations, using the standard event weighting for extended regions. Point sources were identified using the method of Wang (2004), with a detection limit of (0.5 – 8 keV), giving 60 point source regions that were excluded from spectra. In most cases, spectral results were obtained by fitting spectra jointly. However, for the fits given in Table 6, since the available photon counts are small, the spectra were co-added for fitting. The temperature and metallicity maps were also made by fitting summed spectra. Tests show that the differences in the best fitting spectral parameters obtained by fitting the co-added spectrum and fitting the individual spectra jointly are smaller than a few percent.
2.3. VLA Observations
Two archival VLA datasets for 3C 338 taken at 1.5 GHz in A-array configuration and 4.9 GHz in B-array configuration (Table 3) were used to make radio images for comparison with the X-ray and to measure radio properties with high angular resolution (Table 4). The radio observations were analyzed using AIPS (Astronomical Image Processing System). Absolute flux density calibration was tied to observations of 3C 286 (Burke & Graham-Smith, 2009).
3. X-ray, Radio, and Multiwavelength Structures
The multiwavelength observations, especially the Chandra X-ray and VLA radio images, provide insights into the origin of the variety of structures seen in A2199. Below we describe the structures and in section 4, we discuss possible physical origins for these structures.
3.1. Large Scale X-ray Structures - Southwest Excess and Eastern Edge
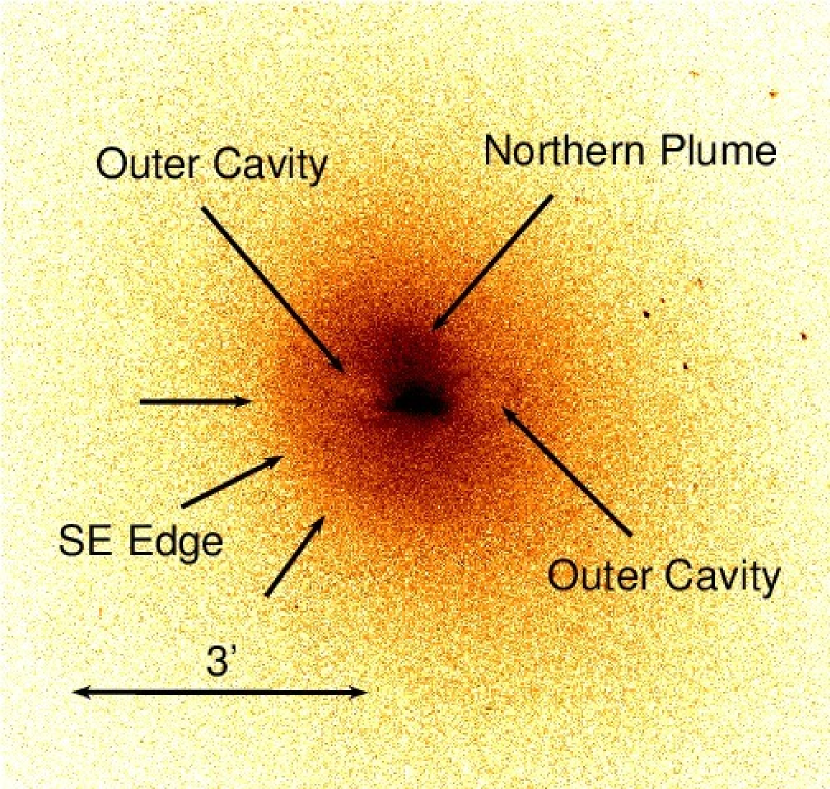
The X-ray images show the presence of several large scale structures. The primary features seen in the large scale images of Figs. 1 – 3 include:
-
•
a large scale excess to the southwest and west, most clearly apparent in the residual image of Fig. 3.
- •
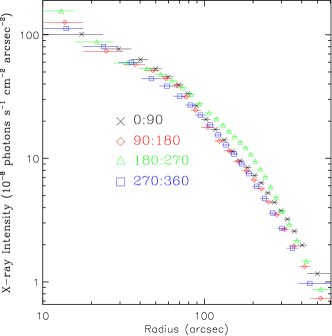
To further investigate the large scale asymmetry in the gas distribution, radial surface brightness profiles were made in four sectors (Fig. 4). The asymmetry is most apparent in the southwest quadrant, which shows an excess over the other quadrants from to , peaking at at a radius of . This is the excess seen in the X-ray images to the southwest in Fig. 3.

3.2. Azimuthally Averaged Gas Temperature and Gas Density Profiles
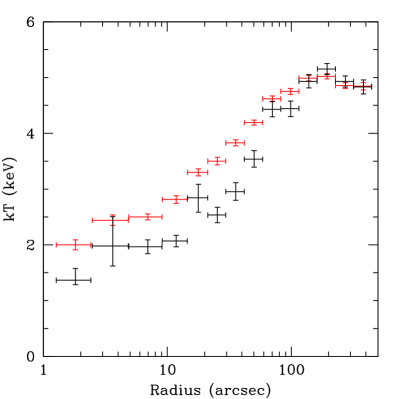
To obtain azimuthally averaged radial distributions of the gas temperature, density and metallicity, spectra were extracted from annuli centered on the active galactic nucleus (AGN) of NGC 6166. These were fitted using a thermal plasma model (xspec apec, using the cosmic abundances of Anders & Grevesse, 1989) with the Galactic foreground absorption (wabs, with fixed ). The model was also combined with the xspec projct model to obtain deprojected temperatures, densities and abundances. The resulting temperature and density profiles shown in Fig. 5, with projected temperatures in red and deprojected temperatures in black, are broadly consistent with previous results (Johnstone et al., 2002; Matsushita, 2011). The deprojection model assumes spherical symmetry, which is clearly not accurate for A2199, resulting in fluctuations in the deprojected temperature profile that are unlikely to be real. Nevertheless, the deprojected temperatures are systematically lower than the projected temperatures, as usual, in the cool core. They rise from keV in the cluster center to a peak of keV at a radius of , beyond which they decline slowly. The density profile exhibits a break at associated with the SE edge. There is also structure related to the southwest excess (Fig. 3), although this is obscured by the coarse radial binning in Fig. 5. The metallicity declines from solar at the cluster center to solar at a radius of , also in broad agreement with previous results (Johnstone et al., 2002; Matsushita, 2011).
3.3. Maps of Gas Properties
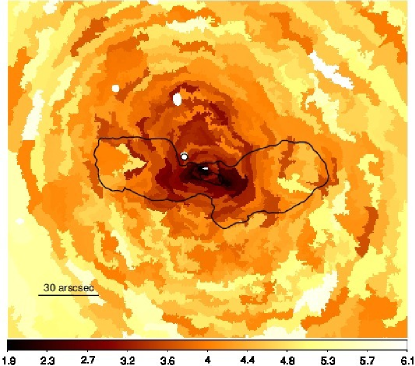
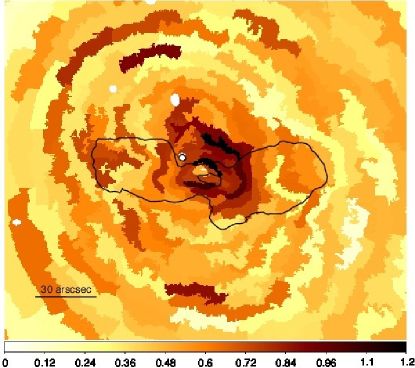
Maps of the gas temperature and metallicity were made using reprocessed data for the four ACIS-I exposures (Table 1). The data were binned into regions, defined using the contour binning algorithm of Sanders (2006) to obtain a specified signal to noise ratio for each region. The ratio between the length and width of each region was constrained by setting the parameter of Sanders (2006) to 2. Spectra were summed and xspec was used to fit them on the 0.5 – 7 keV energy range by minimizing the C-statistic. For the temperature map, the target signal to noise ratio was 32 (1024 counts per region). An apec thermal model, with fixed foreground absorption and free metallicity, was fitted to each spectrum to obtain the temperature map in the left panel of Fig. 6. The color bar there gives the temperature scale in keV. Typical errors range from about near the center of the map to at the periphery. For the metallicity map, the target signal to noise ratio was 49 (2400 counts per region). Fitting the same thermal model as used to obtain the temperature map to the spectra gave the metallicity map in the right panel of Fig. 6. The metallicity scale, which is given relative to the solar abundances of Anders & Grevesse (1989), is shown in the color bar. Typical uncertainties in this map are large, ranging from 18% at the center to 50% at from the center. As discussed in section 3.5, improved spatial resolution combined with the contour binning reveal structure in the temperature and metallicity maps that was not evident in the previous maps of Johnstone et al. (2002).
3.4. VLA Radio Structures
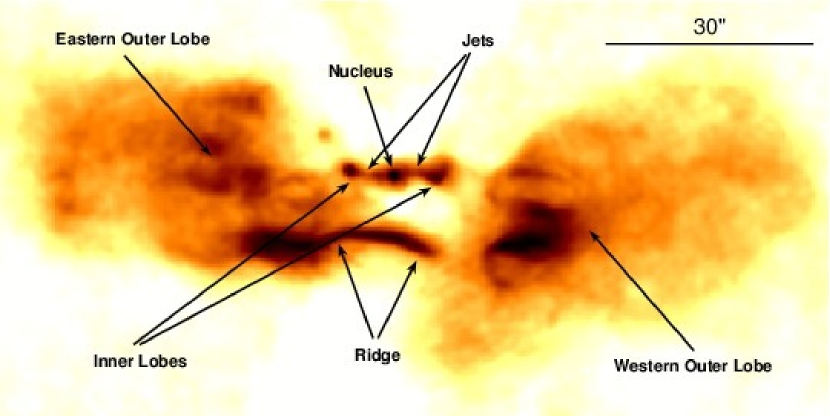
Like many other clusters, groups, and early-type galaxies, the X-ray emitting gas in A2199 shows evidence of outbursts from an AGN located at the peak of its X-ray emission. The radio source 3C 338, which is hosted by NGC 6166, provides clear evidence of outbursts powered by accretion onto a supermassive black hole in the nucleus of NGC 6166. Structures associated with 3C 338 include (Fig. 7; as discussed by Burns et al., 1983; Gentile et al., 2007):
-
•
a bright nucleus
-
•
a two-sided jet with an extent of 15′′
-
•
a pair of inner radio lobes ( from the nucleus) at the ends of the two-sided jet
-
•
two outer radio lobes centered 40′′ from the nucleus
-
•
an unusual “ridge” lying south of the nucleus, first reported by Burns et al. (1983).
The jet is a region of diffuse radio emission linking the nucleus to the two spatially extended inner radio lobes. While the inner lobes are aligned with the outer radio lobes, there is no convincing connection between them in the radio. The radio ridge runs roughly parallel to the jet and appears to connect to the two outer lobes. Burns et al. (1983) argued that the ridge was the result of a dynamical interaction with the ICM. Detailed VLBI as well as VLA radio studies of 3C 338 also are presented by Feretti et al. (1993) and Gentile et al. (2007). Equipartition properties for the inner radio lobes (cavities) and the ridge are given in Table 4. Note that Burns et al. (1983) estimated the minimum pressure of the ridge using , whereas here we use , consistent with the minimum energy condition and a magnetic field that is not well ordered. This accounts for the greater part of the factor of 5 difference between their minimum pressure estimate and ours.
3.5. Core Multi-wavelength Structures
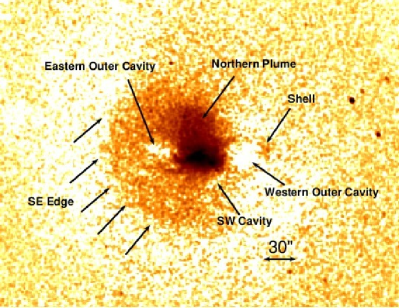
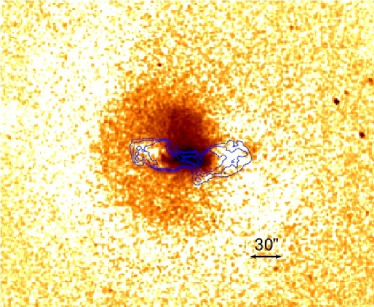
At smaller angular scales, interior to the SE edge (), there is a wealth of substructure apparent in multi-wavelength maps of A2199. To show the relationship between the radio and X-ray features, radio contours are plotted on the residual image in the right panel of Figure 2. The ICM appears highly disturbed in this region. Structures include:
- •
-
•
a filament (“Shell”) partially enclosing the western X-ray cavity
-
•
a third X-ray depression (“SW Cavity”) coincident with a spur of radio emission extending southward from the western outer lobe, first noted by Gentile et al. (2007)
-
•
a plume of emission extending about north from the bright core
The “shell” of enhanced X-ray emission along the periphery of the western outer lobe and hints of a similar feature around the eastern outer lobe can be seen in Figs. 1 and 2. While these features are irregular and not well defined, they do correspond to regions of reduced temperature in the map of Fig. 6.
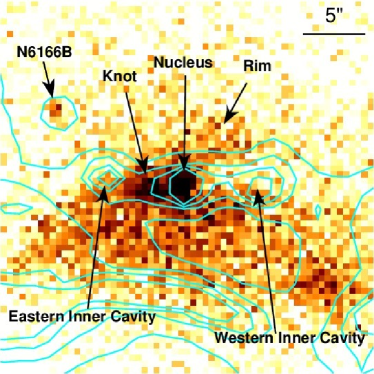
Within the central (Fig. 8), the region with the brightest X-ray emission is roughly triangular in shape, bounded by the jet to the north and by the inner edges of the two outer radio lobes to the east and west, giving it an east-west extent of (Fig. 2). The radio ridge lies over this region, roughly matching its southward curvature. Gas in the region is cool (Figs. 6 and 11). An X-ray deficit coincides with the western inner radio jet, reminiscent of a “tunnel” along the jet path (Clarke et al., 2005). An X-ray bright filament or “rim” lies along the northern edge of the western jet. Along the eastern jet, there is no deficit in the X-ray emission; instead we find a “knot” of enhanced emission located from the X-ray/radio nucleus (0.5 – 8 keV luminosity ; see section 3.5.2). There is marginal evidence of an X-ray cavity (“eastern inner cavity”) east of the knot, coinciding with the eastern inner radio lobe and bounded by enhanced X-ray emission in the south.
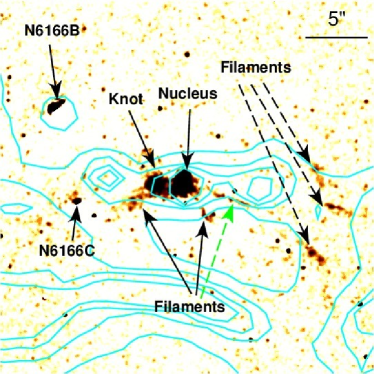
3.5.1 Optical Line-emitting Gas
Cooler gas in the core region of A2199 manifests itself in optical emission lines and dust extinction (Martel et al., 2004). We used archival HST data to reproduce the H image presented in Martel et al. (2004, Fig. 3 therein) and discussed by them in detail. As shown in Fig. 9, there is clumpy H emission at the positions of the nucleus and the X-ray knot, with an extent of in both cases. Several H filaments can also be seen within of the nucleus. In particular, one filament (marked by a green dashed arrow in Fig. 9) appears to follow the southern edge of the western jet. Another three filaments (marked by black dashed arrows in Fig. 9) are located immediately west of the western inner radio lobe, indicating a connection between the inner and outer lobes, although the radio emission itself does not unambiguously show such a connection. We have measured the H luminosity and estimated the corresponding densities and masses of ionized gas for several distinct features, including the nucleus, the knot and the filament apparently following the southern edge of the western jet. Like Martel et al. (2004), we adopt a [N II]/H line ratio of 2, typical of narrow line regions around active nuclei. The results and details of the regions are summarized in Table 5.
The H filaments associated with the inner edge of the western outer radio lobe may be entrained and drawn outward in the flow associated with the radio lobes. They resemble similar features in the line emitting gas seen in the Perseus cluster (Fabian et al., 2003).
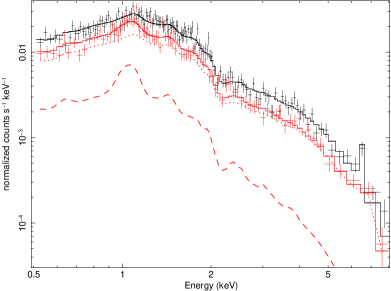
3.5.2 X-ray Spectra of Bright Regions
We extracted X-ray spectra from the “shell”, the “rim”, and the “knot”. All three features either enclose or overlie a volume filled with energetic particles. For each feature, a local background region, immediately adjacent to the source region, was fitted with a thermal model that was scaled, with other parameters fixed, and used to account for emission by overlying gas (region details in Table 6 notes). The excess emission in the source region was then modeled by an additional thermal component. The fit results are summarized in Table 6 and the spectra are shown in Fig. 10. Use of a local background helps to separate the emission of a brighter region from that of surrounding gas. As a result, temperatures in Table 6, notably for the shell, are lower than those at the same location in the temperature map.
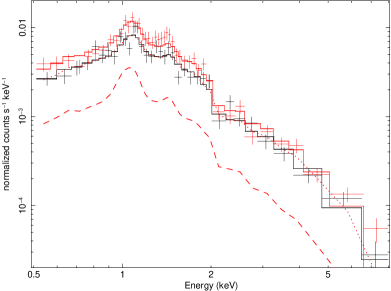
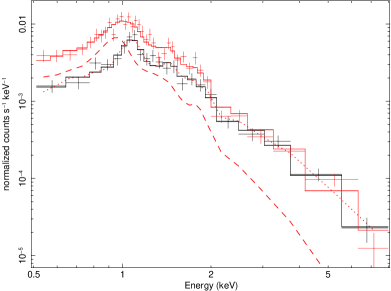

The estimated density for the “shell” is inversely proportional to the square root of its estimated volume, which is a significant source of uncertainty. Nevertheless, the shell is clearly denser than the surrounding gas, since it stands out in the X-ray image (Fig. 2). It is also cooler than other gas surrounding the outer end of the western radio lobe (for which – 4 keV; Fig. 5). Together, these properties show that the shell has lower entropy than the surrounding gas. From Table 6, the entropy index of the “shell” is , whereas for the surrounding gas based on the deprojected temperature and density profiles at (Fig. 5,). As in other cool core clusters hosting radio outbursts, this low entropy has probably been lifted outward with the radio lobes (e.g., Forman et al., 2007; Gitti et al., 2011). Gas with comparable entropy is found at from the cluster center (Fig. 5), suggesting that the gas in the shell originated from within about this radius.
The spectra of the X-ray “knot” in the eastern radio jet are well fitted by a thermal plasma model with a temperature of 1.0 keV; a power-law model is formally excluded (). Compact X-ray features are seen in the jets of a number of Fanaroff-Riley class I radio galaxies (FR I; Fanaroff & Riley, 1974), but these are generally interpreted as synchrotron emission from ultra-relativistic particles created by internal shocks in the jet (Worrall & Birkinshaw, 2006). Also, while the estimated pressure in the knot is roughly twice that for the innermost shell of the deprojection, it is similar to the estimated pressure for the “rim,” so that it is not greatly overpressured compared to other gas at the same radius. The knot’s thermal spectrum, its H counterpart, the lack of a radio counterpart, and its similar pressure to other gas features at the same radius all argue that the knot is a feature of the ICM and not internal to the jet. At the least, it is not greatly affected by the jet. It might be gas stripped from one of the massive early-type galaxies that lie near the center of the cluster.
Although it lies adjacent to the jet, the gas in the “rim” is cooler than gas lying immediately to its north, further from the jet. This largely rules out the possibility that the bright rim consists of gas that has been shocked during recent activity of the radio source. It is more likely to be gas lifted outward in the flow associated with the jets and radio lobes.
3.5.3 Northern Plume
Finally, a “Northern Plume” of enhanced emission extends north of the nucleus. This feature corresponds to a cooler region in the temperature map of Fig. 6. It is less evident due to the larger errors in the abundance map, but still present as a region of enhanced abundances (Fig. 6 right). We extracted spectra for a set of adjacent slices along an axis from south to north through the AGN. The east-west extent of each slice is and their widths are . Each spectrum was fitted with an absorbed apec model. The fitted temperature distribution is shown in Figure 11. While the X-ray brightest regions in the core between the jet and the radio ridge (Fig. 8) have the lowest temperatures of keV, temperatures in the northern plume are systematically lower than temperatures at the same distance to the south of the center, by as much as 0.5 keV. Johnstone et al. (2002) suggested that the northern plume is a cooling wake left behind the moving core. However, the cooling time of gas 40” north of the AGN comfortably exceeds 1 Gyr, whereas the free-fall time from there to the AGN is less than 100 Myr. Thus, the transient impact of the moving cD occurs on a timescale that is an order of magnitude shorter than the gas cooling time, making its effect on gas cooling minor. By contrast, the cooling time of the gas within 3” of the AGN (Fig. 5) is an order of magnitude shorter than that of the gas at 40”, making the inner gas far more prone to cooling. This is difficult to reconcile with a cooling wake and we do not consider that possibility any further. In section 4.1 we suggest this feature is due to sloshing of the core gas (Markevitch et al., 2003).

3.6. The Nucleus
The X-ray nucleus and the underlying accretion onto the central supermassive black hole of NGC 6166 have been studied by Di Matteo et al. (2001). Our deep observations allow us to better constrain the spectral properties of the nucleus, as well as the circumnuclear gas. We extracted spectra from the central for individual observations. A model consisting of a power-law for the AGN plus an apec thermal spectrum for the emission from the circumnuclear hot gas was used to fit the spectra. Since no statistically significant flux or spectral variation was found between the observations, all six spectra were fitted jointly, giving an acceptable fit with a photon-index of , a gas temperature of keV, and an absorption column of . We estimate an 0.5 – 8 keV intrinsic luminosity of for the nucleus, and a density of for the circumnuclear gas. The cooling time of this gas is very short, at Myr, supporting the case for AGN feedback in A2199. However, since it is more than an order of magnitude longer than the dynamical time, the gas can remain hydrostatic and we should not expect catastrophic cooling.
4. The Physical Origin of X-ray and Radio Structures in A2199 – Gas Sloshing and AGN Outbursts
Here we discuss the origin of several features as the products of large scale sloshing and outbursts from the AGN in NGC 6166.
4.1. Large Scale Gas Sloshing
The most prominent large scale feature is excess emission to the southwest and west of the cluster center (Figs. 3 and 4). The most plausible cause of asymmetries on such a large scale, kpc, is merging activity. In the absence of an obvious remnant gas core, these features are most likely to be the response of the cluster gas to an infalling subcluster, as found in many other clusters and demonstrated by simulations (see review of Markevitch & Vikhlinin, 2007). We refer to such effects as sloshing.
Although on a considerably smaller scale, the other feature that is strongly suggestive of gas sloshing is the dense, cool, northern plume (Figs. 2 & 11). Simulations show that sloshing leads to the formation of contact discontinuities in the gas, i.e., cold fronts, where the pressure is continuous, but there is an abrupt change in the density (e.g., Ascasibar & Markevitch, 2006; ZuHone et al., 2010; Roediger et al., 2011). The cold fronts are embedded in a larger scale, spiral shaped density enhancement that can extend much further than the fronts from the center of the perturbed cluster. The northern plume is roughly consistent with such a spiral density enhancement, seen approximately edge on. Its orientation and scale suggest that it could well be part of the same disturbance as the southwest excess. If so, we are viewing A2199 from close to the plane of the orbit of the perturber. In this geometry, the temperature and brightness profiles of the front are sensitive to the viewing direction. Nevertheless, the temperature and brightness of the plume are broadly consistent with sloshing simulations.
The plume ends abruptly kpc north of the cluster center. Roediger et al. (2011) find that the outermost sloshing cold front moves outward at a nearly constant speed of , where is the local sound speed. If the outer edge of the northern plume is the outermost sloshing cold front, then it can provide an estimate of the time since the perturber passed through the core of A2199. For a distance of 28 kpc and a local gas temperature of 3.3 keV, the age would be yr. While the lopsided appearance of the northern plume supports its interpretation as a sloshing cold front, since we are viewing the sloshing spiral nearly edge on, we cannot tell if the edge of the plume is the outermost cold front. Despite this, based on the simulations, the unknown geometry contributes no more than 50% uncertainty, comparable to the systematic uncertainty in our estimate for the speed of the front (which is based on a limited set of simulations). This age estimate exceeds those for the radio outburst that produced the shock by an order of magnitude (see section 4.2.3), so we can be confident that the shock is more recent.


4.1.1 Sloshing and the Radio Ridge
The morphology of the radio ridge is very suggestive of an old radio jet that has become detached from the AGN in NGC 6166 (Fig. 7; Burns et al., 1983). This could be a result of sloshing. Since the radio plasma is effectively weightless, in the presence of sloshing, it is expected to move with the ICM. The gas within about 10” south of the AGN is brighter (Fig. 8), so clearly denser, and also cooler (Fig. 11) than the gas to the north, so it has lower entropy. In equilibrium, the lowest entropy gas should be centered on the AGN. The southward displacement of the low entropy gas on much the same scale as the radio ridge is consistent with the ridge simply moving along with the gas (Fig. 8). It is remarkable that the “jet” could survive being swept away from the AGN largely intact, which requires the gas flow to be laminar. Burns et al. (1983) have discussed some other challenges for the interpretation of this feature as the remnant of a jet. One such constraint is the synchrotron lifetime of the electrons radiating at 5 GHz, which is Myr for the “equipartition” magnetic field of (Table 4). Since the projected separation of the ridge and the AGN is kpc, the mean speed of the ridge relative to the AGN would need to exceed for the emitting electrons to survive the trip. While this speed is implausibly fast for sloshing, speeds a factor of smaller are more reasonable. Furthermore, motion of the galaxy excited along with the sloshing could boost the speed of the AGN relative to the gas (Ascasibar & Markevitch, 2006). The magnetic field in the ridge may also be small enough to be consistent with a lower speed. Typical of FR I radio sources, the equipartition pressures for the radio features given in Table 4 are more than an order of magnitude smaller than the pressure in the ICM at kpc from the AGN, leaving latitude for substantial departures from equipartition and allowing magnetic field strengths significantly smaller than .
4.2. Southeastern Edge
The next prominent feature interior to the large scale asymmetry is the southeastern (SE) edge, seen in Figs. 1 and 3 at a distance of from the center of A2199 and discussed by Johnstone et al. (2002) and Sanders & Fabian (2006). Fig. 2 shows an enlarged view of the core. To understand the origin of the SE edge, we extracted spectra from a set of sectors across the edge, which span an azimuthal range of 30∘-180∘ (east from north). The xspec projct model was used to derive the density and temperature profiles (Fig. 12). Across the SE edge, the gas density decreases by a factor of , whereas the gas temperature exhibits no significant change, suggesting a pressure ratio across the front of . These values rely on assuming that the gas distribution is spherically symmetric, a source of systematic error that could affect the following discussion. We consider three possible origins for this feature — 1) a classical cold front created by the remnant core from a merger, 2) a sloshing cold front and 3) a shock front. As discussed below, although we prefer the shock interpretation, both a sloshing cold front and a shock front could be consistent with the observations and have some supporting evidence.
4.2.1 Remnant Core Cold Front
A remnant core cold front (e.g., like that in A3667, Vikhlinin et al., 2001) occurs at the contact discontinuity between low entropy gas from the remnant core of a merging cluster or group and the ICM. This would account for the higher gas density interior to the front. However, at a simple contact discontinuity we should expect to find pressure equilibrium, which would require the gas temperature to be a factor of higher on the low density side of the front, which it clearly is not. If we disregard the first data point beyond in Fig. 12, it might be argued that the temperature is declining outside the front, in which case the temperature at the front might be as high as keV. Nevertheless, it is difficult to argue that the temperature on the outside of the front is high enough ( keV) to make the pressures equal on either side of the front. Certainly, the data are not easy to reconcile with the pressure being continuous at this front.
There are other issues for such a model. The SE edge does not resemble other well known examples of remnant core cold fronts. For example, the front in A3667 subtends an angle at the center of the remnant core of no more than about (compared to more like for A2199), beyond which the low entropy gas is truncated (Owers et al., 2009). The front associated with the higher speed remnant core of the Bullet cluster, 1E0657-558, has a well-defined head and a flared tail, nothing like the nearly spherical front here (Markevitch, 2006). In addition, the core of a merging group or cluster moving through A2199 would be expected to dramatically alter the fine radio structure seen in Fig. 7. The outer (and inner) radio lobes appear relatively undisturbed and roughly symmetrical. It is difficult to see how the transonic or supersonic passage of a core, the size of the observed front, could be consistent with the observed radio features. To be so little disturbed by the associated gas flows, the lobes would need to have expanded recently and supersonically, in which case we should expect to find prominent shocks closely enveloping them.
4.2.2 Sloshing Cold Front
A sloshing cold front appears more viable than a remnant core cold front, but is also problematic. Like remnant core cold fronts, the pressure should be continuous across sloshing cold fronts (e.g., for A1795, Markevitch et al., 2001). As argued in the preceding section, the pressure might be continuous if the temperature is rising inward beyond the front (as one approaches the front from the east), which might allow the interpretation as a cold front. While it would be unusual to have the temperature rising inward at such small radii, this could be a consequence of gas sloshing. However, the first temperature point beyond the edge in Fig. 12 remains a problem for this interpretation with a simple geometry.
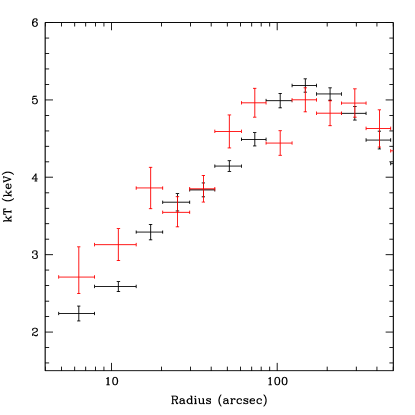
Figure 13 compares profiles of the projected gas temperature, in black for the southeast sector, in the azimuthal range to , where the SE edge is most prominent, and in red for the northwest sector, to , where the edge at is least evident. The relatively lower temperatures from – in the southeast sector compared to the northwest sector are broadly consistent with the alternating patterns of entropy and temperature produced by sloshing (Ascasibar & Markevitch, 2006; ZuHone et al., 2010; Roediger et al., 2011). Set against this, the edge is abnormally round and extends over at least in azimuth (Fig. 2), unlike other observed or simulated sloshing fronts.
As discussed above (Fig. 2, §4.1, and §4.1.1), the northern “plume” and radio ridge are consistent with significant gas sloshing in the core region (), particularly when coupled with the larger scale southwest excess. The SE edge is roughly twice as far from the cluster center as the end of the northern plume. While an aspherical potential could distort sloshing cold fronts away from a common plane, the center of the SE edge is roughly away from the axis defined by the southwestern enhancement and the northern plume, making it improbable that these features were generated by the same perturbation. Thus, if the SE edge is the result of sloshing, there would need to have been multiple merger events. This raises no immediate issues. In fact, although they are unlikely to be the product of either merger event, the well-known multiple nuclei of NGC 6166 (including NGC 6166A, B, C and D; Lauer, 1986), seen in projection within the central 50 kpc, are consistent with a high rate of infall in this system. Of course, for a merger to cause the SE edge, it would be further in the past than that responsible for the northern plume.
4.2.3 Supermassive Black Hole Driven Shock
The third alternative for the origin of the SE edge is a shock driven by an outburst from the AGN in NGC 6166. Sanders & Fabian (2006) highlighted the complex temperature properties associated with this prominent feature and argued that they are best explained by an isothermal shock. There is clear evidence for AGN outbursts that might have driven a shock, with the radio lobes and jet excavating cavities in the ICM (Figs. 1, 2, and 7). The relationship between the radio and X-ray features can be seen in the residual image of Fig. 2. This image shows that the outer radio lobes and the SE edge have comparable scales. However, if the shock was initiated by the radio lobes, it is now well enough detached from them that they are no longer effective in driving the shock.
The deeper data here generally confirm the observational results of Sanders & Fabian (2006). The density jump is clear but there is no obvious temperature jump (Fig. 12). A density jump of 1.66 would require a Mach number of 1.46 for a conventional shock in “monatomic” gas (ratio of specific heats ). Uncertainties in the deprojected gas properties are dominated by the assumption of spherical symmetry, since the statistical uncertainties are relatively small. The inferred Mach number would imply a temperature jump of about 1.45, but this is smoothed and reduced when projected onto the sky. For example, for the model used to estimate the shock energy below, the peak of the emission measure weighted temperature is 1.18 times the preshock temperature and it occurs behind the shock if the unshocked gas is isothermal. Binning reduces the temperature peak further. No temperature jump is seen, but the temperature structure of A2199 is complex and the location of the shock at a radius of makes detection of the jump difficult (Fig. 12, left panel). First, in contrast to the monotonically declining density distribution, there is substructure in the gas temperature. Within of the cluster center, any temperature jump would be superposed on the rising temperature profile of the cool core in A2199. This tends to mask a temperature jump, as found for a shock surrounding M87 in the Virgo cluster (Forman et al., 2007). By contrast, since the sense of the temperature jump is the opposite for a cold front, the temperature gradient would tend to enhance that. The location of the density jump in A2199 would place the temperature jump just at the radius of the transition from a rising to a flat temperature profile (Fig. 5). Second, we cannot know the initial temperature profile into which the shock was driven, leaving the temperature baseline unknown — except by inference from models. Similar difficulties have been encountered in measuring the temperature profile of the shock in Hydra A, where temperatures are affected by the presence of low entropy gas lifted outward by the AGN outbursts (Gitti et al., 2011). Even for the clearest case of a shock in the very well observed Perseus cluster, no temperature jump has been detected and it remains unclear why (Graham et al., 2008; Russell et al., 2008).
A2199 shows clear evidence of both repeated AGN outbursts and gas sloshing resulting from mergers. The complexities these disturbances create in its gas distribution may mask the temperature jump that should accompany the density jump under a shock interpretation. The gas distribution has aspherical substructure on scales smaller and larger than . For example, the slope of the temperature profile steepens beyond a radius of , within which temperatures are affected by the cool northern plume and low entropy gas lifted by the radio lobes. Sanders & Fabian (2006) argued that the shock is isothermal, but, while this is consistent with existing data, it is not required to explain the lack of a clear jump in a system as complex as A2199.
Like Hydra A, for example (Wise et al., 2007), the outburst in Abell 2199 may have created multiple cavities. The shock in Hydra A closely envelopes its outer radio lobes (Nulsen et al., 2005), which were only revealed to be cavities in very deep X-ray images. Viewed from a direction more nearly aligned with its radio axis, the outer cavities of Hydra A would be projected onto the bright cluster center and the inner cavities, making the outer cavities very difficult to detect. This would create the appearance of a system like A2199, with shocks detached from the cavities. The radius of curvature of the part of the shock front we would then see in Hydra A is also considerably larger than its distance from the AGN. This increases its impact on the surface brightness, so that, viewed from this direction, the shocks would also appear stronger, causing us to overestimate the associated temperature jump. Although the outer radio lobes of Hydra A are evident at 300 MHz (Lane et al., 2004), this is not so at 1.4 GHz, reminding us that the outer radio lobes may also be “ghosts” at accessible radio frequencies. By this analogy, if the edge in Abell 2199 is a shock, then we may well expect to find low frequency radio emission on larger scales than the radio lobes discussed here.
The energy needed to drive a Mach 1.46 shock to a radius of in A2199 can be estimated using a simple spherical shock model. The physical model employed here is of a gasdynamic shock initiated by depositing energy instantaneously at the center of an atmosphere that was initially hydrostatic and isothermal, with a power-law density profile (e.g, Nulsen et al., 2005). Matching the density profile outside the shock and the density jump at the shock requires a shock energy of erg and gives an age of Myr, implying a mean power of . For comparison, we can estimate the energy needed to create the two large X-ray cavities. The principle semi-axes of an ellipse matching the eastern cavity are kpc and those for the western cavity are kpc. The cavity centers are from the cluster center, where the deprojection gives a pressure of (for keV and , Figure 5). The total enthalpy of the two cavities is then erg, similar to the value obtained by Rafferty et al. (2006) using poorer data (our cavity volumes are estimated as the geometric mean of the volumes for prolate and oblate ellipsoids, as in Rafferty et al., 2006). While our fitted ellipses do not cover all the regions with an X-ray deficit, they do generously cover the bulk of them, so that our enthalpy estimate is unlikely to be very low. It is more than an order of magnitude smaller than the shock energy, arguing against the putative shock being driven by the current radio outburst. Under adiabatic expansion, the internal energy of a cavity is proportional to , where is the volume and is the ratio of specific heats in the cavity. A radio lobe dominated by relativistic gas () would have to expand by a factor of 10 in radius to lose 90% of its internal energy to its surroundings, i.e., the shock. If the shock was launched by the outer radio lobes, the jet that inflated the lobes must have shut down long ago, so that, while it was on, the jet power would have been considerably larger than the estimated mean of from above. In the absence of other evident cavities that could have driven the shock, this may be a weakness of the shock interpretation.
Note that age estimate of Myr from the explosive shock model is likely to be low. Injecting all of the energy at the initial time in the explosive model maximizes the cavity pressure, hence the shock speed, at early times. In more realistic models, the shock is driven by continuous energy injection, reducing cavity pressures and the shock speed. For example, if the shock speed was constant at its current value of , the age of the shock would be closer to 37 Myr. The true age could be even longer, since this does not allow for the temperature decline to the cluster center. For comparison, the sound crossing time to the centers of the outer radio lobes at is Myr. These estimates place some constraint on the radio based age estimates for this source (Gentile et al., 2007).
As discussed above, cold fronts created by sloshing or by remnant cores are highly asymmetric and generally subtend relatively small angles at the cluster center. An additional argument in support of the shock interpretation for the SE edge is its rather large azimuthal extent. Fig. 2 and Fig. 1 left panel of Sanders & Fabian (2006) show the feature extending over at least 180∘. Although the radius and strength of the feature are not constant, this could be explained by asymmetries in the pre-shock gas distribution (i.e., cluster “weather,” e.g., Morsony et al., 2010). The shock speed is modulated by local gas motions, so that turbulence can produce small scale structure in an otherwise spherical shock front, smearing out the front when it is projected onto the sky. As shown in the Appendix (equation A5), turbulence with RMS speed and coherence length causes RMS radial displacements in a shock front at radius of roughly , where is the shock speed. Simulations find typical turbulent velocities in the range 100 – (e.g. Lau et al., 2009), roughly consistent with observations (e.g. de Plaa et al., 2012; Sanders & Fabian, 2013), with plausible values of the coherence length (Rebusco et al., 2005) and scaling with (equation A7). For and , this gives displacements at of , so that moderate levels of turbulence can have a marked smearing effect. If the SE edge is a shock, the indistinct appearance of the front to the northwest would then imply that the turbulence is greater there than on the opposite side of the cluster center.
In conclusion, while the shock interpretation of the SE edge is not without its problems, we see it as the most viable interpretation of the observations.
4.3. The AGN Outburst
While NGC 6166 hosts an active radio nucleus (Gentile et al., 2007), there are several indications that the large scale radio source is not as active now as it has been. As discussed in §4.2.3, the SE edge is well detached from the radio lobes and there are no signs of shocks closer to the lobes. In particular, the thin shell of dense gas around parts of the western outer radio lobe is significantly cooler than the ambient gas at the same distance, , from the nucleus, with keV (Table 6) compared to keV for the ambient gas (Figure 5). With a lower temperature and higher density than surrounding gas, this gas has a lower entropy. As for similar systems like Hydra A (Nulsen et al., 2002) and Virgo (Forman et al., 2005), the low entropy gas would have been lifted to its present location in the outflow accompanying the radio outburst. The lack of shocks close to the radio lobes now shows that the lobes are expanding subsonically, whereas a considerably more powerful outburst would have been needed to drive the Mach shock that best accounts for the SE edge.
Smaller scale structure associated with the jets confirms this view. Since the current radio jets appear to be disconnected from the outer radio lobes, the lobes may be a remnant of an earlier outburst, while the jets and inner radio lobes are powered by more recent activity. From §4.2.3, the enthalpy of the outer lobes is erg and the sound crossing time to the the center of these lobes is yr, giving a mean jet power to form these lobes of . If a comparable power was being injected into the central of the cluster, it would double the thermal energy in Myr. This is several times smaller than the sound crossing time to of Myr, showing that such a powerful jet, if confined to the inner , would drive strong shocks into the surrounding gas. The dense rim to the north of the western jet, at a temperature of keV (Table 6), is no hotter than surrounding gas (Figure 5), so it cannot have been subject to a recent strong shock. Nor are there any other signs of shocks in this region. Being so small, estimates like those of §4.2.3 for the enthalpy of the eastern inner lobe are 3 orders of magnitude smaller than for the outer lobes.
Assuming that the SE edge is a shock, we argued in §4.2.3 that it was produced by a significantly more powerful outburst than that which produced the current outer radio lobes and cavities. The arguments of this section imply that the jet power now is substantially smaller than the mean power required to create those features. If the jet does not penetrate beyond the inner radio lobes, to explain the lack of strong shocks near the inner radio lobes requires the power of the jet now to be more than an order of magnitude smaller than the mean power while inflating the outer radio lobes. This implies that the jet power (averaged on time scales of Myr) has decreased by 2 orders of magnitude or more since the outburst that produced the shock front (cf. Wise et al., 2007).
5. Summary and Conclusions
Deep Chandra data for A2199 reveal complex interactions between radio outbursts from the AGN in NGC 6166 and gas sloshing induced by past merger activity. Radio jets from the AGN have excavated cavities in the X-ray emitting intracluster gas up to 20 – 30 kpc in diameter and lifted low entropy gas 30 – 40 kpc from the cluster center. The new data are consistent with previous results that interpret a surface brightness feature from the AGN, most evident to the southeast, as a Mach 1.46 shock front driven by an AGN outburst. However, we still lack clear evidence of the expected jump in the gas temperature. Our estimated range for the age of the shock is 25 – 37 yr and the energy required to drive it is about erg.
A2199 also shows signatures of gas sloshing induced by merger activity. The two clearest signs are excess X-ray surface brightness southwest of the the cluster center and a plume of enhanced X-ray emission from low entropy, enriched gas that extends north of the center. These resemble spiral enhancements in surface brightness found in other clusters and in simulations of sloshing induced by minor mergers, as viewed from roughly the plane of the merger orbit. We estimate the time since the core passage that excited these features as approximately 400 Myr, making them much older than the shock. The unusual radio ridge of 3C 338 is associated with low entropy gas lying to the south of the center of A2199. This is consistent with the ridge being the remnant of a former radio jet, swept southward from the AGN by sloshing gas. Such an interpretation requires the magnetic field in the ridge to be somewhat less than our simple equipartition estimate of . It also requires the flow of the sloshing gas to be laminar.
The putative shock is well detached from the outer radio lobes and the energy required to produce it is an order of magnitude greater than the enthalpy of the outer lobes. This suggests that the shock originated in an earlier outburst than the radio lobes. There is no clear connection between the radio jets on scales less than and the outer lobes. If the jets do not currently penetrate beyond the inner radio lobes, – from the AGN, then the absence of strong shocks in this region requires the jet power be some two orders of magnitude smaller now than it was when the southeast shock was formed. A2199 is another cluster central radio galaxy showing evidence of large excursions in jet power on Myr timescales (e.g., Wise et al., 2007; Randall et al., 2011).
References
- Anders & Grevesse (1989) Anders, E. & Grevesse, N. 1989, Geochim. Cosmochim. Acta, 53, 197
- Ascasibar & Markevitch (2006) Ascasibar, Y. & Markevitch, M. 2006, ApJ, 650, 102
- Burke & Graham-Smith (2009) Burke, B. F. & Graham-Smith, F. 2009, An Introduction to Radio Astronomy (Cambridge: Cambridge University Press)
- Burns et al. (1983) Burns, J. O., Schwendeman, E., & White, R. A. 1983, ApJ, 271, 575
- Cavagnolo et al. (2009) Cavagnolo, K. W., Donahue, M., Voit, G. M., & Sun, M. 2009, ApJS, 182, 12
- Clarke et al. (2005) Clarke, T. E., Sarazin, C. L., Blanton, E. L., Neumann, D. M., & Kassim, N. E. 2005, ApJ, 625, 748
- de Plaa et al. (2012) de Plaa, J., Zhuravleva, I., Werner, N., Kaastra, J. S., Churazov, E., Smith, R. K., Raassen, A. J. J., & Grange, Y. G. 2012, A&A, 539, A34
- de Vaucouleurs et al. (1991) de Vaucouleurs, G., de Vaucouleurs, A., Corwin, Jr., H. G., Buta, R. J., Paturel, G., & Fouque, P. 1991, Third Reference Catalogue of Bright Galaxies, ed. de Vaucouleurs, G., de Vaucouleurs, A., Corwin, H. G., Jr., Buta, R. J., Paturel, G., & Fouque, P.
- Di Matteo et al. (2001) Di Matteo, T., Johnstone, R. M., Allen, S. W., & Fabian, A. C. 2001, ApJ, 550, L19
- Fabian et al. (2003) Fabian, A. C., Sanders, J. S., Crawford, C. S., Conselice, C. J., Gallagher, J. S., & Wyse, R. F. G. 2003, MNRAS, 344, L48
- Fanaroff & Riley (1974) Fanaroff, B. L. & Riley, J. M. 1974, MNRAS, 167, 31P
- Feretti et al. (1993) Feretti, L., Comoretto, G., Giovannini, G., Venturi, T., & Wehrle, A. E. 1993, ApJ, 408, 446
- Forman & Jones (1982) Forman, W. & Jones, C. 1982, ARA&A, 20, 547
- Forman et al. (2007) Forman, W., Jones, C., Churazov, E., Markevitch, M., Nulsen, P., Vikhlinin, A., Begelman, M., Böhringer, H., Eilek, J., Heinz, S., Kraft, R., Owen, F., & Pahre, M. 2007, ApJ, 665, 1057
- Forman et al. (2005) Forman, W., Nulsen, P., Heinz, S., Owen, F., Eilek, J., Vikhlinin, A., Markevitch, M., Kraft, R., Churazov, E., & Jones, C. 2005, ApJ, 635, 894
- Gentile et al. (2007) Gentile, G., Rodríguez, C., Taylor, G. B., Giovannini, G., Allen, S. W., Lane, W. M., & Kassim, N. E. 2007, ApJ, 659, 225
- Gitti et al. (2011) Gitti, M., Nulsen, P. E. J., David, L. P., McNamara, B. R., & Wise, M. W. 2011, ApJ, 732, 13
- Graham et al. (2008) Graham, J., Fabian, A. C., & Sanders, J. S. 2008, MNRAS, 386, 278
- Johnstone et al. (2002) Johnstone, R. M., Allen, S. W., Fabian, A. C., & Sanders, J. S. 2002, MNRAS, 336, 299
- Lane et al. (2004) Lane, W. M., Clarke, T. E., Taylor, G. B., Perley, R. A., & Kassim, N. E. 2004, AJ, 127, 48
- Lau et al. (2009) Lau, E. T., Kravtsov, A. V., & Nagai, D. 2009, ApJ, 705, 1129
- Lauer (1986) Lauer, T. R. 1986, ApJ, 311, 34
- Markevitch (2006) Markevitch, M. 2006, in ESA Special Publication, Vol. 604, The X-ray Universe 2005, ed. A. Wilson, 723
- Markevitch et al. (2000) Markevitch, M., Ponman, T. J., Nulsen, P. E. J., Bautz, M. W., Burke, D. J., David, L. P., Davis, D., Donnelly, R. H., Forman, W. R., Jones, C., Kaastra, J., Kellogg, E., Kim, D.-W., Kolodziejczak, J., Mazzotta, P., Pagliaro, A., Patel, S., Van Speybroeck, L., Vikhlinin, A., Vrtilek, J., Wise, M., & Zhao, P. 2000, ApJ, 541, 542
- Markevitch & Vikhlinin (2007) Markevitch, M. & Vikhlinin, A. 2007, Phys. Rep., 443, 1
- Markevitch et al. (2003) Markevitch, M., Vikhlinin, A., & Forman, W. R. 2003, in Astronomical Society of the Pacific Conference Series, Vol. 301, Astronomical Society of the Pacific Conference Series, ed. S. Bowyer & C.-Y. Hwang, 37
- Markevitch et al. (1999) Markevitch, M., Vikhlinin, A., Forman, W. R., & Sarazin, C. L. 1999, ApJ, 527, 545
- Markevitch et al. (2001) Markevitch, M., Vikhlinin, A., & Mazzotta, P. 2001, ApJ, 562, L153
- Martel et al. (2004) Martel, A. R., Ford, H. C., Bradley, L. D., Tran, H. D., Menanteau, F., Tsvetanov, Z. I., Illingworth, G. D., Hartig, G. F., & Clampin, M. 2004, AJ, 128, 2758
- Matsushita (2011) Matsushita, K. 2011, A&A, 527, A134
- Morsony et al. (2010) Morsony, B. J., Heinz, S., Brüggen, M., & Ruszkowski, M. 2010, MNRAS, 407, 1277
- Nulsen et al. (2002) Nulsen, P. E. J., David, L. P., McNamara, B. R., Jones, C., Forman, W. R., & Wise, M. 2002, ApJ, 568, 163
- Nulsen et al. (2005) Nulsen, P. E. J., McNamara, B. R., Wise, M. W., & David, L. P. 2005, ApJ, 628, 629
- Owen & Eilek (1998) Owen, F. N. & Eilek, J. A. 1998, ApJ, 493, 73
- Owers et al. (2009) Owers, M. S., Couch, W. J., & Nulsen, P. E. J. 2009, ApJ, 693, 901
- Rafferty et al. (2006) Rafferty, D. A., McNamara, B. R., Nulsen, P. E. J., & Wise, M. W. 2006, ApJ, 652, 216
- Randall et al. (2011) Randall, S. W., Forman, W. R., Giacintucci, S., Nulsen, P. E. J., Sun, M., Jones, C., Churazov, E., David, L. P., Kraft, R., Donahue, M., Blanton, E. L., Simionescu, A., & Werner, N. 2011, ApJ, 726, 86
- Rebusco et al. (2005) Rebusco, P., Churazov, E., Böhringer, H., & Forman, W. 2005, MNRAS, 359, 1041
- Roediger et al. (2011) Roediger, E., Brüggen, M., Simionescu, A., Böhringer, H., Churazov, E., & Forman, W. R. 2011, MNRAS, 413, 2057
- Russell et al. (2008) Russell, H. R., Sanders, J. S., & Fabian, A. C. 2008, MNRAS, 390, 1207
- Sanders (2006) Sanders, J. S. 2006, MNRAS, 371, 829
- Sanders & Fabian (2006) Sanders, J. S. & Fabian, A. C. 2006, MNRAS, 371, L65
- Sanders & Fabian (2013) —. 2013, MNRAS, 429, 2727
- Siddiqui et al. (1998) Siddiqui, H., Stewart, G. C., & Johnstone, R. M. 1998, A&A, 334, 71
- Vikhlinin et al. (2001) Vikhlinin, A., Markevitch, M., & Murray, S. S. 2001, ApJ, 551, 160
- Wang (2004) Wang, Q. D. 2004, ApJ, 612, 159
- Wise et al. (2007) Wise, M. W., McNamara, B. R., Nulsen, P. E. J., Houck, J. C., & David, L. P. 2007, ApJ, 659, 1153
- Worrall & Birkinshaw (2006) Worrall, D. M. & Birkinshaw, M. 2006, in Lecture Notes in Physics, Berlin Springer Verlag, Vol. 693, Physics of Active Galactic Nuclei at all Scales, ed. D. Alloin, 39
- ZuHone et al. (2010) ZuHone, J. A., Markevitch, M., & Johnson, R. E. 2010, ApJ, 717, 908
Appendix A Effect of Turbulence on a Shock Front
The detailed effects of turbulent motion on the propagation of a shock front are complex, but our purpose is only to estimate the size of deviations from a spherical shock front. For that purpose, it is sufficient to ignore all but the first order effects of turbulent velocities on the radial velocity of the shock. If the component of the turbulent velocity is , then the velocity of a shock propagating along the axis is changed by approximately . To first order in , this causes a shock front that would have reached to be displaced by
| (A1) |
where is the unperturbed shock speed, assumed constant to keep the argument simple. We also ignore the time dependence of , on the assumption that the shock is much faster than . If the mean turbulent speed is zero, then the variance of is
| (A2) |
where is the time average and . Reversing the order of integration, this becomes
| (A3) |
For the purpose of estimating , we assume that the turbulence is homogeneous and isotropic (on the scale of interest), so that the autocorrelation of the component of the turbulent velocity, , does not depend on . The integration then gives and isotropy implies is even in , so that
| (A4) |
Now , where is the RMS turbulent speed and on scales, , larger than some coherence length for the turbulence. Assuming that the coherence length of the turbulence is small compared to , we get
| (A5) |
which is known as an integral scale length for the turbulent velocity, is a measure of the coherence length of the turbulence. A similar estimate is obtained simply by assuming that the front passes through a number independent regions with RMS velocities , so that the RMS deviation in the speed of the shock front as it propagates to is . Displacements, , in the shock front will also be correlated on scales up to .
Because turbulence in the ICM is generally driven by large scale processes (mergers, AGN outbursts, etc.), will tend to be as large as possible. For subsonic turbulence, the upper limit on is generally set by gravity, which opposes the turnover of large eddies. In a stably stratified atmosphere, the force per unit mass opposing the radial displacement from equilibrium of a small fluid element by is , where the Brunt-Väisälä frequency, , is given by
| (A6) |
Here, is the ratio of specific heats for the ICM, is the entropy index (section 3.5), is the acceleration due to gravity, and is the speed of circular orbits. Equating the radial part of the turbulent kinetic energy per unit mass, , to the maximum potential energy per unit mass, , gives the largest radial size of a turbulent eddy,
| (A7) |
Typical values of are about unity (e.g., Cavagnolo et al., 2009). In practice, is somewhat smaller than , but it should scale as indicated by equation (A7).
| ObsID | Date | Exposure | RA | DEC | Roll | Detector | MODE |
|---|---|---|---|---|---|---|---|
| (1) | (2) | (3) | (4) | (5) | (6) | (7) | (8) |
| 498 (catalog ADS/Sa.CXO#obs/00498) | 1999-12-11 | 16.2 | 247.18789 | 39.55308 | 11.3 | 7 | Faint |
| 497 (catalog ADS/Sa.CXO#obs/00497) | 2000-05-13 | 18.8 | 247.13518 | 39.55900 | 162.3 | 7 | Faint |
| 10804 (catalog ADS/Sa.CXO#obs/10804) | 2009-06-23 | 18.0 | 247.13280 | 39.53847 | 205.6 | 0123 | VFaint |
| 10803 (catalog ADS/Sa.CXO#obs/10803) | 2009-11-17 | 28.6 | 247.19133 | 39.54714 | 345.2 | 0123 | VFaint |
| 10748 (catalog ADS/Sa.CXO#obs/10748) | 2009-11-19 | 37.7 | 247.19134 | 39.54714 | 345.2 | 0123 | VFaint |
| 10805 (catalog ADS/Sa.CXO#obs/10805) | 2009-11-23 | 25.2 | 247.19171 | 39.54967 | 351.1 | 0123 | VFaint |
Note. — (1) Observation ID; (2) Date of observation; (3) Effective exposure, in ks; (4) & (5) Celestial coordinates of the aimpoint; (6) Roll angle in degrees; (7) CCDs used in this work; (8) ACIS data mode.
| d | |||||||
|---|---|---|---|---|---|---|---|
| 0.48 | 0.80 | ||||||
| 0.51 | 0.80 | ||||||
| 0.54 | 0.80 | ||||||
| 0.57 | 0.81 |
Note. — aFitted with a 2-dimensional beta-model: , where ; bInner and outer radii of the fitted region; cOffset of beta model center from the X-ray nucleus; dPosition angle, eastward of north.
| Program code | Observation date | Configuration | Frequency | Beam size | Noise |
|---|---|---|---|---|---|
| (GHz) | () | ||||
| AG269 | 04-JUL-1988 | B | 4.89 GHz | 3.35 | |
| AG357 | 02-JAN-1993 | A | 1.49 GHz | 214 |
| Region | Sizea | b | c | ||||
|---|---|---|---|---|---|---|---|
| (arcsec2) | (mJy) | () | (G) | () | ( yr) | ||
| Western Inner Lobe | 1.3 | -1.0 | 2.5 | 21.0 | 1.4 | 5.5 | |
| Eastern Inner Lobe | 1.6 | -1.1 | 3.1 | 22.2 | 1.6 | 5.0 | |
| Ridge | 153 | 16.3 | -1.3 | 31.5 | 18.0 | 1.0 | 7.6 |
Note. — aThe line-of-sight depth is assumed to equal to the width of each feature; bMinimum energy condition, assuming the power law electron distribution corresponding to between cutoffs corresponding to 10 MHz and 100 GHz, with only radiating particles and magnetic field; cRelativistic electron plus magnetic pressure for the minimum energy condition.
| Regiona | Centroid RA | Centroid Dec | Area | Luminosityb | Gas densityc | Mass |
|---|---|---|---|---|---|---|
| (J2000) | (J2000) | () | () | () | () | |
| Nucleus | 45.4 | 0.068 | 1.3 | |||
| Knot | 6.9 | 0.026 | 0.5 | |||
| Filamentd | 1.1 | 0.033 | 0.6 |
Note. — aRegions described in text; bAssuming a conversion factor of Å and an FWHM of 130 Å; cFor case B recombination at K, with volume filling factor . To estimate the volume, the line-of-sight depth is assumed to be equal to the width of the region; dLong axis east of north.
| Regiona | Volume | Fluxd | |||||
|---|---|---|---|---|---|---|---|
| () | (keV) | () | () | () | () | ||
| Shell | 0.9 | 1.93 | 0.6 (fixed) | 101/101 | 1.2 | 0.042 | 3.3 |
| Rim | 5.0 (fixed) | 1.98 | 0.68 (fixed) | 37/46 | 3.0 | 0.20 | 1.8 |
| Knot | 0.9 | 1.00 | 0.13 | 35/37 | 1.5 | 0.42 | 2.1 |
Note. — aSee Figs. 2 and 8. CIAO format region for shell: , shell background: , rim: , rim background: , knot: , knot background: ; bFixed at the Galactic foreground value for the shell and knot, and at the best fit for the local background for the rim ( and are very insensitive to these values of ); cFrom the model normalization, assuming that the line-of-sight depth equals the width of each region; d0.5 – 8 keV unabsorbed flux.