Ancient west Eurasian ancestry in southern and eastern Africa
Abstract
The history of southern Africa involved interactions between indigenous hunter-gatherers and a range of populations that moved into the region. Here we use genome-wide genetic data to show that there are at least two admixture events in the history of Khoisan populations (southern African hunter-gatherers and pastoralists who speak non-Bantu languages with click consonants). One involved populations related to Niger-Congo-speaking African populations, and the other introduced ancestry most closely related to west Eurasian (European or Middle Eastern) populations. We date this latter admixture event to approximately 900-1,800 years ago, and show that it had the largest demographic impact in Khoisan populations that speak Khoe-Kwadi languages. A similar signal of west Eurasian ancestry is present throughout eastern Africa. In particular, we also find evidence for two admixture events in the history of Kenyan, Tanzanian, and Ethiopian populations, the earlier of which involved populations related to west Eurasians and which we date to approximately 2,700 - 3,300 years ago. We reconstruct the allele frequencies of the putative west Eurasian population in eastern Africa, and show that this population is a good proxy for the west Eurasian ancestry in southern Africa. The most parsimonious explanation for these findings is that west Eurasian ancestry entered southern Africa indirectly through eastern Africa.
Introduction
Hunter-gatherer populations have inhabited southern Africa for tens of thousands of years [1]. Within approximately the last two thousand years, these populations were joined by food-producing groups (both pastoralists and agriculturalists), and a culturally diverse set of populations occupy the region today. Because written history is unavailable until recently in southern Africa, inferences about the migration patterns leading to the present distribution of populations have largely been informed by archaeology and linguistics.
Genetic data is an additional source of information about population history, but extracting this information remains challenging. Studies of diversity in southern Africa have highlighted the influence of pre-colonial population admixture on the genetic structure of populations in the region [2, 3, 4], but have come to different conclusions about the historical scenarios that led to this admixture. In particular, though there is agreement that the arrival of Bantu-speaking agriculturalist populations had a major demographic impact in many populations, the importance of population movements from other parts of Africa or the world is unclear. Schlebusch et al. [2] argued for eastern African ancestry specifically in the Nama, a pastoralist population, while Pickrell et al. [3] raised this possibility not just for the Nama, but for several Khoe-speaking populations. Identifying the sources of non-Khoisan ancestry in southern Africa could shed light on the historical processes that led to the extensive linguistic and cultural diversity of the region.
Here, we use new techniques based on the extent of linkage disequilibrium to thoroughly examine the signal of admixture in the southern African Khoisan (defined here as indigenous populations speaking non-Bantu languages with click consonants, without implying cultural, linguistic, or genetic homogeneity of Khoisan groups). First, we show that all Khoisan populations have some non-zero proportion of west Eurasian ancestry. (Throughout this paper, we will use geographic labels to refer to ancestry, with the caveat that the geographic labels are derived from modern populations–that is, when we refer to ``west Eurasian ancestry" in ``southern Africa", we are using this as a shorthand for the more cumbersome, but more accurate, phrasing of ``ancestry most closely related to populations currently living in west Eurasia" in ``populations currently living in southern Africa".) Second, we show that there are multiple waves of population mixture in the history of many southern and eastern African populations, and that west Eurasian ancestry entered eastern Africa on average 2,700-3,300 years ago and southern Africa 900-1,800 years ago. Third, we infer the allele frequencies of the ancestral west Eurasian population in eastern Africa, and show that this population is a good proxy for the west Eurasian ancestry in southern Africa. We thus argue that the most plausible source of west Eurasian ancestry in southern Africa is indirect gene flow via eastern Africa.
Results
We began with an analysis of population mixture in southern Africa, using the data from Pickrell et al. [3] supplemented with an additional 32 individuals from seven Khoisan populations genotyped on the Affymetrix Human Origins Array (Supplementary Table 1); note that the Damara are excluded from most of the subsequent analyses as they genetically resemble southern African Bantu-speaking groups [3]. These southern African data were then combined with previously-published worldwide data [5] (SI Methods). After removing individuals who appeared to be genetic outliers with respect to others in their population (SI Methods), we analyzed a final data set consisting of 1,040 individuals from 75 worldwide populations, all genotyped on the Affymetrix Human Origins array at 565,259 single nucleotide polymorphisms (SNPs). These data are available on request from the authors for use in analyses of population history.
West Eurasian ancestry in the Ju'hoan_North.
We previously observed that the Ju'hoan_North, though the least admixed of all Khoisan populations, show a clear signal of admixture when using a test based on the decay of admixture linkage disequilibrium (LD) [3]. The theoretical and practical aspects of historical inference from admixture LD have since been examined in greater detail [6]; we thus re-evaluated this signal in the Ju'hoan_North using the software ALDER v1.0 [6].
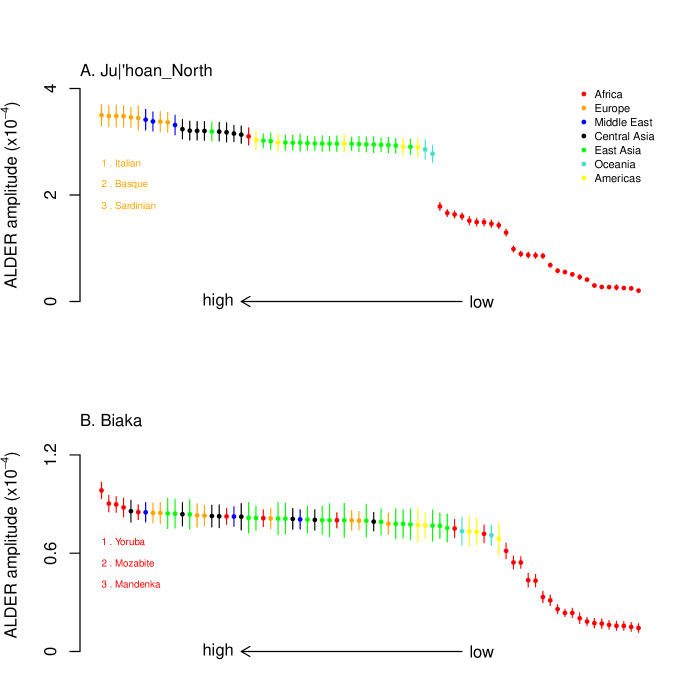
In particular, we were interested in identifying the source of the gene flow by comparing weighted LD curves computed using different reference populations. This is possible because theory predicts that the amplitude of these curves (i.e., the average level of weighted LD between sites separated by 0.5 centimorgans) becomes larger as one uses reference populations that are closer to the true mixing populations. Loh et al. [6] additionally showed that this theory holds when using the admixed population itself as one of the reference populations. We thus computed weighted LD curves in the Ju'hoan_North, using the Ju'hoan_North themselves as one reference population and a range of 74 worldwide populations as the other, and examined the amplitudes of these curves (Figure 1A). The largest amplitudes are obtained with European populations as references (Figure 1A); taken literally, this would seem to implicate Europe as the source of admixture. The estimated date for this gene flow is 43 2 generations (1290 60 years, assuming 30 years/generation [7]) before the present, consistent with our previously estimated date [3]. This date is well before the historical arrival of European colonists to the region.
We next tested the robustness of this result. We confirmed that this observation is consistent across panels of SNPs with varied ascertainment (Supplementary Figure 2). We then considered hunter-gatherer populations from other regions of Africa. In particular, we performed the same analysis on the Biaka (Figure 1B) and Mbuti (Supplementary Figure 3) from central Africa. As expected, the inferred source of admixture in these populations is a sub-Saharan African population (most closely related to the Yoruba, a Niger-Congo-speaking agriculturalist group from Nigeria).
A signal of west Eurasian ancestry in the Ju'hoan_North should be identifiable by allele frequencies as well as by LD. We thus tested the population tree [Chimp,[Ju'hoan_North, [Han, French]] using an statistic [8, 9]. This tree fails with a Z-score of 4.0 (). On smaller subsets of SNPs, the evidence is weaker, explaining why we had not noticed it previously (on the set of SNPs ascertained in a Ju'hoan individual, Z = 2.7 []; in a French individual, Z = 0.6 []; in a Yoruba individual, Z = 1.4 []). We thus conclude that there is a signal in both allele frequencies and linkage disequilibrium that the Ju'hoan_North admixed with a population more closely related to western rather than eastern Eurasian populations, and that this signal is absent from hunter-gatherer populations in central Africa.
Signal of west Eurasian relatedness is shared throughout southern Africa.
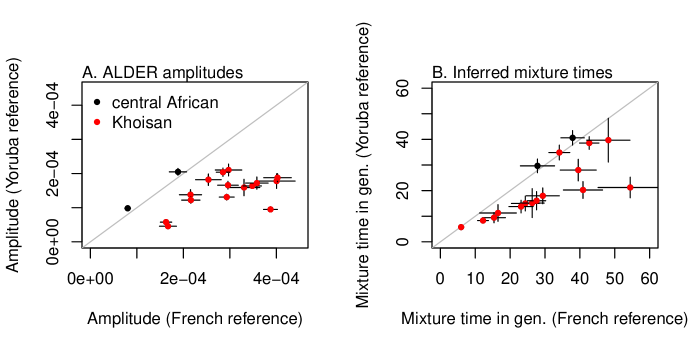
We next examined whether this signal of relatedness to west Eurasia is present in other Khoisan populations. For each Khoisan population, we used ALDER to compute weighted LD decay curves using the test population as one reference and either the French or the Yoruba as the other reference. We included the central African Mbuti and Biaka populations as negative controls. In all Khoisan populations, the amplitude of the LD decay curve is larger when using the French as a reference than when using the Yoruba as a reference (Figure 2A). In contrast, for the Mbuti and Biaka, the larger amplitude is seen when using the Yoruba as a reference (Figure 2A).
A striking observation that emerges from this analysis is that, in many of the southern African populations, the inferred mixture times depend substantially on the second population used as a reference (Figure 2B). Under a model of admixture from a single source population, the decay rate of the LD curve does not depend on the reference population used [6]; this suggests that there are at least two separate non-Khoisan sources of ancestry in some of these Khoisan populations. In contrast, for the central African Mbuti and Biaka, the inferred times do not depend on the reference used.
Estimating parameters of multiple admixture events.
Motivated by the above observations, we designed a method to estimate dates of multiple admixture events in the history of a population (related ideas have been explored by Myers et al. [10]). We extended the population genetic theory of Loh et al. [6] to the case where a population has experienced multiple episodes of population admixture from different sources (SI Methods). In this situation, the extent of admixture LD in the population is no longer a single exponential curve as a function of genetic distance, but instead a mixture of exponential curves. Using a range of reference populations, we can thus formally test for the presence of multiple waves of mixture and estimate the dates of these mixture events (SI Methods). We validated this approach using coalescent simulations of three pairs of mixture dates chosen to span the scenarios that our data suggest are relevant to southern and eastern Africa (SI Methods). The simulations indicate that our method has reasonable but not perfect power; depending on the pair of dates of we simulated, we successfully detected both events in between 70-90
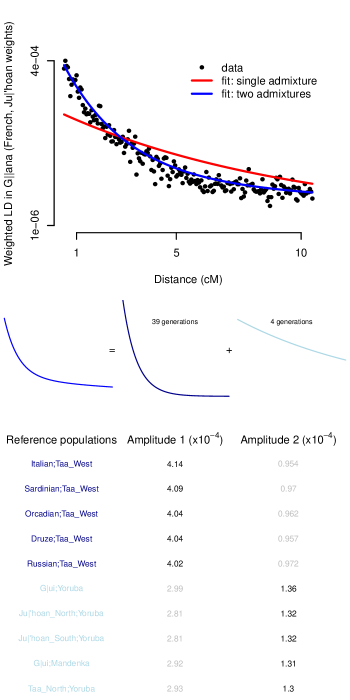
To illustrate the intuition behind this method, in Figure 3 we plot one of the weighted LD curves calculated in the Gana. Under a model with a single admixture event, the mean admixture date in the Gana is estimated as generations, identical to the date obtained by Pickrell et al. [3]. However, it is visually apparent that this model is a poor fit to the data (Figure 3). Indeed, we find that adding a second mixture event significantly improves the fit (minimum Z-score on the two admixture times of 2.8; ) The two inferred mean admixture times in the Gana are and generations ago.
This method additionally estimates amplitudes of the LD decay curves for each pair of populations on each mixture time, which are a function of the relationship between the reference populations and the true source populations. These amplitudes can be used to infer the references closest to the true mixing populations. However, if a source population is itself admixed, under some conditions this method will identify a population related to one of the ancestral components of the source population instead of the source population itself (SI Methods). By examining these amplitudes, we conclude that the west Eurasian ancestry in the Gana entered the population through the older admixture event (Figure 3). Because of the caveat noted above, however, we cannot distinguish between two historical scenarios with this method: direct gene flow from a west Eurasian population and gene flow from a west Eurasian-admixed population.
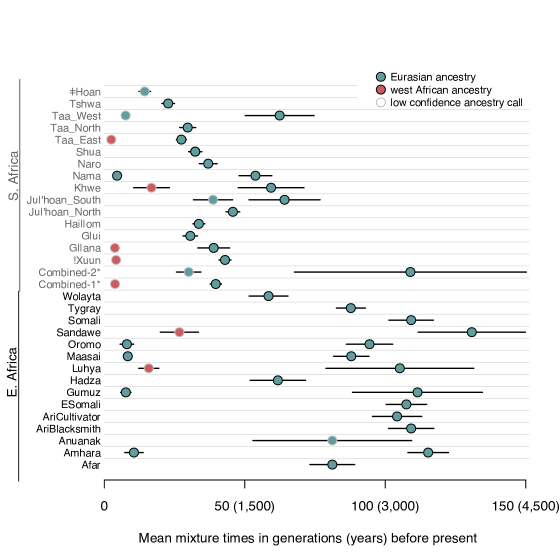
We applied this method to each Khoisan population in turn (with the exception of the Damara, who are genetically similar to non-Khoisan populations), using 45 other African and non-African populations as references(Supplementary Figures 10-23). In several populations, there is evidence for two waves of population mixture (!Xuun, Taa_West, Taa_East, Nama, Khwe, Gana, Ju'hoan_South), while in others a single wave of population mixture fits the data (Figure 4). For populations with two waves of mixture, west Eurasian ancestry entered through the earlier admixture event (Figure 4, Supplementary Table 3). In the Nama, both the early and more recent admixture events are predicted to involve populations with west Eurasian ancestry, consistent with known post-colonial European admixture in this population. The Taa_West also show two episodes of west Eurasian admixture, but the more recent one has low confidence.
It is important to mention a few caveats in interpreting results from this method. First, in cases where the method detects two admixture events from the same source (as in the Nama and Taa_West above), simulations suggest an alternative interpretation is sustained population mixture over many generations (SI Methods). Second, the numbers of admixture events inferred by this method are lower bounds; for example, this method fails to detect that the Naro are admixed between two distinct Khoisan groups [3], and we find evidence of west African ancestry in just four Khoisan populations (!Xuun, Gana, Khwe, and Taa_East) when treated individually (but see analyses of combined populations below). Finally, the method has low confidence when assigning an admixture event to a population with west African ancestry (Figure 4); this reflects a relative lack of genetic drift specific to the west African reference populations (Yoruba and Mandenka), which makes it difficult to detect with high confidence (in contrast, there is considerable genetic drift in west Eurasian populations because of the out-of-Africa bottleneck, which allows admixture events to be more confidently assigned to this ancestry).
In most populations where our method detects only a single admixture event, the fitted model visually appears inadequate to fully explain the data (e.g. Supplementary Figures 11, 13, 20, 21). Indeed, there is marginal statistical evidence for two admixture events in many of these populations (Supplementary Table 4). To increase our power to detect additional admixture events, we performed analyses of combined populations. In a combined set of populations (the Tshwa, Shua, Haiom, Hoan, Naro, and Taa_North) that have marginal evidence for a second, more recent admixture event, we infer two dates of admixture: one 40 2 generations ago and one 4 1 generations ago (Z-score for the hypothesis that the admixture time is zero is 3.2, ). In a combined set of two populations (the Ju'hoan_North and Gui) that have marginal evidence for a second, more ancient admixture event, we also infer two dates of admixture (Supplementary Figure 24), but with different dates from all other samples: one 30 4 generations ago (Z-score of 6.9, ), and one 109 41 generations ago (Z-score of 2.6, ). We interpret this as suggestive evidence that the population that introduced west Eurasian ancestry to southern Africa was itself admixed, and that this more ancient admixture happened around 110 generations ago (though the confidence intervals here are clearly large).
Variation in west Eurasian ancestry proportions in the Khoisan.
We next asked if there are systematic differences between Khoisan populations in their levels of west Eurasian ancestry. To test this, we constructed an ratio estimate to specifically measure west Eurasian ancestry. This ratio is: (Han, Orcadian; X, Druze)/ (Han, Orcadian; Yoruba, Druze), where X is any southern African population; this ratio takes advantage of the fact that the west Eurasian ancestry is more closely related to Middle Eastern than to northern European populations (SI Methods). We applied this method to all Khoisan populations, and included southern African Bantu speakers for comparison. The highest levels of west Eurasian ancestry are found in Khoe-Kwadi speakers (Table 1A), particularly the Nama, where our estimate of west Eurasian ancestry reaches 14% (though note we cannot distinguish between the impact of recent colonialism and older west Eurasian ancestry in the Nama using this method). Other populations of note include the Khwe, Shua, and Haiom, who we estimate to have approximately 5% west Eurasian ancestry. The apparent correlation between language group and west Eurasian ancestry may have implications for the origins of this ancestry in southern Africa; we return to this point in the discussion.
The origin of west Eurasian ancestry in southern Africa.
We next considered the origin of the west Eurasian ancestry in southern Africa. Direct interactions between Europe and southern Africa seem unlikely given the inferred admixture dates, especially because this ancestry is widespread throughout southern Africa. It has been reported that many populations in eastern Africa admixed with populations from the Levant [11] or the Arabian peninsula [12]. Since there is suggestive genetic evidence of a migration from eastern Africa to southern Africa [13, 3, 2] as well as linguistic and archaeological indications [14], we hypothesized that indirect gene flow through eastern Africa might be a plausible source for the west Eurasian ancestry in southern Africa. This hypothesis makes two major predictions: first, that the west Eurasian ancestry in eastern Africa should have the same source as that in southern Africa, and second, that the mixture times in eastern Africa should be older than those in southern Africa, perhaps with a date of around 110 generations (corresponding to the oldest date identified in southern Africa).
To test these predictions, we assembled a data set of individuals from southern Africa, eastern Africa, and west Eurasia typed on an Illumina platform by merging data from previous studies [11, 15, 16, 17, 18]. The eastern African populations in these combined data include populations from Ethiopia, Kenya, Tanzania, and Sudan (the majority of these populations were genotyped by Pagani et al. [11]). We first confirmed using tests [8] that many eastern African populations have statistically significant evidence for admixture with west Eurasian populations (Supplementary Table 5). The smallest statistics in nearly all eastern African populations involve a southern European (or Levantine) population as one reference. We then evaluated the fraction of west Eurasian ancestry in each population, using the same ratio estimate as used in the Khoisan (Table 1B). The fraction of west Eurasian ancestry in eastern African populations is generally higher in eastern than in southern Africa; the highest levels of admixture (40-50%) are observed in some Ethiopian populations.
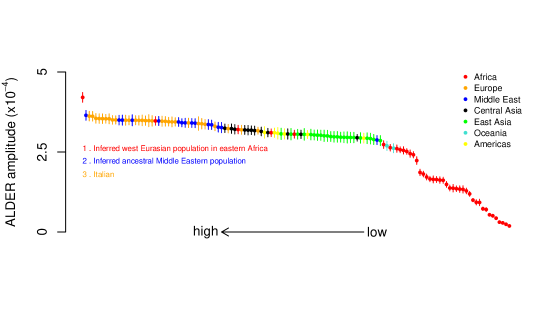
To test if the west Eurasian ancestry in southern and eastern Africa is from the same source, we reconstructed the allele frequencies of the west Eurasian population involved in the admixture in eastern Africa (SI Methods). We then tested whether this hypothetical population is a good proxy for the west Eurasian ancestry in southern Africa. Indeed, this reconstructed population is a better proxy than samples of modern Eurasians (Figure 5). In the Juhoansi (who correspond to the Ju'hoan_North), we obtain an ALDER amplitude in the one-reference test of when using this imputed population as a reference versus when using Italians as a reference (one-sided P-value for difference of ).
We then applied our method for dating multiple admixture events to the eastern African populations in these data (Supplementary Figure 25-39). Pagani et al. [11] previously dated the earliest admixture events in Ethiopia to around 3,000 years ago, but with considerable variation between populations. We find evidence for multiple episodes of population mixture in eastern Africa; most populations have evidence for an early admixture event that we date to around 80-110 generations (2,400-3,300 years) ago (Figure 4). As in southern Africa, the west Eurasian ancestry is present in the early admixture event (Supplementary Table 6). The earliest dates of population mixture that we estimate in eastern Africa are almost uniformly older than those we estimate in southern Africa (Figure 4). One potential concern regarding this conclusion is that the southern and eastern African populations displayed in Figure 4 were genotyped on different genotyping arrays; however, this pattern remains when using only populations typed on the same array (Supplementary Figure 40). We conclude that the west Eurasian ancestry in southern Africa was likely brought by a migration of an already-admixed population from eastern Africa.
Estimating the proportion of eastern African ancestry in southern Africa.
If west Eurasian ancestry indeed entered southern Africa via eastern Africa, then the relative proportions of west Eurasian ancestry in different southern African populations can be interpreted as reflecting different levels of eastern African gene flow. We thus attempted to split the ancestry of all southern African populations into three components: Khoisan ancestry, putative eastern African ancestry, and ancestry from Bantu-speaking immigrants to southern Africa. To do this, we make the following assumptions: first, that all eastern African ancestry in southern Africa came from a single source with a fixed level of west Eurasian admixture; and second, that all non-Khoisan ancestry in southern Africa is either from this putative eastern African population or from a Bantu-speaking population. Because these assumptions are largely unverifiable, the following should be viewed as more qualitative than quantitative.
We first attempted to estimate the proportion of west Eurasian ancestry in the putative eastern African population that entered southern Africa. Using ALDER, we estimate the lower bound on the proportion of non-Khoisan ancestry in the Ju'hoan_North as 4%. If approximately 1% of this is west Eurasian ancestry (Table 1) and the Ju'hoan_North have no Bantu-related ancestry, then this gives an admixture proportion of 25% west Eurasian ancestry in the putative eastern African source population. Using this value, we then estimated the proportions of Khoisan, putative eastern African, and Bantu-related ancestry of all populations using a linear model ([20], SI Methods). In Table 2, we show our estimates of these three components (excluding in this case the Nama, who have recent European ancestry that confounds this analysis).
Discussion
In this paper, we have examined the history of southern and eastern African populations using patterns of admixture LD. The most striking inference from this analysis is the presence of west Eurasian ancestry in southern Africa that we date to 900-1,800 years ago. Several lines of evidence suggest that the population that brought this ancestry to southern African was an already-admixed population from eastern Africa.
Back-to-Africa gene flow in eastern Africa.
A major open question concerns the initial source of the west Eurasian ancestry in eastern Africa. The estimated mean time of gene flow in eastern Africa is around 3,000 years ago, and the amount of gene flow must have been quite extensive, as the west Eurasian ancestry proportions reach 40-50% in some Ethiopian populations (Table 1 and [11]). Archaeological records from this region are sparse, so Pagani et al. [11] speculate that this admixture is related to the Biblical account of the Kingdom of Sheba. However, archaeological evidence is not completely absent. During this time period, architecture in the Ethiopian culture of D'mt has an ``unmistakable South Arabian appearance in many details" [21], though there is some debate as to whether these patterns can be attributed to large movements of people versus elite-driven cultural practices [22, 21]. Additionally, linguistic evidence suggests that this time period was when Ethiosemitic languages were introduced to Africa, presumably from southern Arabia [23]. It is perhaps not a coincidence that the highest levels of west Eurasian ancestry in eastern Africa are found in the Amhara and Tygray, who speak Ethiosemitic languages and live in what was previously the territory of D'mt and the later kingdom of Aksum.
West Eurasian ancestry in southern Africa.
A second question is: which population or populations introduced west Eurasian ancestry into southern Africa? The best genetic proxy for this ancestry that we have found is the west Eurasian ancestry in eastern Africa (Figure 5), and though we do not identify modern east African populations as the best source population, this is likely due to the lack of genetic drift specific to eastern Africa (SI Methods, Section 1.2.3). The most parsimonious explanation for this observation is that west Eurasian ancestry entered southern Africa indirectly via eastern Africa (though the alternative scenario of direct contact with an unsampled west Eurasian population cannot formally be excluded; however, there is no archaeological, historical, or linguistic evidence of such contact). The relevant eastern African population may no longer exist. However, such a migration has been suggested based on shared Y chromosome haplotypes [24, 13] and shared alleles/haplotypes associated with lactase-persistence [25, 2] between the two regions. Furthermore, based on a synthesis of archaeological, genetic, climatological and linguistic data Güldemann [14] hypothesized that the ancestor of the Khoe-Kwadi languages in southern Africa was brought to the region by immigrating pastoralists from eastern Africa. Our observation of elevated west Eurasian ancestry in Khoe-Kwadi groups in general (Table 1) is consistent with this hypothesis.
Alternative historical scenarios.
We note that we have interpreted admixture signals in terms of large-scale movements of people. An alternative frame for interpreting these results might instead propose an isolation-by-distance model in which populations primarily remain in a single location but individuals choose mates from within some relatively small radius. In principle, this sort of model could introduce west Eurasian ancestry into southern Africa via a ``diffusion-like" process. Two observations argue against this possibility. First, the gene flow we observe is asymmetric: while some eastern African populations have up to 50% west Eurasian ancestry, levels of sub-Saharan African ancestry in the Middle East and Europe are considerably lower than this (maximum of 15% [19]) and do not appear to consist of ancestry related to the Khoisan. Second, the signal of west Eurasian ancestry is present in southern Africa but absent from central Africa, despite the fact that central Africa is geographically closer to the putative source of the ancestry. These geographically-specific and asymmetric dispersal patterns are most parsimoniously explained by migration from west Eurasia into eastern Africa, and then from eastern to southern Africa.
Conclusions.
Based on these analyses, we can propose a model for the spread of west Eurasian ancestry in southern and eastern Africa as follows: first, a large-scale movement of people from west Eurasia into Ethiopia around 3,000 years ago (perhaps from southern Arabia and associated with the D'mt kingdom and the arrival of Ethiosemitic languages) resulted in the dispersal of west Eurasian ancestry throughout eastern Africa. This was then followed by a migration of an admixed population (perhaps pastoralists related to speakers of Khoe-Kwadi languages) from eastern Africa to southern Africa, with admixture occurring approximately 1,500 years ago. Advances in genotyping DNA from archaeological samples may allow aspects of this model to be directly tested.
Acknowledgements
We thank Richard Durbin for suggesting that we impute the allele frequencies of the ancestral west Eurasian population in eastern Africa, and Carlos Bustamante for helpful discussions on the interpretation of the admixture signals. We thank two anonymous reviewers and commenters on the blogs Gene Expression and Haldane's Sieve for helpful suggestions. The Khoisan samples analysed here were collected in the framework of a multidisciplinary project investigating the prehistory of the Khoisan peoples and languages (http://www2.hu-berlin.de/kba/), and we thank Tom G ldemann, Christfried Naumann, Chiara Barbieri, Linda Gerlach, Falko Berthold, and Hirosi Nakagawa for assistance with sample collection. JP was supported by NIH postdoctoral fellowship GM103098. This work, as part of the European Science Foundation EUROCORES Programme EuroBABEL, was supported by a grant from the Deutsche Forschungsgemeinschaft (to BP) and by funds from the Max Planck Society (to BP and MS). M.L. and P.L. acknowledge NSF Graduate Research Fellowship support. P.L. was also partially supported by NIH training grant 5T32HG004947-04 and the Simons Foundation. N.P. and D.R. were funded by NIH grant GM100233 and NSF HOMINID grant 1032255
| Population | Language | West Eurasian |
|---|---|---|
| classification | ancestry (%) | |
| Nama | Khoe-Kwadi | 14.0 |
| Shua | Khoe-Kwadi | 5.4 |
| Haiom | Khoe-Kwadi | 5.2 |
| Khwe | Khoe-Kwadi | 4.0 |
| Tshwa | Khoe-Kwadi | 3.0 |
| Naro | Khoe-Kwadi | 2.2 |
| Gui | Khoe-Kwadi | 2.0 |
| Taa_North | Tuu | 1.9 |
| Gana | Khoe-Kwadi | 1.6 |
| !Xuun | Kx'a | 1.2 |
| Hoan | Kx'a | 1.5 |
| Damara | Khoe-Kwadi | 1.3 |
| Kgalagadi | Bantu | 1.1 |
| Ju'hoan_North | Kx'a | 1.0 |
| Taa_East | Tuu | 0.4 |
| Mbukushu | Bantu | 0.5 |
| Taa_West | Tuu | 0.4 |
| Himba | Bantu | 0.1 |
| Ju'hoan_South | Kx'a | 0 |
| Tswana | Bantu | 0 |
| Wambo | Bantu | 0 |
| Population | Language | West Eurasian |
|---|---|---|
| classification | ancestry (%) | |
| Tygray | Semitic | 50.4 |
| Amhara | Semitic | 49.2 |
| Afar | Cushitic | 46.0 |
| Oromo | Cushitic | 41.6 |
| Somali | Cushitic | 38.4 |
| Ethiopian Somali | Cushitic | 37.9 |
| Wolayta | Omotic | 34.1 |
| Maasai | Nilotic | 18.9 |
| Ari Cultivator | Omotic | 18.2 |
| Sandawe | isolate | 15.8 |
| Ari Blacksmith | Omotic | 15.7 |
| Hadza | isolate | 6.4 |
| Luhya | Bantu | 2.4 |
| Gumuz | isolate | 1.7 |
| Anuak | Nilotic | 0 |
| Population | Khoisan | Putative eastern African (west Eurasian) | Putative Bantu-related |
| ancestry (%) | ancestry (%) | ancestry (%) | |
| Haiom | 54 | 25 (6.3) | 21 |
| Shua | 37 | 21 (5.2) | 43 |
| Khwe | 36 | 18 (4.6) | 45 |
| Gui | 80 | 13 (3.2) | 6 |
| Tshwa | 48 | 10 (2.4) | 43 |
| !Xuun | 73 | 9 (2.2) | 18 |
| Naro | 87 | 9 (2.2) | 5 |
| Taa_North | 84 | 9 (2.4) | 7 |
| Gana | 53 | 6 (1.5) | 41 |
| Hoan | 70 | 6 (1.4) | 24 |
| Ju'hoan_South | 93 | 6 (1.5) | 1 |
| Damara | 9 | 4 (1.0) | 88 |
| Ju'hoan_North | 96 | 4 (1.0) | 0 |
| Mbukushu | 9 | 2 (0.5) | 89 |
| Taa_East | 74 | 1 (0.2) | 25 |
| Taa_West | 83 | 1 (0.3) | 16 |
| Himba | 8 | 0 (0) | 92 |
| Tswana | 22 | 0 (0) | 78 |
| Kgalagadi | 33 | 0 (0) | 67 |
| Wambo | 5 | 0 (0) | 95 |
References
- [1] Phillipson, D. African archaeology (Cambridge Univ Pr, 2005).
- [2] Schlebusch, C. M. et al. Genomic variation in seven khoe-san groups reveals adaptation and complex african history. Science 338, 374–9 (2012).
- [3] Pickrell, J. K. et al. The genetic prehistory of southern africa. Nat Commun 3, 1143 (2012).
- [4] Petersen, D. C. et al. Complex patterns of genomic admixture within southern africa. PLoS Genet 9, e1003309 (2013).
- [5] Patterson, N. et al. Ancient admixture in human history. Genetics 192, 1065–93 (2012).
- [6] Loh, P.-R. et al. Inferring admixture histories of human populations using linkage disequilibrium. Genetics 193, 1233–54 (2013).
- [7] Fenner, J. Cross-cultural estimation of the human generation interval for use in genetics-based population divergence studies. American journal of physical anthropology 128, 415–423 (2005).
- [8] Reich, D., Thangaraj, K., Patterson, N., Price, A. L. & Singh, L. Reconstructing Indian population history. Nature 461, 489–94 (2009).
- [9] Keinan, A., Mullikin, J. C., Patterson, N. & Reich, D. Measurement of the human allele frequency spectrum demonstrates greater genetic drift in East Asians than in Europeans. Nat Genet 39, 1251–5 (2007).
- [10] Myers, S. et al. LD patterns in dense variation data reveal information about the history of human populations worldwide. Presented at the 61st Annutal Meeting of The American Society of Human Genetics (2011).
- [11] Pagani, L. et al. Ethiopian genetic diversity reveals linguistic stratification and complex influences on the ethiopian gene pool. Am J Hum Genet 91, 83–96 (2012).
- [12] Haber, M. et al. Genome-wide diversity in the levant reveals recent structuring by culture. PLoS Genet 9, e1003316 (2013).
- [13] Henn, B. et al. Y-chromosomal evidence of a pastoralist migration through tanzania to southern africa. Proc Natl Acad Sci U S A 105, 10693–10698 (2008).
- [14] Güldemann, T. A linguist's view: Khoe-Kwadi speakers as the earliest food-producers of southern Africa. Southern African Humanities 20, 93–132 (2008).
- [15] Altshuler, D. et al. Integrating common and rare genetic variation in diverse human populations. Nature 467, 52 (2010).
- [16] Behar, D. M. et al. The genome-wide structure of the jewish people. Nature 466, 238–42 (2010).
- [17] Henn, B. M. et al. Hunter-gatherer genomic diversity suggests a southern African origin for modern humans. Proc Natl Acad Sci U S A 108, 5154–62 (2011).
- [18] Li, J. Z. et al. Worldwide human relationships inferred from genome-wide patterns of variation. Science 319, 1100–1104 (2008).
- [19] Moorjani, P. et al. The history of African gene flow into Southern Europeans, Levantines, and Jews. PLoS Genet 7, e1001373 (2011).
- [20] Patterson, N. et al. Genetic structure of a unique admixed population: implications for medical research. Hum Mol Genet 19, 411–9 (2010).
- [21] Munro-Hay, S. C. Aksum: an African civilisation of late antiquity (Edinburgh University Press Edinburgh, 1991).
- [22] Mitchell, P. African connections: an archaeological perspective on Africa and the wider world, vol. 7 (AltaMira Press, 2005).
- [23] Kitchen, A., Ehret, C., Assefa, S. & Mulligan, C. J. Bayesian phylogenetic analysis of semitic languages identifies an early bronze age origin of semitic in the near east. Proc Biol Sci 276, 2703–10 (2009).
- [24] Cruciani, F. et al. A back migration from asia to sub-saharan africa is supported by high-resolution analysis of human y-chromosome haplotypes. The American Journal of Human Genetics 70, 1197–1214 (2002).
- [25] Coelho, M., Sequeira, F., Luiselli, D., Beleza, S. & Rocha, J. On the edge of bantu expansions: mtdna, y chromosome and lactase persistence genetic variation in southwestern angola. BMC evolutionary biology 9, 80 (2009).
See pages 1-62 of supp2.pdf