SiViO: A Trigger for -Hyperons
Abstract
As online trigger for events containing hyperons in p+p collisions at a silicon-based device has been designed and built. This system has been integrated close to the target region within the FOPI spectrometer at GSI and was also employed as a tracking device to improve the vertex reconstruction of secondary decays. The design of the detector components, read-out, the trigger capability as well as the tracking performance are presented. An enrichment factor of about was achieved for events containing a -hyperon candidate.
keywords:
silicon, Mesytec, APV25, MIPS, , trigger1 Introduction
A modular silicon-based system has been designed to trigger on the particular signature of hyperons decaying into pairs. Similar concepts have been developed for the DISTO [1] and COSY-TOF [2] experiments exploiting scintillating fibers arranged in several layers and placed close to the target regions. There, the trigger was based on different hit multiplicities in the various layers of the scintillating fibre detectors. We have utilized single and double-sided, partially high-segmented silicon detectors as a trigger device. The setup was designed to reduce dead areas and improve the hit position resolution. This way we have combined a rather fast online computation of the hit multiplicity pattern, used to build the second level trigger, with an improved position resolution of the order of 1 mm. This device was named SiViO (Silicon Vertexing and Identification Online) designed to fit within the central tracking chamber of the FOPI [3] spectrometer at GSI. Indeed, the final goal of this development is to search in the reaction for the formation of so-called bound state together with a leading to the final state [4]. Theoretical calculations [5, 6] suggest that the formation of such state is favoured at the beam energies available at GSI, i.e. max 4.5 AGeV. Moreover, the large geometrical acceptance of the FOPI spectrometer [3] fulfills requirements for this exclusive measurement. Apart from a significantly enhancing the amount of events with Lambda candidates SiViO allows for vertex reconstruction of tracks emitted below the polar angle of which is lacking in the FOPI setup [7]. This present paper is organized as follows: section one shortly describes the FOPI apparatus, section two summarizes the SiViO detector concept, its schematics and read-out. In section three the calibration of the signals is discussed, followed by the trigger performance in section four. In sections five and six the tracking algorithm, efficiency and purity are shown together with the reconstruction of the hyperons and the selection capability of the trigger, based on both full-scale simulations and experimental data. We conclude with a summary in chapter seven.
1.1 The FOPI spectrometer
FOPI [3, 8, 9] is a fixed target spectrometer located at GSI (Darmstadt, Germany).
It consists of an inner drift chamber which is surrounded by a scintillator and a RPC time-of-flight barrel [10, 11].
A second drift chamber and a scintillator time-of-flight wall are placed in the forward direction.
The drift chamber and the time of flight barrels are surrounded by a superconducting solenoid magnet.
FOPI has nearly a 4 geometrical acceptance, a momentum resolution between 7%-10%, a time-of-flight resolution between 80 ps (RPC) and 200 ps (plastics scintiallators) in heavy ion reactions depending on the detector type and a vertex resolution of in the XY-plane for tracks measured with the Central Drift Chamber (CDC).
FOPI was designed as a heavy ion spectrometer and is therefore not best suited to trigger on low multiplicity elementary reactions. The SiViO system enables to trigger on
reactions from proton-proton collisions where a is produced in the final state.
Moreover, the poor spatial resolution of the forward tracking detector HELITRON does not allow for vertex reconstruction and identification of secondary vertices by itself. SiViO can improve the tracking capabilities especially in the forward direction by providing an additional hit-point for charged particle tracks close to the target region.
1.2 Beam Line Detectors
In addition to the SiViO system, two new detectors for the beam characterization have been developed:
The start detector - placed around upstream of the target - was made out of five and thick scintillator plates.
To cope with beam intensities up to , focused on a beam spot of about diameter, the readout was done on both sides with booster photo multipliers111Hamamatsu H6524-01MOD with modified booster lines, which works to rates up to several . Since the magnetic field inside FOPI at the position of the start detector is still in the order of the photo multipliers were shielded with iron tubes. The intrinsic time resolution of this detector was about at a hit rate of [12], which leads to a time-of-flight resultion of 130 ps for the RPC and 215 ps in the plastic barrels.
Beam particles undergoing upstream interactions or stemming from a beam halo were suppressed using a veto-detector.
The veto-detector consists of two thick scintillators which were read out on one side only by fine-mesh PMTs 222Hamamatsu H6152-01B with modified booster lines.
The two scintillators are rotated by with respect to each other and were split into two segments each, to facilitate the installation. Both detectors have an inner hole of diameter to enable the passage of the beam and were positioned around before the target edge.
The efficiency of this detector was evaluated to be above 98% [12].
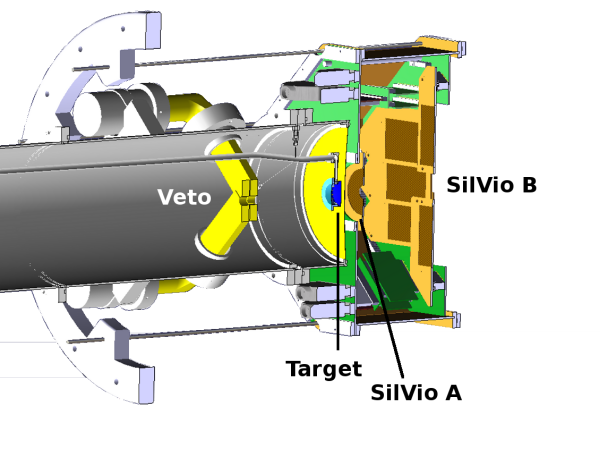
Figure 1 shows the veto detector together with the target inside the evacuated beam tube and the SiViO setup.
1.3 Target
Liquid hydrogen contained in a cell of kapton was used in the experiment. The target cell was made of a tube with a diameter of mounted in the evacuated beam pipe.
Hydrogen was cooled down by a cryogenic cooler outside the setup.
The resulting interaction probability of protons with a beam energy of with the target structure was 0.004% for the capton foil and 0.372% for the liquid hydrogen.
2 The -Trigger
SiViO (Silicon--Vertexing-and-Identification-Online)
is a detector system designed to generate a trigger signal based on the decay pattern of a hyperon and to improve the tracking capabilities of FOPI for particles emitted in the forward direction.
SiViO is composed of two layers of silicon detectors, hereafter referred to as SiViO-A and SiViO-B.
The basic idea of the trigger is that the multiplicity in two consecutive layers of detectors is different when a decays between them.
In this case, since the is a neutral particle, no signal is generated in the first layer (SiViO-A) but two charged particles are detected by the second layer (SiViO-B).
The precise acceptance is determined by the combined analysis of simulated and experimental data.
2.1 Detector Setup
2.1.1 Silvio A
SiViO-A is a single sided annular thick silicon detector divided into 32 sectors with an inner and outer radius of 7 and respectively. The detector itself is mounted on a small PCB which can be attached to the SiViO-B main board. This main board, not only holds the detector, but also includes all the necessary feedthroughs and connectors for the readout. Positioned downstream from the target the detector covered a polar angle ranging from to . The thickness of the device was selected to make sure that the charge deposited by the minimal ionising particle (MIP) is sufficient to separate this signal from the electronic noise and low energy -electrons.
2.1.2 Silvio B
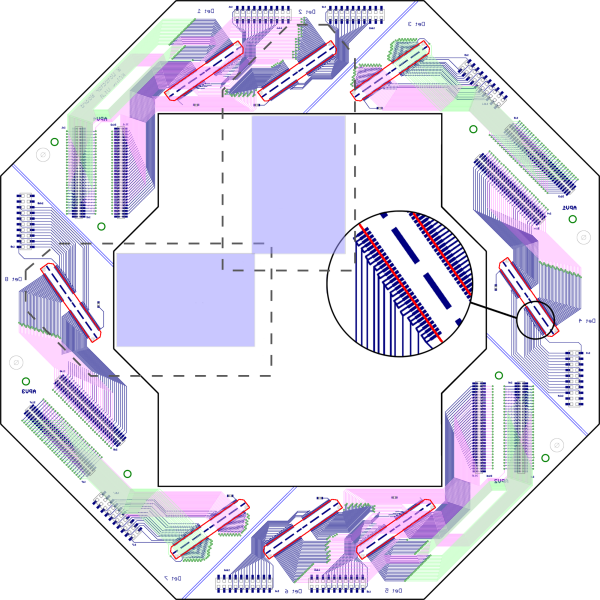
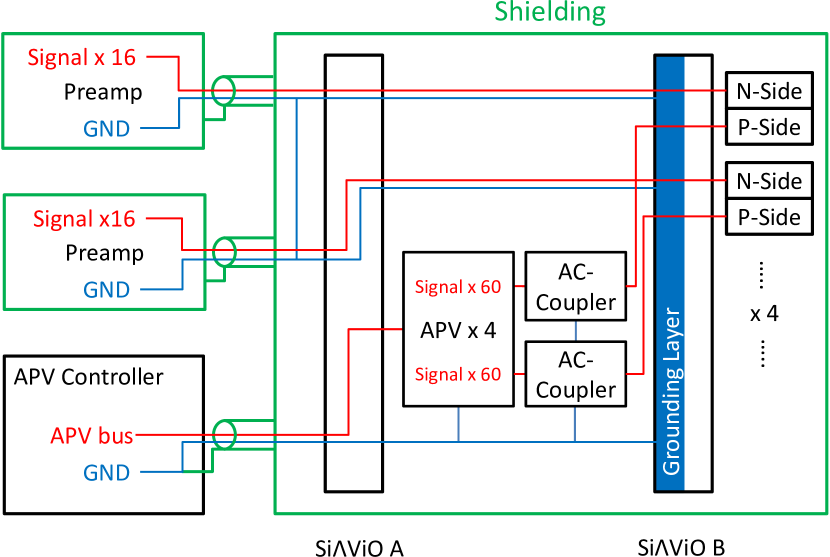
SiViO-B is a patchwork of 8 double sided silicon strip detectors with a pitch of and a thickness of . Each detector has a size of with 60 strips on the p-side, 16 strips on the n-side. The individual detector PCBs - optimized for a minimum of passive material - are mounted on a common main board. This configuration guarantees a good position resolution in the polar angle direction, while the detector side, corresponding to the azimuthal angle, has a rougher binning which suits the trigger realization. Figure 3 shows the layout of the SiViO-B main board. The positions of two detectors are exemplary shown in gray dashed line with the active area in light blue and their connectors marked in red. The inlet shows how the previously mentioned grouping of n-side readout strips is realized. All detectors were produced by Canberra [13].
2.1.3 Detector Box
The two main boards of the trigger detector are mounted in a fixed distance between the two detector plains.
The p-side of the SiViO-B is read out by APV combined with an AC-Coupler for the charge attenuation (see section 2.1.4). These are mounted on boards positioned between the two layers, which allows for a quite short length of the readout lines from the p-side strips of the detector to the readout chip.
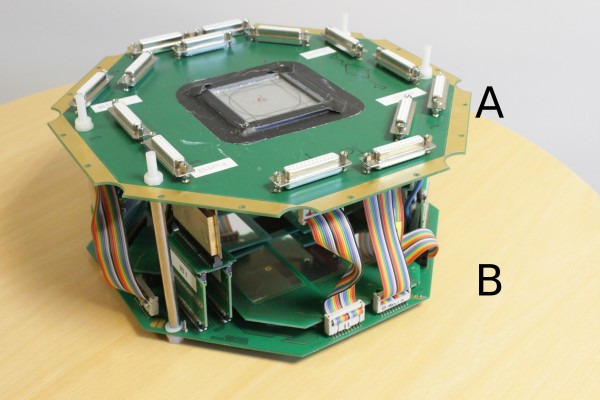
The signals of the n-side strips are lead by flat cables to the SiViO-A PCB, where they are fed to sub-d connectors.
All signals are collected on the top side of the SiViO-A main board.
This setup can be seen in figure 4.
In total there are 16x8 channels from n-side and 60x8 channels from the p-side that are transferred from the SiViO-B board to the SiViO-A board.
The p-side signals, however, are first sent to the APV25 board where they are processed and further transferred in a multiplexed way.
This drastically reduces the amount of signal cables.
Both main boards have cutouts in correspondence of the active detector areas to reduce the radiation length.
To protect the detector from light and for shielding against electrical interferences the setup is put into a hexagonal
shaped box made out of epoxy laminated paper, coated with a thin copper layer. The upper side is closed by the SiViO-A PCB.
The bottom side is closed by an thick aluminum foil, having a complete shielding as shown in figure 5.
Shielded cables were used for all signals to avoid noise pickup. The shielding allows a trigger threshold as low as 220 keV (see section 3.1)
2.1.4 Readout Electronics
For the readout two different systems are used. Both systems are able to process positive and negative signals. The signals of the segmented side SiViO-A and the n-doped side of SiViO-B are processed with analog preamplifier333Mesytec MPR16[14] with a range of . The amplified signals are fed into STM16+ NIM Moduls from Mesytec. This shaping module has a fast timing filter amplifier for generating the trigger signal based on a user-defined and variable individual threshold for each channel and a slow shaper with for the amplitude signal.
These modules generate a trigger signal if the hit multiplicity is within an interval defined by the user.
Each shaper has 16 inputs and it is possible to daisy chain more devices together to generate a signal on the base of a global multiplicity.
Furthermore this signal - used to determine the global multiplicity - is read out by a QDC 444CAEN v985. A QDC had to be used because this signal is current based. The signal of the shapers has to be attenuated to fit to the QDC input range.
The shaped signals are then further processed by 12-bit peak sensing ADCs 555CAEN v786.
The p-doped side of the SiViO-B detectors is read out by front-end electronics, based on the development for the HADES-RICH upgrade, equipped with the APV25 chips [15, 16].
The APV25 has 128 input channels, each with a preamplifier and a shaper with shaping time (variable between 30 and ).
These signals are sampled at at frequency of and stored in a 192 cell ring buffer. The total length of the ring buffer of is sufficient for the trigger latency.
Since each detector has 60 strips on the p-side, one APV25 with 128 channels was used for the readout of 2 detectors.
The 8 remaining channels are distributed evenly among the 120 signal channels to allow for an online FPGA based common mode noise correction.
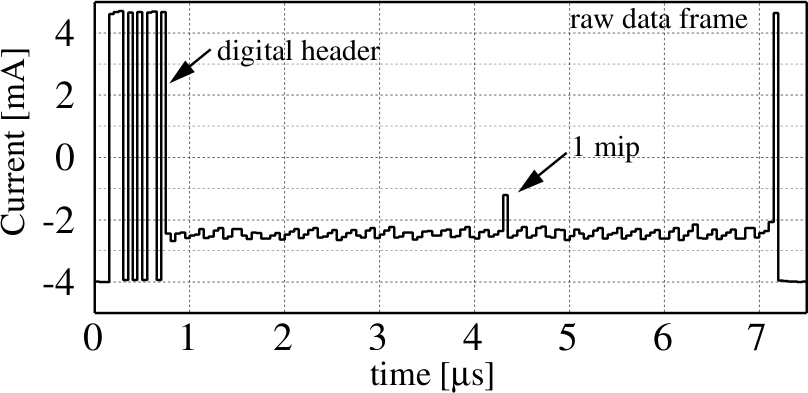
After each trigger the amplitude of all 128 channels are multiplexed to the output stage. Figure 6 shows one output data frame of the APV25. The output data are digitized and sent to a SAM3 [17] VME module via a dedicated backend board [18]. In order to choose the right cell of the buffer to be read out one can set a fixed latency time. The procedure to find the correct latency in the experiment is described in section 3.1.1. In order to be able to measure also particles with a much larger energy depositions than MIPs a capacitive charge divider was used. Figure 7 shows the schematic of this charge divider (C1= and C2=) as it was implemented for every channel. Furthermore a protection circuit (D1 and D2) was embedded.
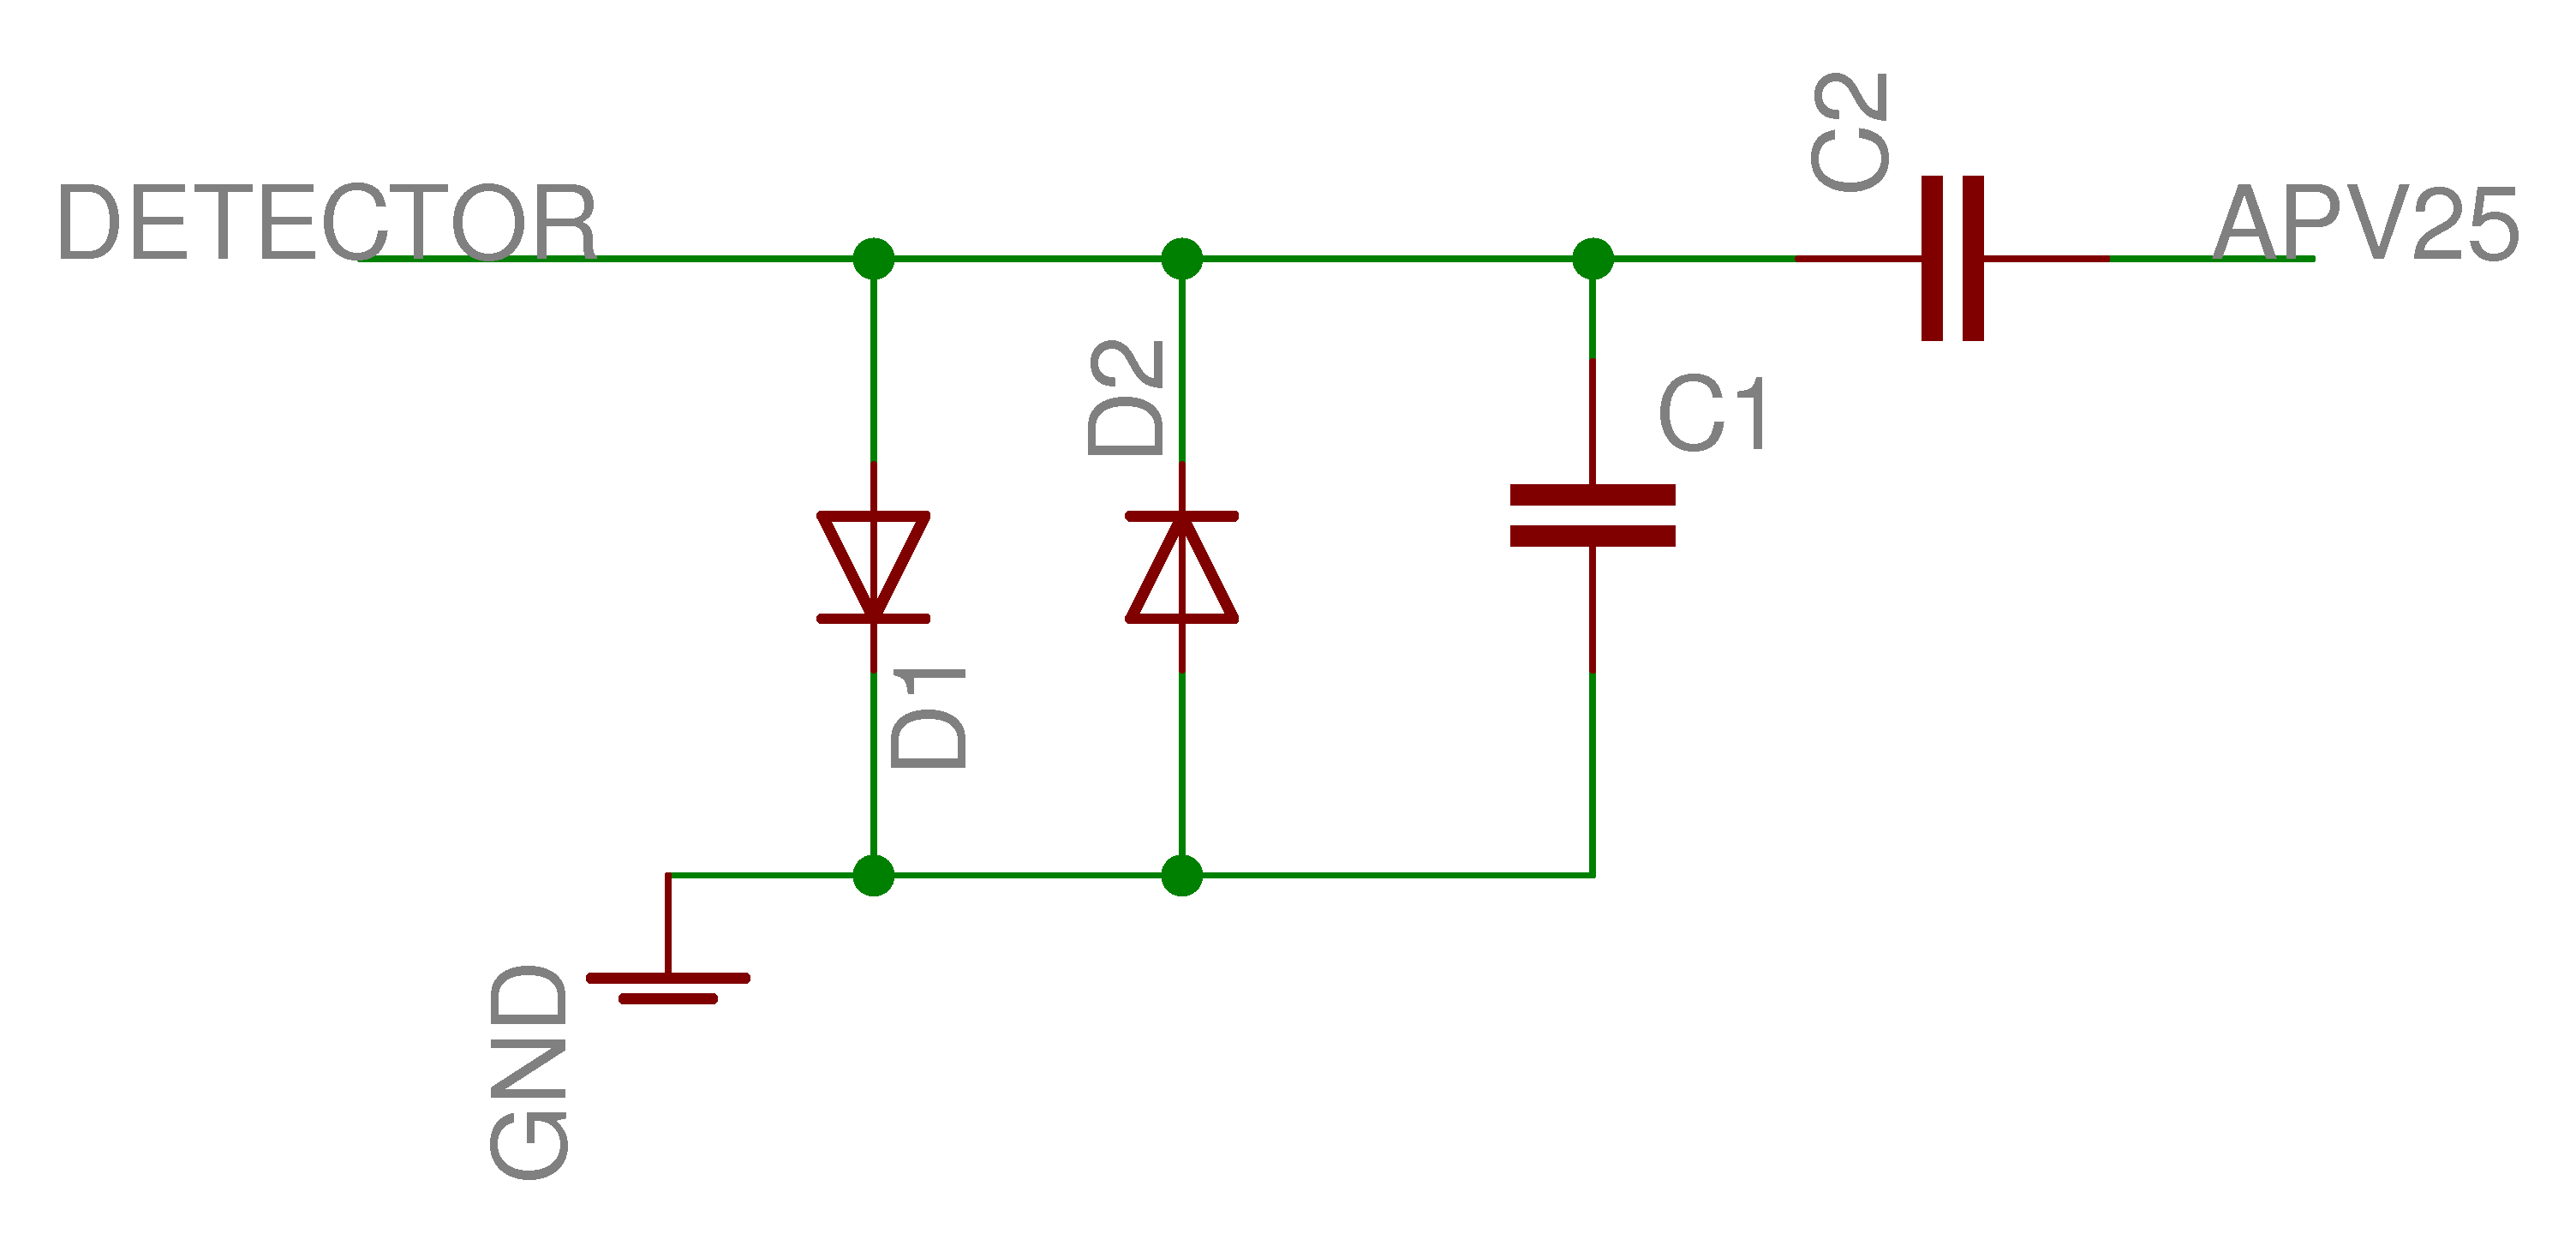
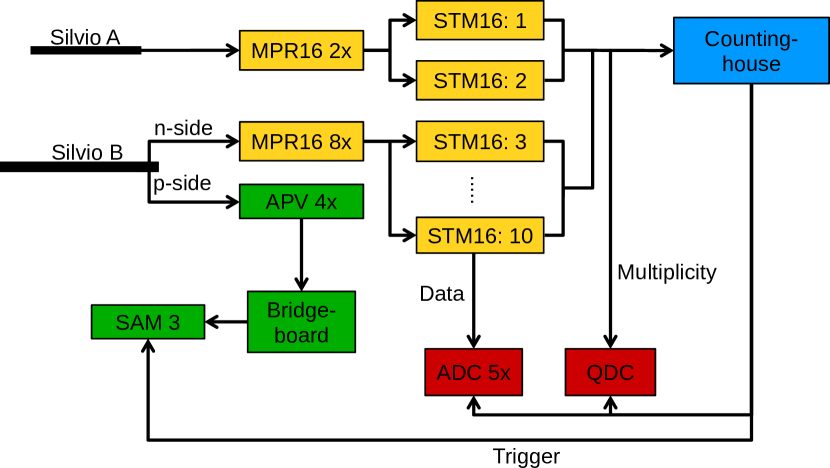
Figure 8 shows the full readout scheme. The signals from SiViO-A and from the n-side of SiViO-B are processed with the analog Mesytec electronics to generate the trigger signal which was sent to the main trigger crate. Here this signal was logically combined with all the other trigger signals from the FOPI detectors. This whole trigger generation procedure together with cable delays took .
3 Detector Signals
3.1 Raw Spectra
The raw signal distributions for the two different readout electronics are shown in Figure 9.
The amplitude distribution for one channel of the analog Mesytec (a) and of the APV25 (b) are shown in Figure 9.
One can clearly see the MIP peak (right peak) well separated from the noise peak (left peak) for both cases.
A signal to noise ratio (S/B) of 29 and of 15 was obtained for the Mesytec and for the APV25 read-out respectively. The events below the noise peak in the APV25 spectrum are caused by the drop of the baseline (see section 3.1.2).
The hardware threshold was set for each channel separately directly above the noise level.
In the offline analysis a threshold corresponding to 3.5 times the noise width was chosen.
The hardware and the software threshold are shown in figure 9 (green line and red line respectively). The energy values were deduced from the calibration with the known energy loss of MIP in 1mm silicon. The energy value of the hardware threshold is deduced from the threshold, which is correlated to the energy.
The values below the noise peak in the APV25 raw spectra (figure 9) are stemming mainly from rare events where a baseline drop occurred (see section 3.1.2).
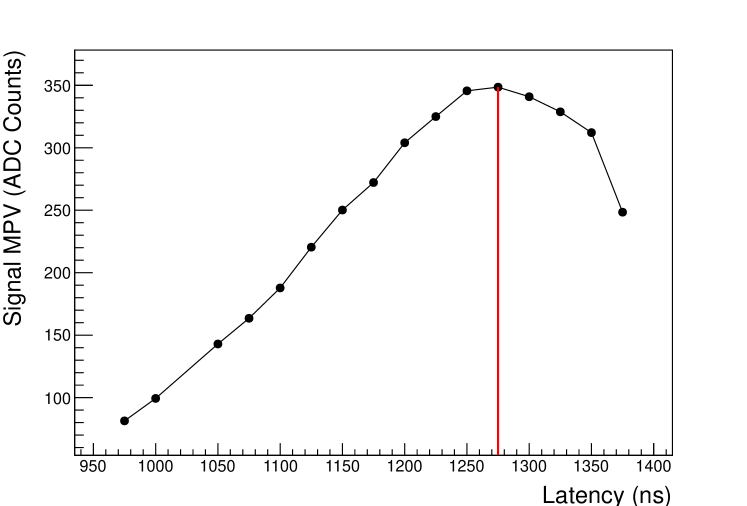
3.1.1 Latency scan
To optimize the signal to background ratio of the APV25 the latency between the internal shaping in the chip to the readout trigger had to be determined and set in the chip, which can be done in units of the sampling clock ( ).
In the setup only one sample is read, which increases the readout speed of the APV25 at the expense of slightly decreasing energy resolution.
The latency was determined by the following procedure:
Around a starting value, derived from the cable length, delays inside the trigger logic and pulser measurement, different latency values were set, each time taking a file with a couple of minutes of beam data.
For each setting the most probable value (MPV) of a Landau fit of the MIP signal, summed over all strips, was determined.
Figure 10 shows the MPV as a function of the set latency value in the APV25. A latency of 1275 ns ( 51 clock cycles) was found to have the highest amplitudes, which is well below the maximum size of the ring buffer.
3.1.2 Baseline Correction
The powering scheme of the APV25 causes particular effects on the offset of the individual channels. In case the power consumption is high, due to either one channel with large amplitude or several hit channels, the baseline shifts to lower values with a special pattern. Figure 11 shows the ADC value plotted versus the channel number of one APV25 chip. For an event with 3 charges particles hitting the corresponding detector a drop of the baseline is clearly visible.
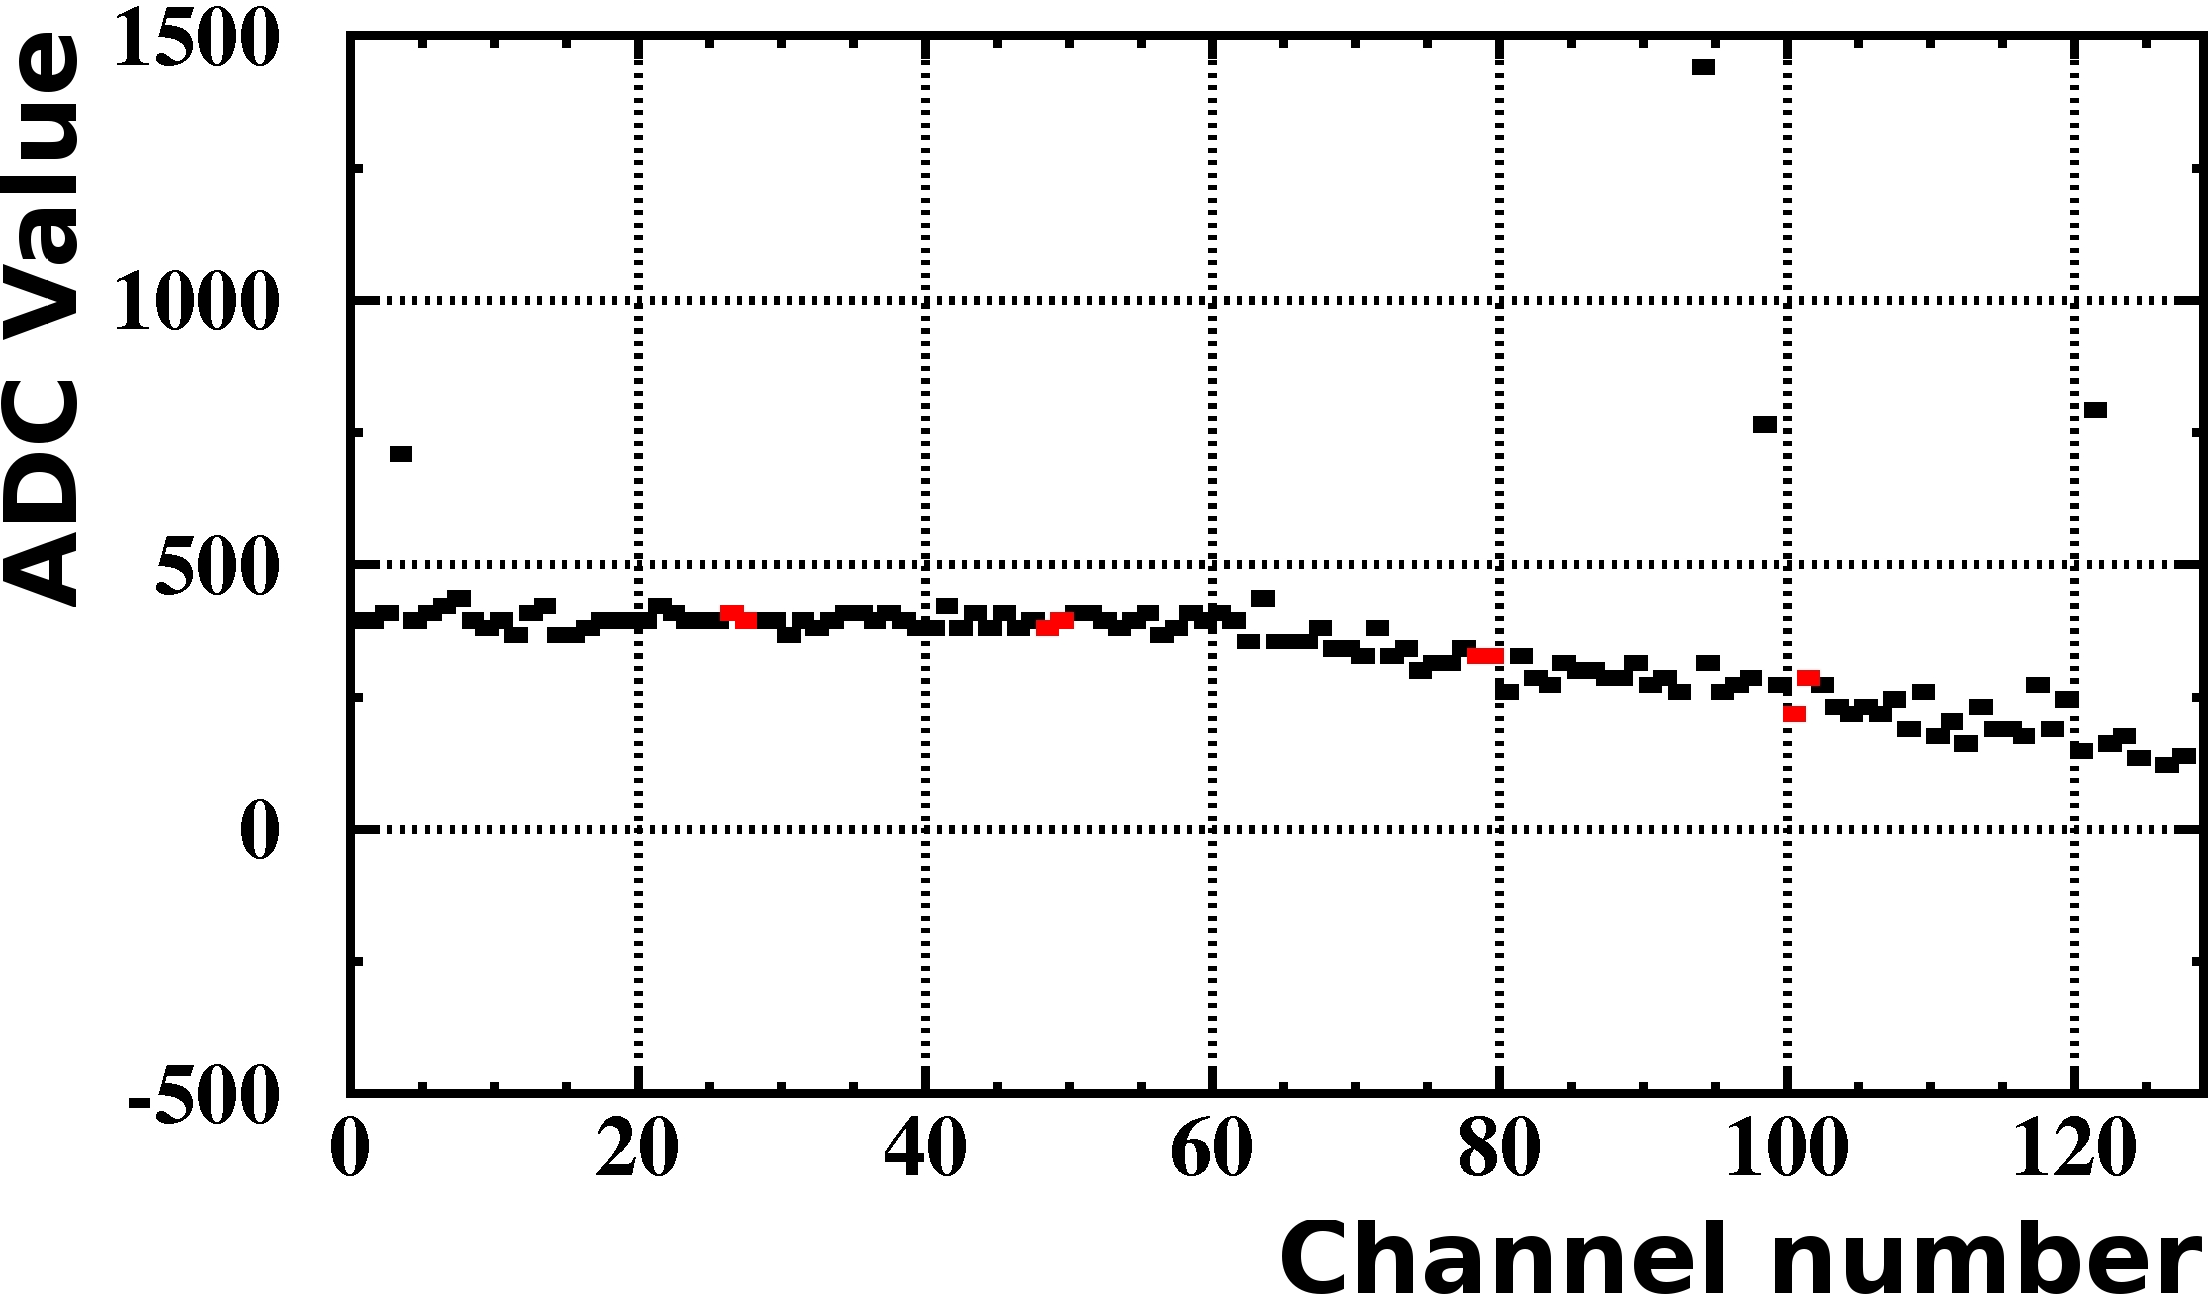
Since in this experiment no zero suppression was applied, the correction for the baseline shift effect can be performed off line. The correction is done by fitting a polynomial function of 5th order to the amplitude vs channel number histogram. Then the data points are shifted corresponding to the fit results in order to restore a common baseline.
3.1.3 Multiplicity -Signals
The multiplicity signal from the STM16+ shapers is used to record the trigger hit multiplicity of the detector layers.
Due to electronic noise, these signals are widened. A clear correlation between signal and hit multiplicity can only be made, if well separated peaks are visible, which can be assigned to different multiplicities. Figure 12 shows the spectrum of the multiplicity signal of the SiViO-B layer. The different peaks, which are labeled with the corresponding multiplicities, are quite well separated.
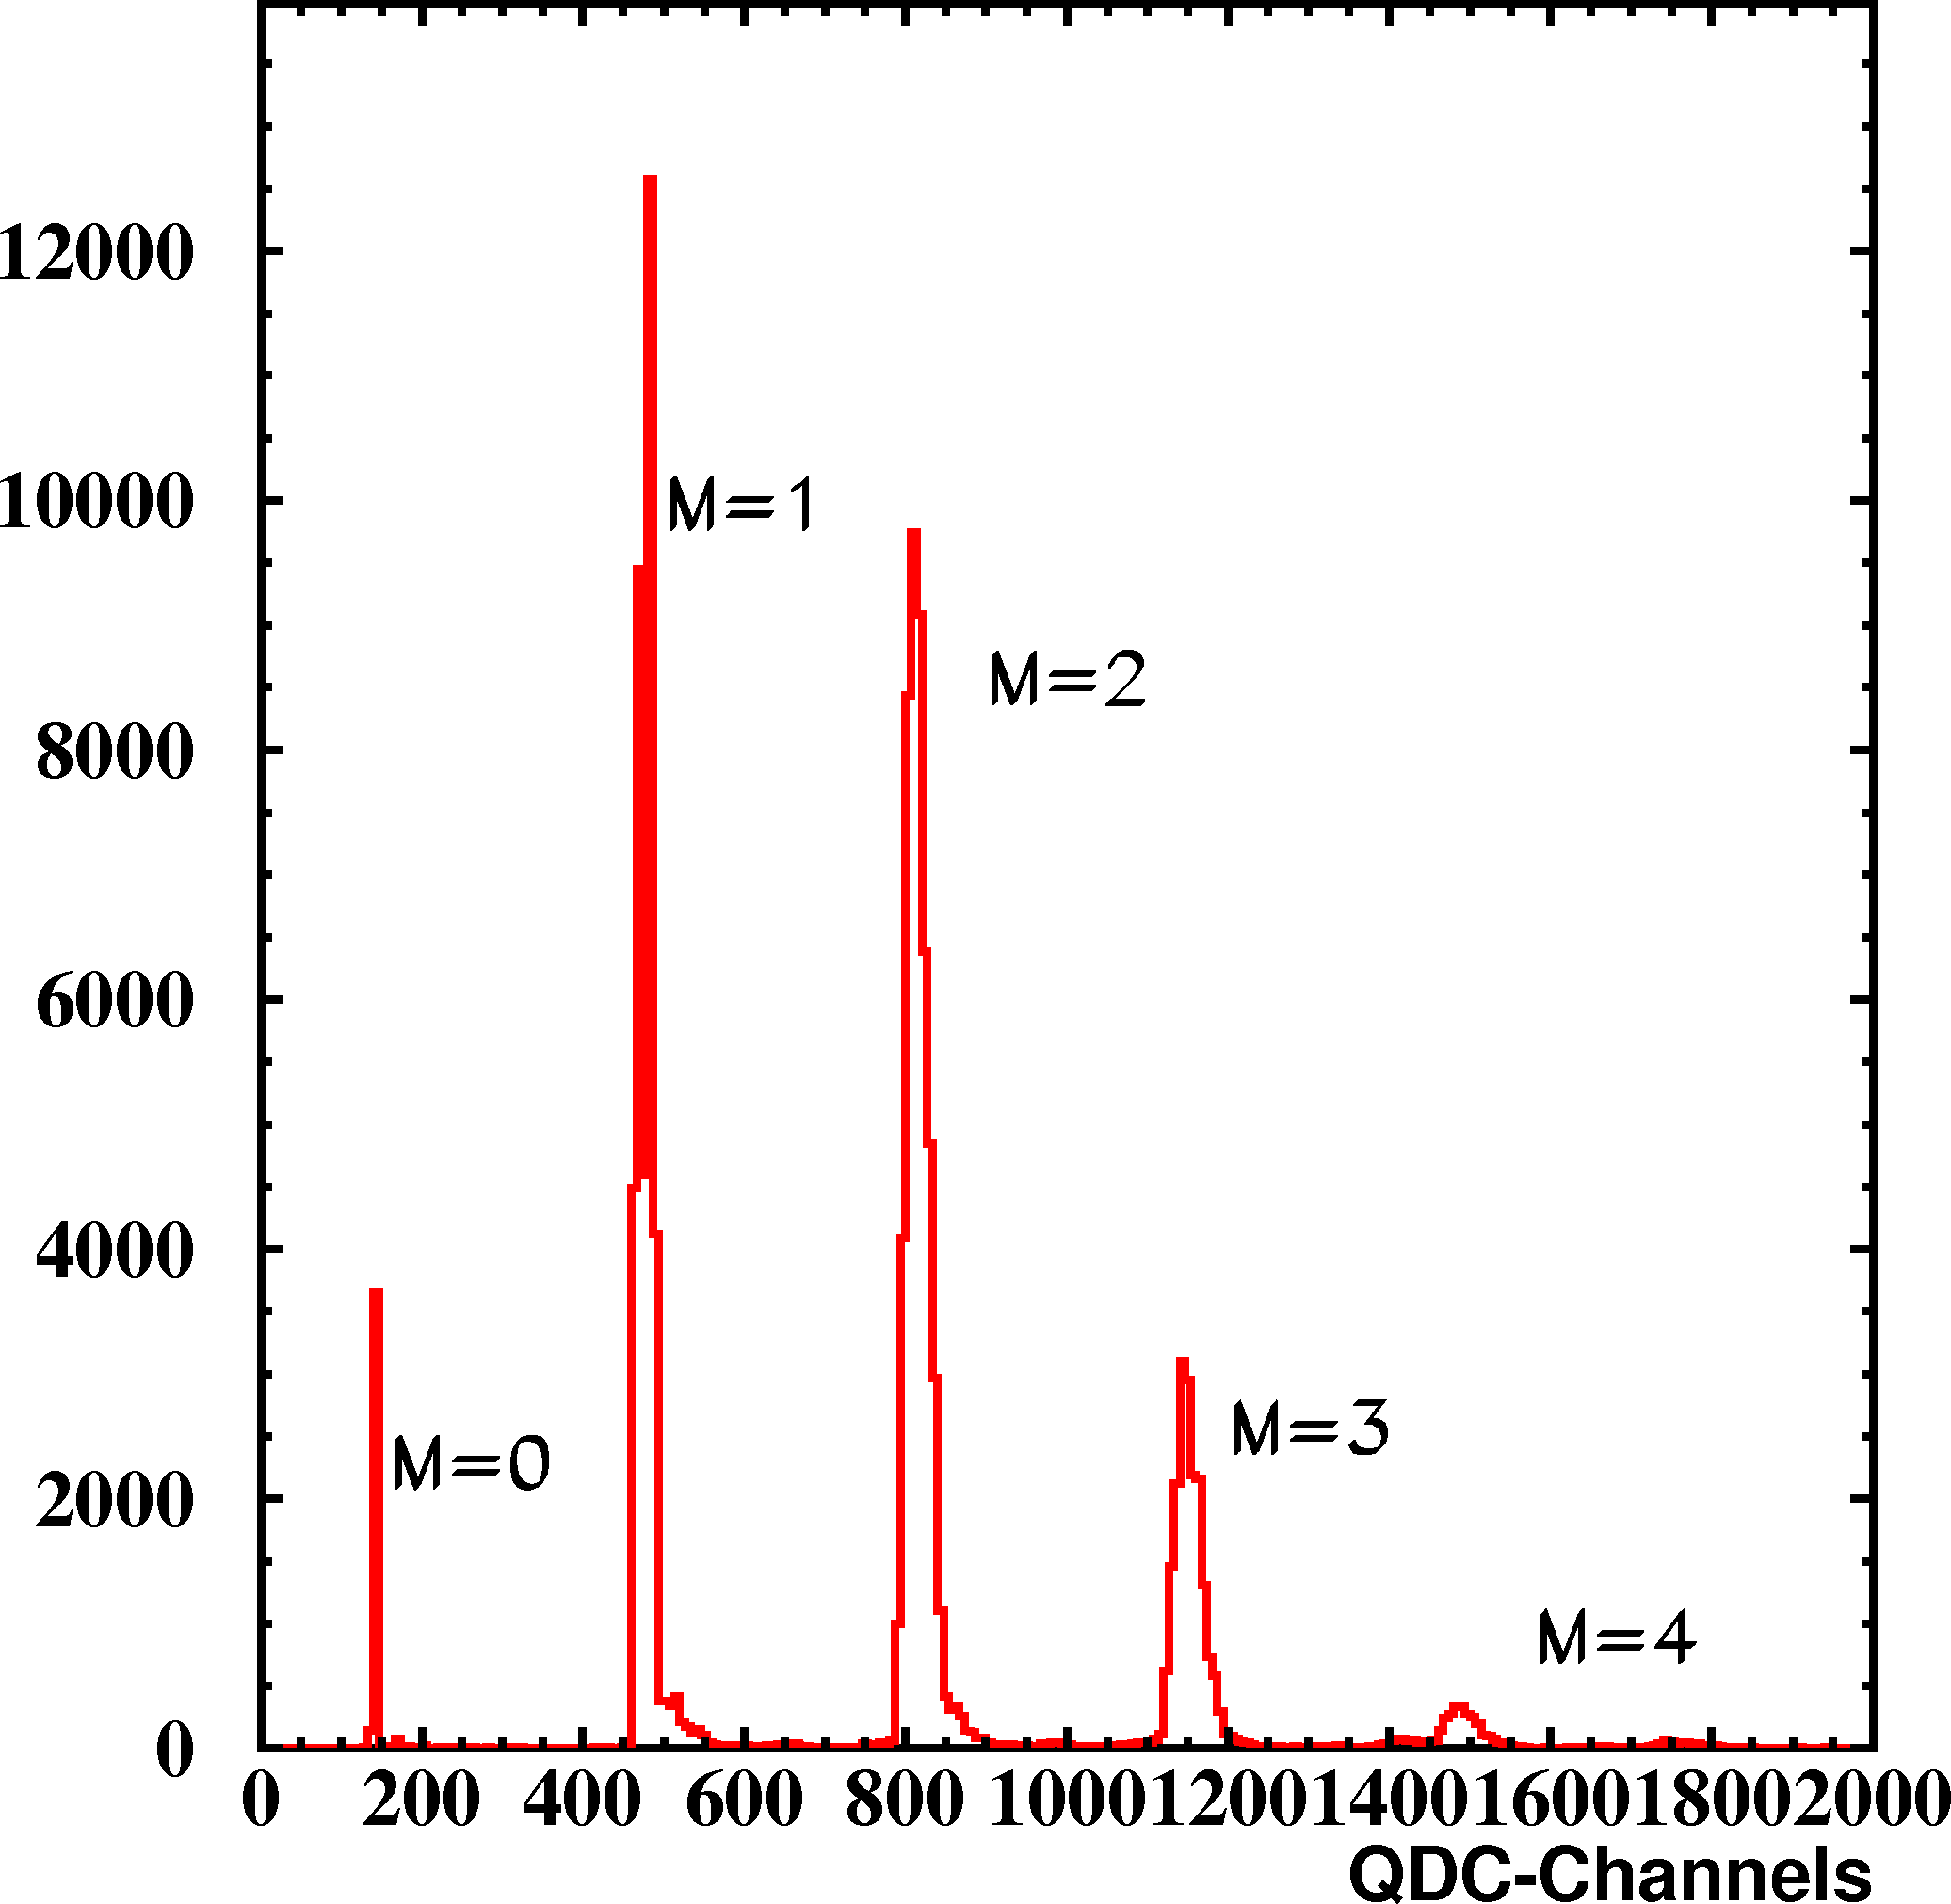
The corresponding multiplicity is selected by cutting around those peaks. The impurities of those cuts are below 1%.
4 Test of Trigger Electronics
4.1 Test of Trigger Electronics
4.1.1 Purity and Efficiency of Electronics
In a dedicated experiment at the FOPI beam line the purity and the efficiency of the trigger electronics was tested. The trigger electronics purity is defined as the fraction of events, in which the selected hardware multiplicity equals the number of reconstructed particles hits. This number is determined in an offline analysis by counting the number of detector strips with a signal higher then the software threshold.
In this experiment two different detectors were used to measure the purity for multiplicities equal 1 and 2 at the same time [19].
The resulting purity values are and of for the multiplicity conditions one and two respectively.
The trigger electronics efficiency is defined by the ratio of single particles passing the detector resulting in a positive trigger response divided by the total number of hits.
To reconstruct the particles passing through the detector, two additional tracking detectors were used. [19]
After disentangling the detector efficiency, the trigger electronics efficiency was determined to be % [19].
4.1.2 Charge Sharing and Clustering
The measured particle multiplicities is disturbed by charge sharing between neighboring strips, induced by cross talk or particle, which do not cross the detector perpendicular to its surface.
In a separate test at the the MLL Tandem accelerator in Garching (TUM) [20] a low intensity proton beam was directed onto the detector at different impact angles from 0 °to 30 °. For each angle the ratio of events with two or three neighboring strips, in which a signal was induced, was measured.[19]
The total influence of the amplitude sharing was determined by folding the charge sharing curve with the expected angular distribution in the experiment, which is .
Three strip charge sharing could be neglected in this angular region [19].
In order to combine the shared charge of two or more neighboring strips a cluster algorithm was employed. This algorithm simply combines neighboring
strips on one detector side which were above threshold and calculates the cluster position by the amplitude-weighted mean of the strip positions. The mean number of strips per cluster for the p- and n-side are and , respectively.
After the clustering, the two detector sides are combined. Every cluster on the p-side is combined with every clusters on the n-side to hitpoint candidates. To determine which combination is the correct one the track information of the other FOPI detectors like the CDC has to be taken into account. For 85% of the cluster on one side was one partner on the other side. This number reflects the detector and readout efficiency.
4.2 Trigger Setup
4.2.1 Trigger Settings
During the p+p data taking with the Trigger installed within the FOPI Spectrometer three different reaction triggers were used.
-
1.
LVL1: The standard FOPI first level trigger was derived from the particle multiplicities in the time of flight detector of the FOPI Spectrometer. The minimal condition was a multiplicity of one hit in the forward () and one in the backward () directions.
-
2.
SiViO: The SiViO trigger condition required that the number of hits on the SiViO-A layer () and on the SiViO-B layer () was set to the conditions and .
-
3.
LVL2: The second level trigger conditions results from the logical AND combination of the main first level and the SiViO trigger condition.
4.2.2 Multiplicity Selection
The effect of the second level trigger on proton-proton reaction data is shown in figure 13, in which the recorded hit multiplicity on the SiViO A versus the multiplicity on SiViO B is displayed.
One can see the effect of the multiplicity selection obtained by applying the SiViO trigger condition (b) in addition to the first level condition (a). The amount of events with a wrong multiplicity condition ((b) blue shaded area) is below 0.7%.
4.2.3 Trigger Rates
Since the SiViO detector is located directly behind the target, the SiViO trigger increases also the amount of events originating from the target. To determine the fraction of trigger reactions, which are not coming from the target, the reaction ratio of the first and second level trigger were measured with and without a filled liquid hydrogen target. The resulting ratios are shown in table 1 together with the first and second level trigger rates. For the target measurement the reduction from LVL1 to LVL2 is in the order of a factor 10 while for the case without target a reduction of a factor of about 100 was measured. Furthermore a comparison between the two cases for each trigger condition shows that the LVL1 trigger is not selective for target events while for the LVL2 condition a significant difference between the target and the no target case can be seen. This clearly indicates that the SiViO trigger condition that determines the most restrictive condition within the LVL2 trigger corresponds to a target-trigger as well. Furthermore if one takes the empty-target data and the corresponding LVL2 trigger rate as a baseline, one can extract a target event purity of the LVL2 trigger to be a the level of 90%. This shows that FOPI without the SiViO trigger is not well suited for triggering on elementary reactions and the usage of the SiViO trigger is mandatory.
| Trigger per Beam particle | LVL1 | LVL2 |
|---|---|---|
| Target | ||
| No target | ||
| Ratio | % | % |
5 Tracking and reconstruction
5.1 Matching and Refitting
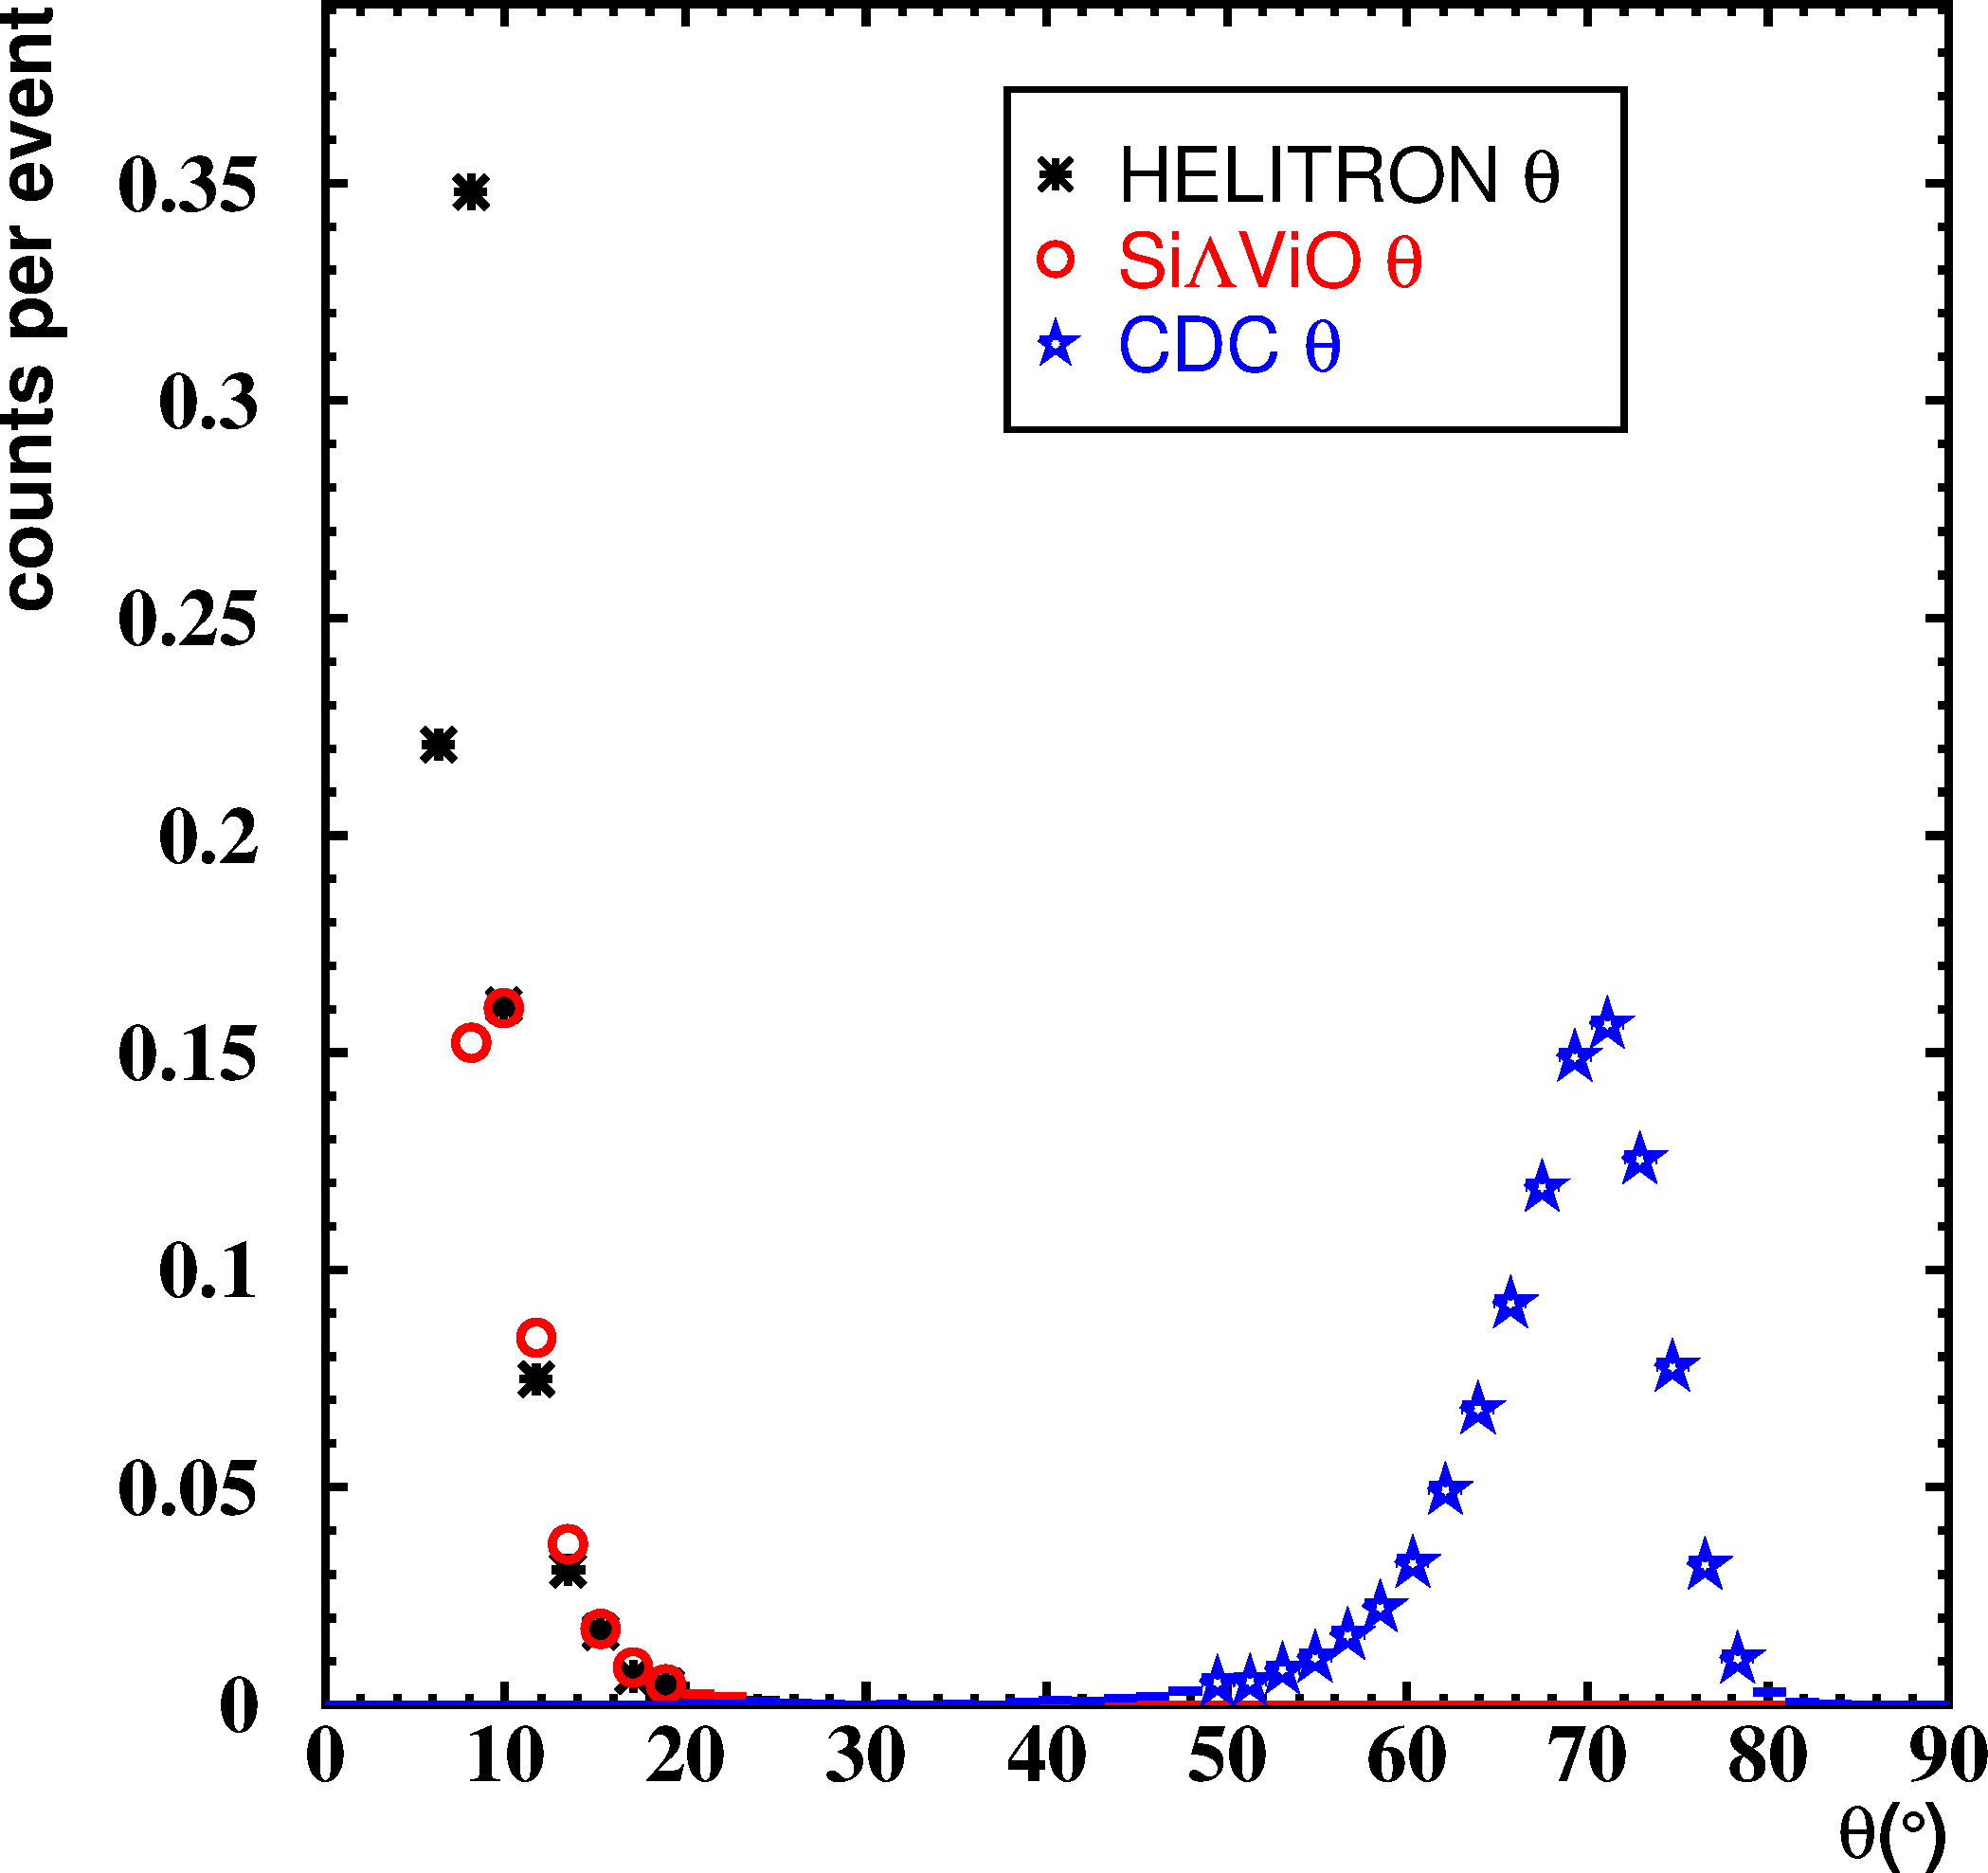
Since SiViO is meant to improve the tracking performances in the forward direction, it was build to overlap geometrically with the forward drift chamber Helitron. This can be seen quite good in the distribution of the polar angle of reconstructed tracks in SiViO and the two drift chamber CDC and Heltiron (figure 14) for elastic proton-proton reactions. In the forward direction SiViO totally overlaps with the Helitron drift chamber between 10 ° and 20 °. Below 10 ° the acceptance of SiViO is lower, due to the shape of the SiViO B plane. The hit points of the SiViO detector have first to be combined with the information delivered by the other FOPI sub-detectors and then in a second step the tracks have to be refitted.
5.1.1 Matching
Each hit point on the SiViO-B layer is combined with the track information of the Helitron drift chamber of FOPI via geometrical matching.
Since the particles are flying through the solenoid magnetic field of FOPI, the tracks of the drift chambers are extrapolated up to the plane orthogonal to the beam axis at the same z-position as the SiViO-B layer.
Figure 15 shows the distance between the reconstructed position on the SiViO-B detector and the extrapolated point from the tracks in the forward drift chamber. The width of the distribution is mainly caused by the measurement of the Helitron.
All combinations within a cut on the distance for both the x and y coordinates are accepted. In case of more than one accepted SiViO-B hit, the hit with the smaller distance is chosen.
The amount of mismatched tracks was determined by simulation and found to be lower than 5%.
The ratio of Helitron tracks matched with SiViO hits to all Helitron tracks falling within the SiViO acceptance, which corresponds to the matching efficiency, is shown in figure 16 as a function of different track parameters: the laboratory angles and and the momentum . One can see a homogeneous distribution with an average matching efficiency of 91.2 0.6 %.
5.1.2 Refitting - Momentum Resolution Improvement
By adding the SiViO hit point to the track reconstruction in the forward direction one can improve the momentum resolution.
The track fitting is repeated considering this additional point, which can improve the momentum resolution slightly, which is dominated by the resolution of around 8 cm along the drift wires in the Helitron (perpendicular to the beam axis) [21].
In the first step the polar angle of the particle is recalculated.
Since FOPI is using a solenoid magnetic field, the particle trajectories are straight in the rz-plane.
Without SiViO, the polar angle of the particle is calculated using the hit-point information of the plastic wall, under the assumption, that the particle originated from the vertex.
With the SiViO hit point the vertex-assumption can be discarded and a more realistic theta can be calculated.
The second step is to fit a track to all the available hit points and calculate the momentum of the particle [22].
The resolution improvement, achievable with this procedure, was tested with the help of simulations.
The resolution is defined as:
| (1) |
The resolution for pions and protons with and without the refit is shown in figure 17, as the width of the distribution of equation 1 for the second level trigger condition. One observe that for the pions an average improvement of 4% is possible while for the protons more than 5% improvement is achieved. The limited improvement is caused, by the fact, that the momentum resolution is manly dominated by the point resolution in the Helitron.
5.2 Offline Reconstruction
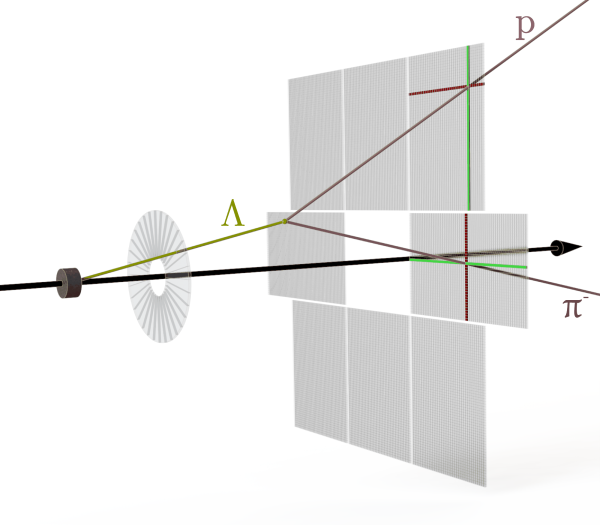
hyperons are reconstructed via their decay into a negative pion and a proton. The invariant mass of all proton and pion pairs either indentified in the CDC or the Helitron is calculated. The usual particle identification cuts employed within the FOPI analysis have been used [23].
To reduce the amount of uncorrelated background additional cuts on the decay vertex have to be applied. The presence of SiViO allows to calculate a vertex position in case a particle is flying though the Helitron, which would not be possible without the additional track point, due to the vertex assumption of the tracking procedure. Since the hyperon has a decay length on average the vertex of its decay position can be separated from the primary vertex. Other uncorrelated proton-pion pairs are stemming from the primary vertex.
In order to select hyperon candidates, the position of the primary vertex is recalculated under the assumption that each combination stems from a decay. The constructed ’’ vector666’’ vector: Sum of proton and momentum is used together with the other measured particle vectors to determine the primary vertex position. If more than one combination is found, these for which the recalculated vertex position is outside the target volume is discarded. These specific cuts applied to the recalculated primary vertex position are summarized in table 2. As additional cut on the distance between the primary and the secondary vertex is applied to reduce the combinatorial background. All cut values used are listed in table 2.
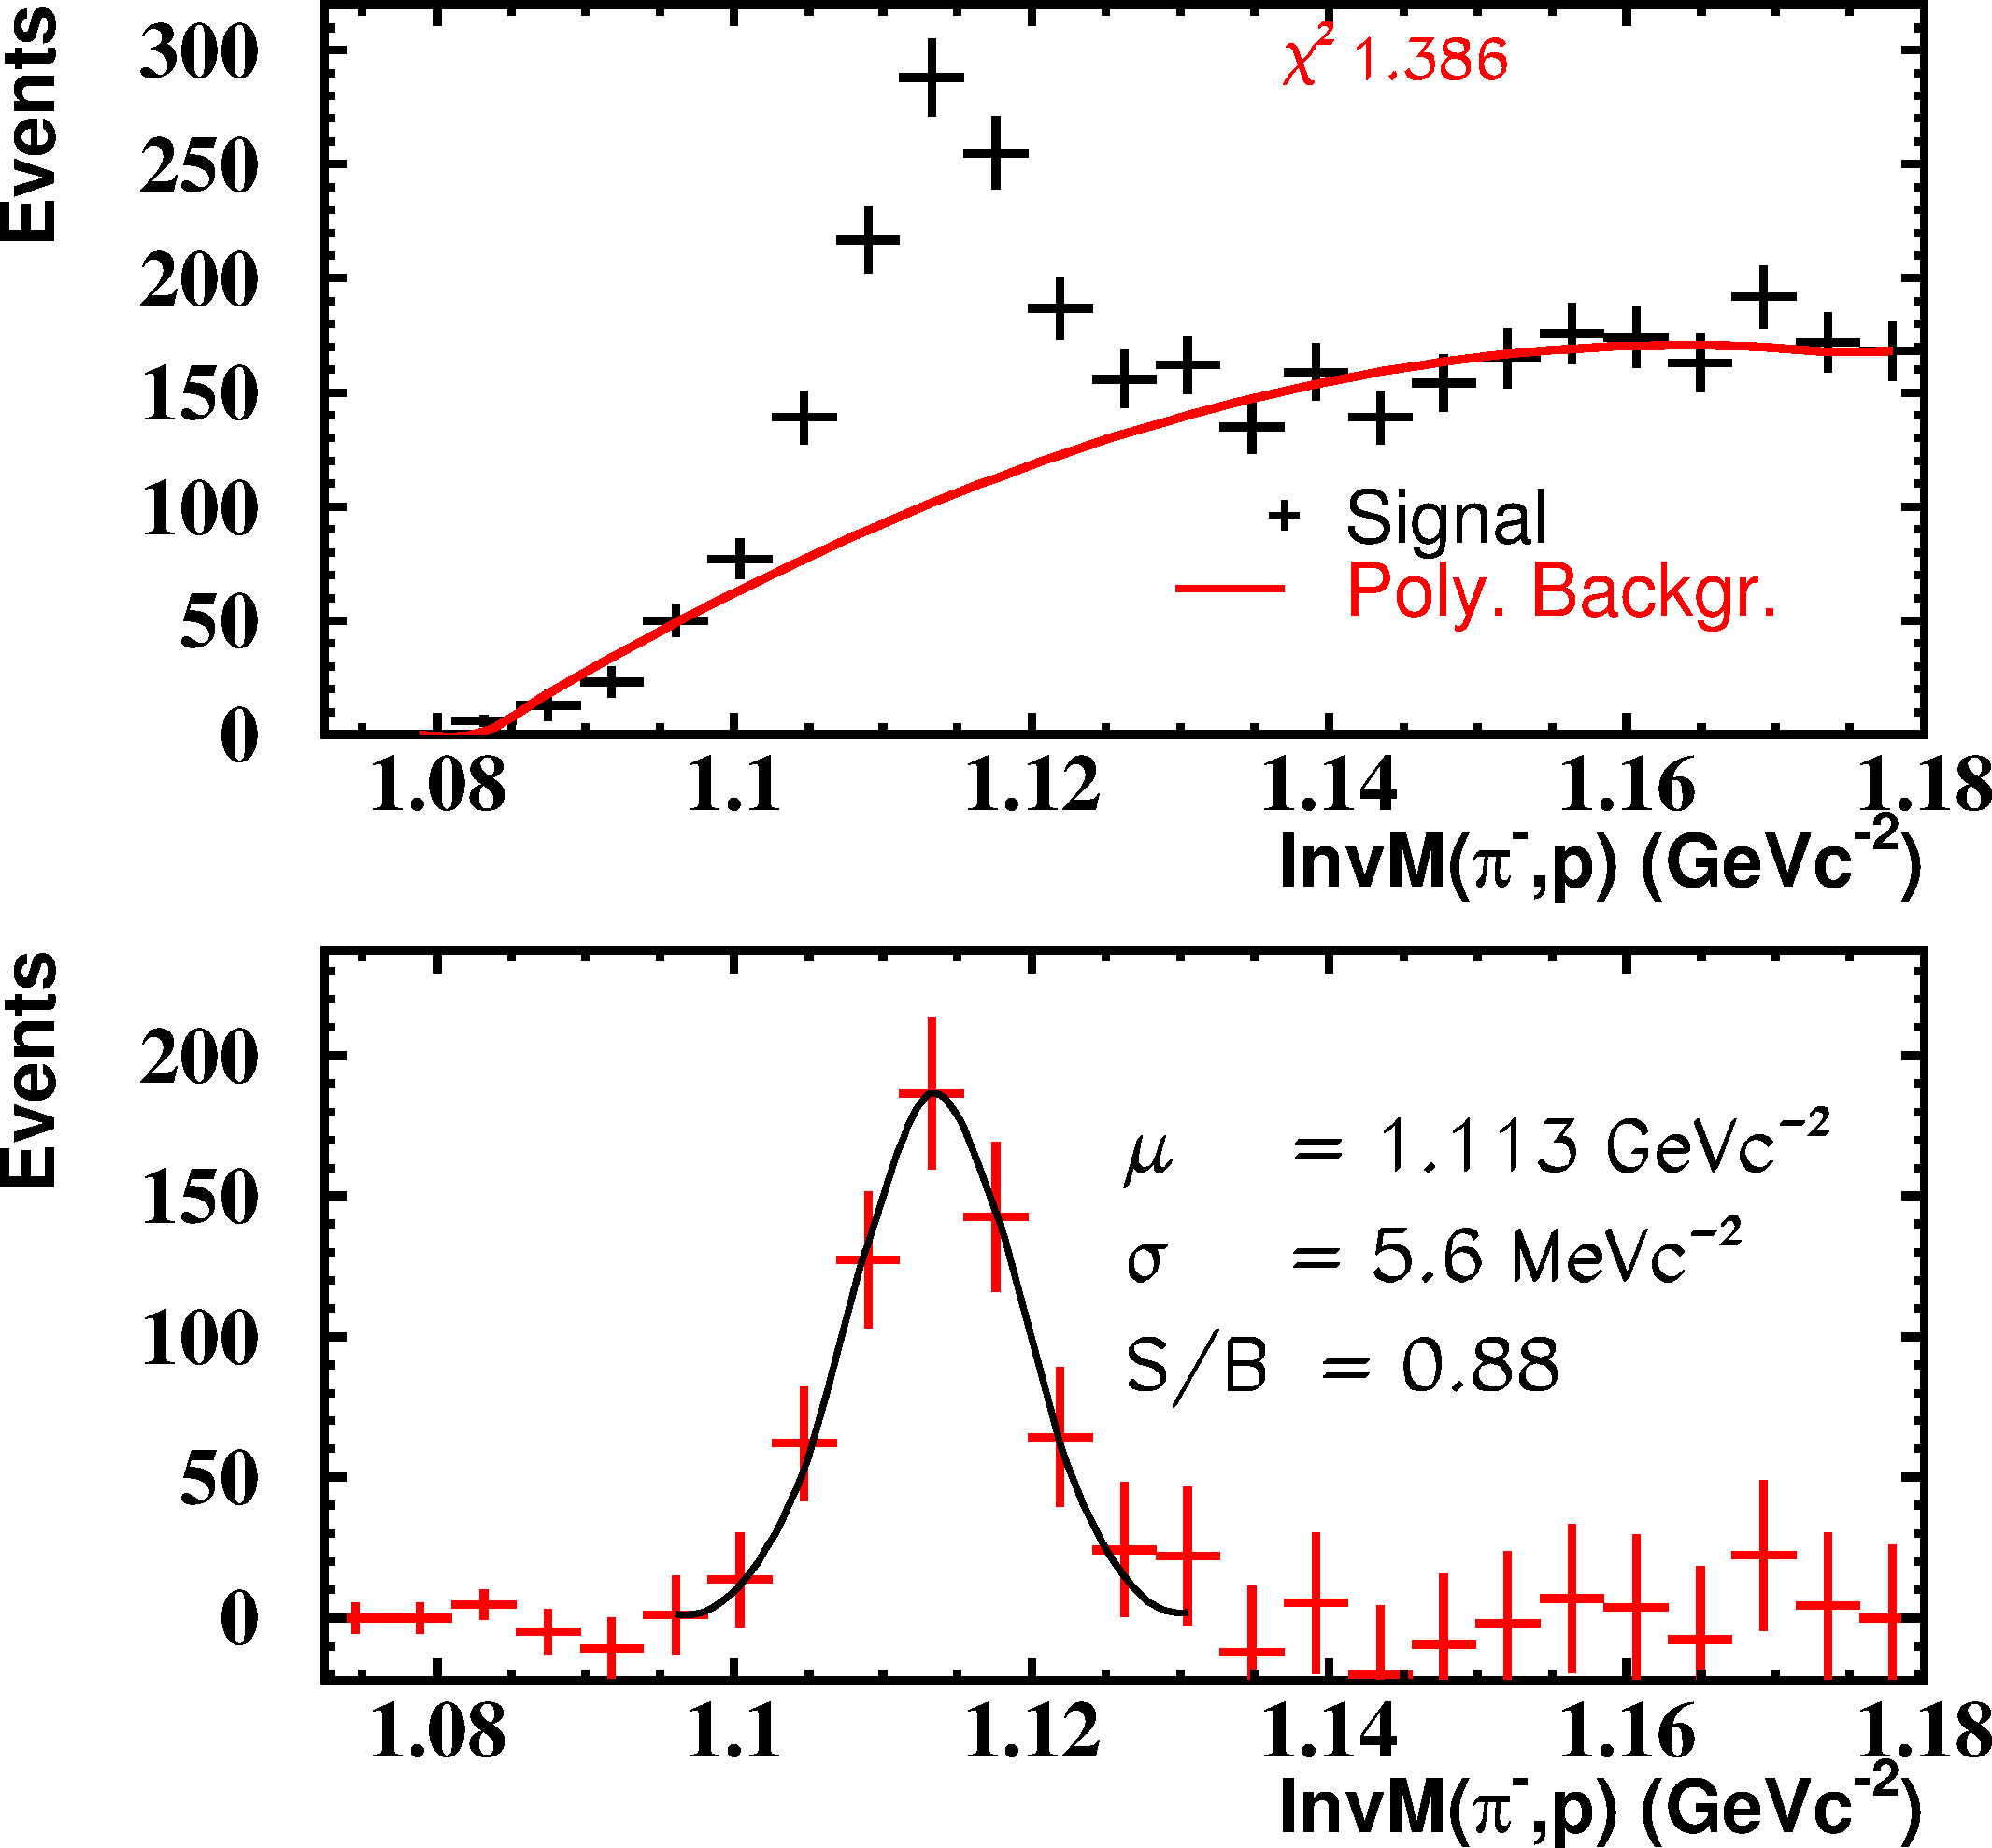
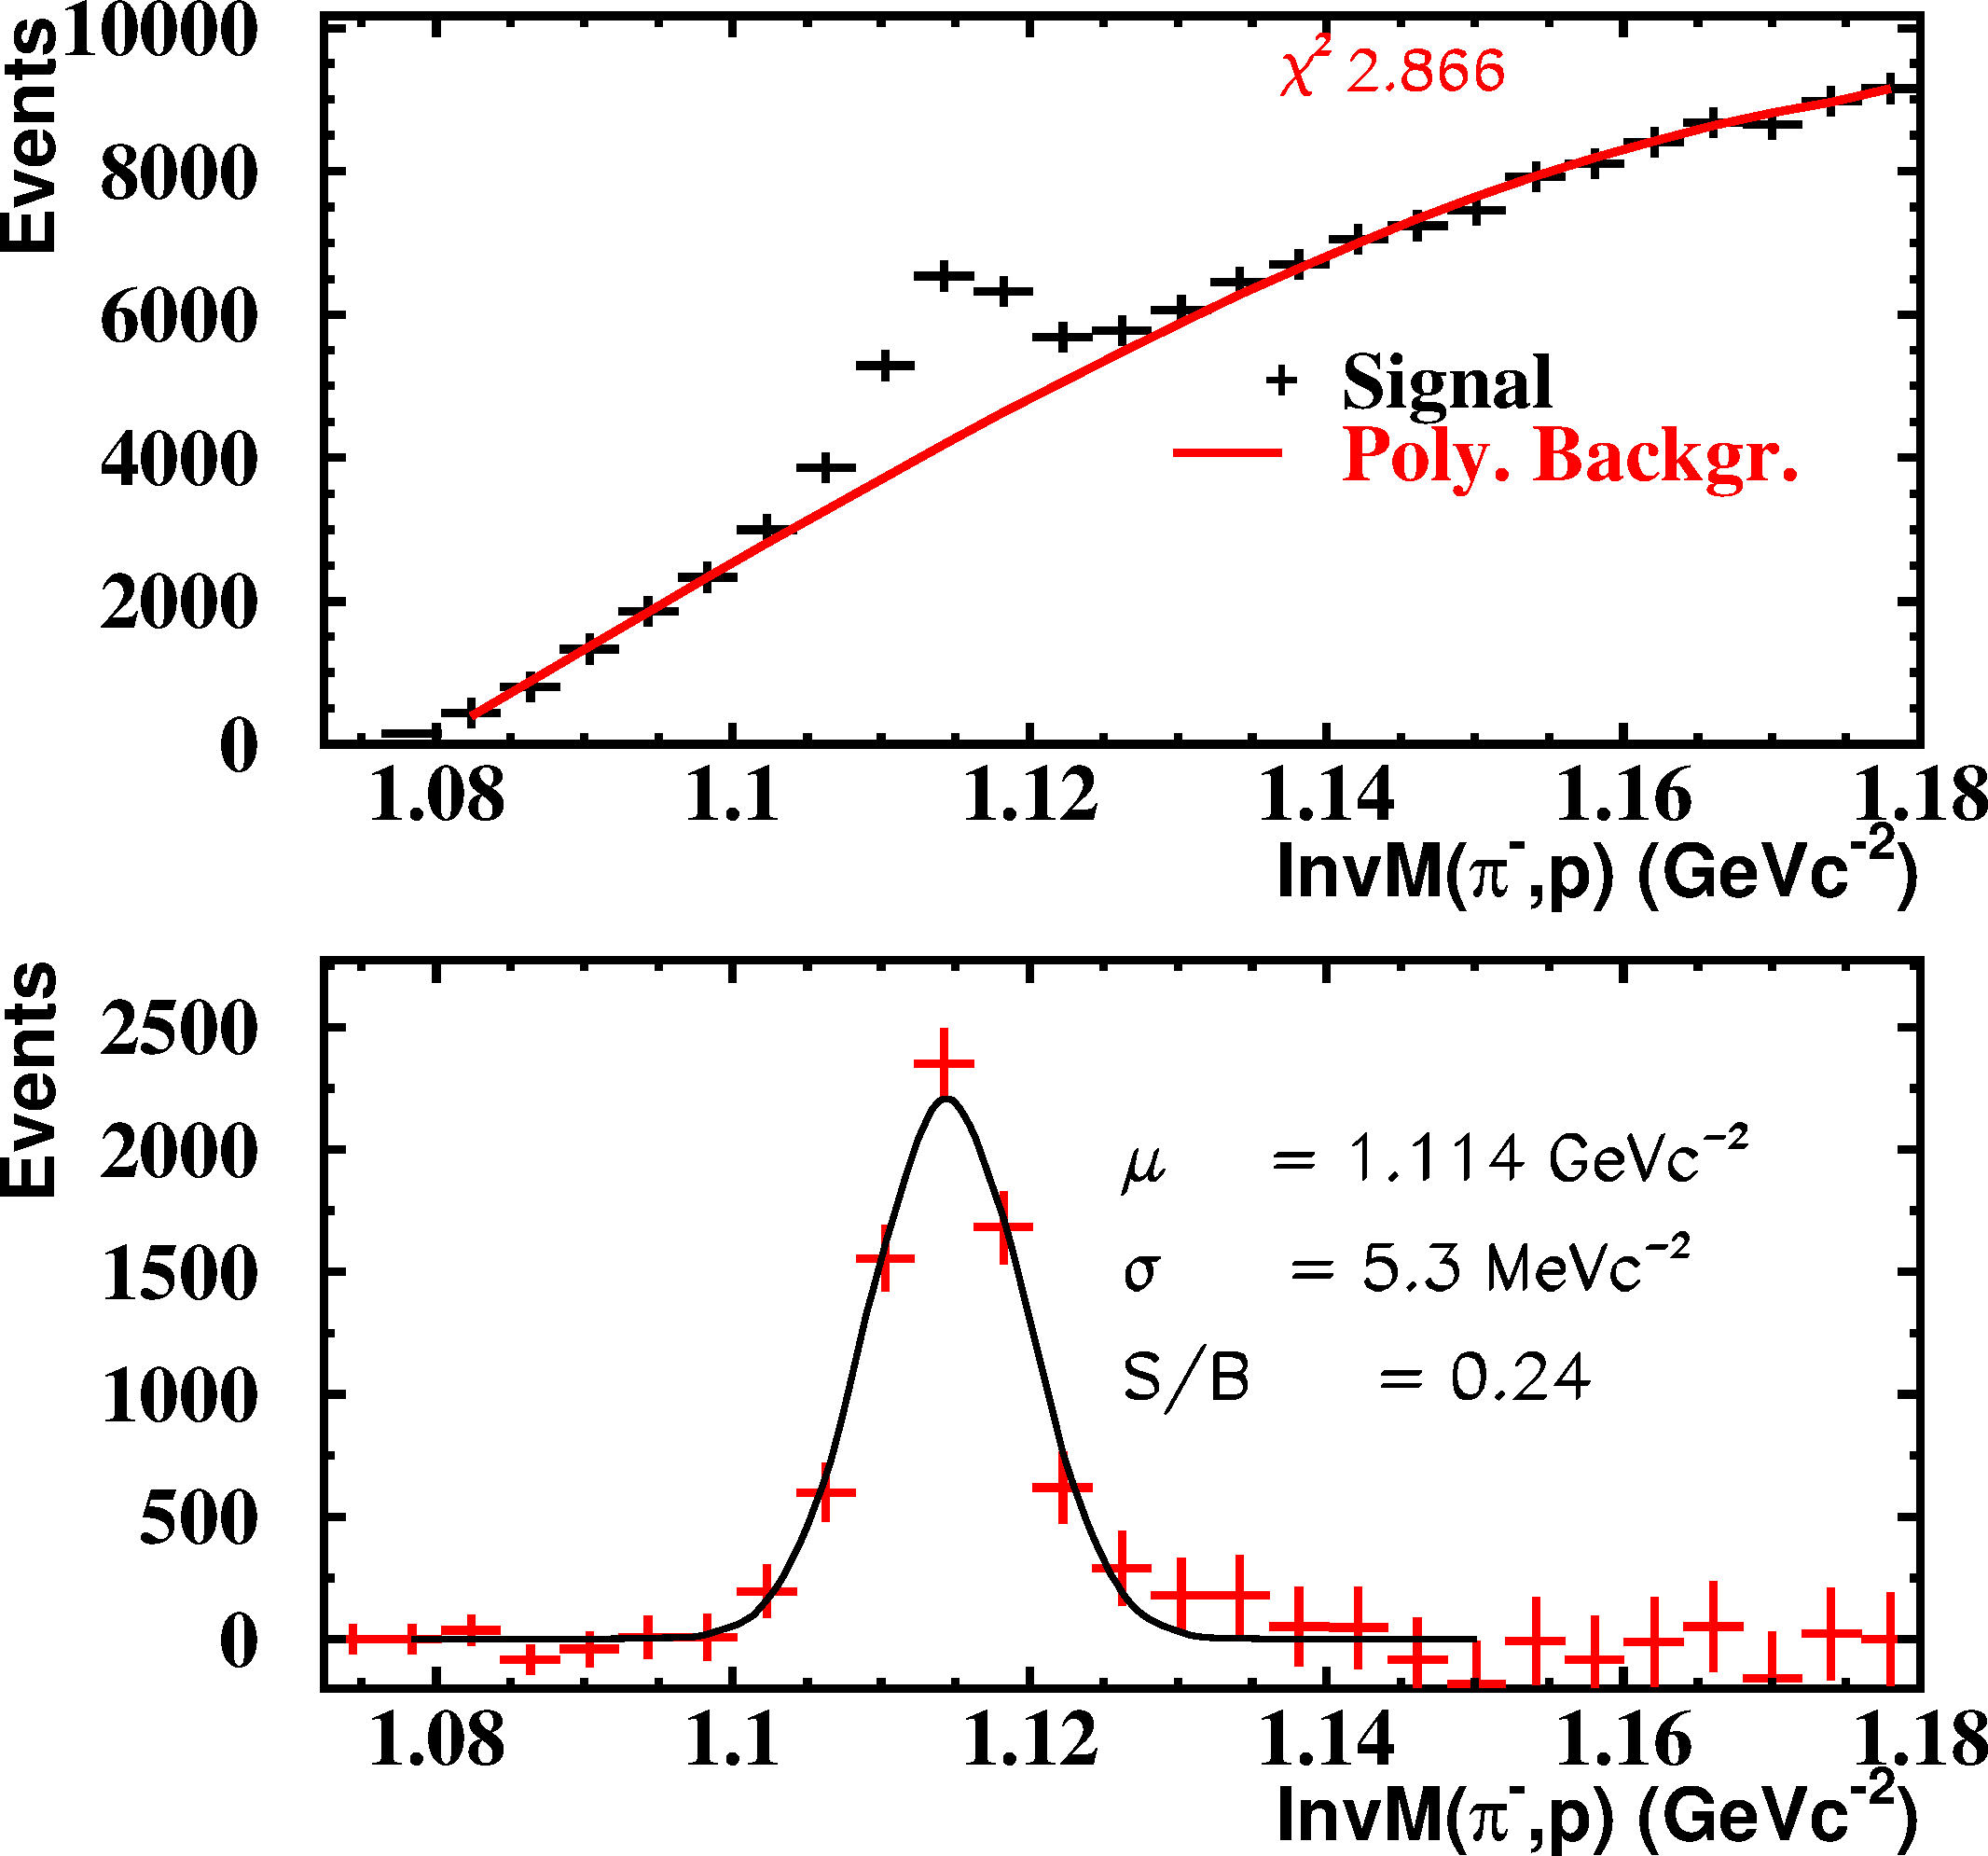
Figure 18 and figure 19 show reconstructed particles for UrQMD simulation and experimental data for the reaction p+p at 3.1 GeV.
The upper panels show the invariant mass of all p- pairs after applying the vertex cuts mentioned above.
These spectra were fitted by the sum of a Gaussian and a polynomial function. The polynomial function is represented by the red curve.
The lower panels show the background-subtracted signal of the invariant mass.
The black line represents a Gaussian fit to this spectrum and delivers the mean () and the width () of the reconstructed particles. One can see that a mass resolution (expressed in ) of and has been achieved for the simulated and experimental data respectively. These results refer to candidates where the candidate was detected in the CDC and the proton in the Helitron.One can see, that the data and simulation - including the trigger selection - are rather comparable as far as the resolution is concerned but the yield looks different, as well as the signal to background ratios of 0.88 in simulation and 0.24 in data. The optimization procedure of the detector digitizers will not be discussed in this work, but the efficiency of the apparatus is rather well under control in simulations. Still the inclusive production cross-section and the simulated angular distribution are directly coming from UrQMD and could be rather far away from the experimental data. A dedicated tuning of these variables is currently on-going to finalize the physics results extracted from this measurement.
6 Trigger Performance
6.1 Event Reduction and Background Suppression
The trigger settings described in section 4 are meant to increase the content of the recorded events but they obviously introduce a bias for the accepted events. This effect must be accounted for if one wants to extract final cross-sections and can be estimated with the help of simulations by comparing reconstructed data to Monte Carlo tracks.
For this purpose the signal was generated with PLUTO [24] programm including the angular distribution extracted from [25] for the hyperon. For the simulation of the background UrQMD events without strangeness production [26] were used.
| LVL1 | LVL2 | |
|---|---|---|
| Signal () | ||
| Background | ||
| Bkg. Supp. |
In table 3 the acceptance for the signal and background events are listed for different trigger conditions as well as the resulting background reduction for the LVL1 and LVL2 condition. The error values for the background suppression are dominated by the error values of the angle correction taken from [25].
The rather low acceptance for the signal events is mainly caused by the fact that a charged particle hit is required in the region covered by the RPC or Barrel detector. Indeed a good kaon identification is mandatory to select the reaction and this is possible only exploiting the RPC device. This explain the numbers shown in table 3.
For the LVL1 the background reduction is and for the the LVL2 trigger condition , which corresponds to a signal to background from LVL1 to LVL2 within the geometrical acceptance region of a factor . The statistical (stat) errors and the ones from the angular correction ([25]) (ang) are shown separately. Moreover the LVL2 settings enable an efficient suppression of the off-target events, as discussed in section 4.2.3. The efficiency of such selection yields about , which translates into of events that stem from off-target reactions and are recorded by the LVL2 trigger. On the other hand the LVL1 sample is highly contaminated by off-vertex events and this contamination, which was evaluated quantitatively from the empty-target measurement, must be accounted for in the evaluation of the trigger performance.
6.2 Enhancement of Events
To determine the experimental enhancement of the signal reached through the LVL2 settings, the reconstructed signal per event for the LVL2 and the LVL1 trigger conditions was compared. For this purpose, -hyperons were reconstructed in both data samples, employing a wider selection cuts in dr ( cm) than in table 5.2 in order to enhance the signal content; again in the CDC and proton in the Helitron hemisphere were selected. Figure 20 shows the resulting invariant mass plot distributions obtained for the LVL1 (left panel) and LVL2 (right panel) samples. Due to the less stringent cut conditions, the width of signal increased slightly with respect to the results discussed in section 5.2 from to , while the signal to background ratio stays quite stable at a value of . The signal yield was extracted by integrating the distribution in a interval around the fitted mean value . One can see that the signal is barely visible for the LVL1 events, even if figure 20 corresponds to the total collected statistics; indeed the signal to background for the reconstructed goes down to 0.13. For this reason a lower limit of the -enhancement factor can be only calculated.
| Signal per Event () | LVL1 | LVL2 |
|---|---|---|
| Data | ||
| pp Simulation |
In table 4 the number of reconstructed candidates per event for the LVL1 and LVL2 samples are shown. The systematical errors were obtained by varying the reconstruction cuts within . One can see that the number of the reconstructed in the experimental data and in the simulations is in agreement within the error. Possible differences might arise from the uncertainty of the total production cross-section in the simulations, hence one should focus more on the comparison of the ratios. From these resulting values the enhancement is finally obtained by the division of the signal per event of LVL2 triggers for the value obtained from the LVL1 sample. The LVL2 to LVL1 enhancement factor obtained in the simulation is which is in quite good agreement with the enhancement of the pure geometrical acceptance (see section 6.1).
The LVL2 to LVL1 enhancement obtained from the data is , where the huge statistical error is due to the scarce statistics of reconstructed in the LVL1 sample. This number is much larger than the value obtained for the simulation due to the fact that the simulations do not contain off-vertex reactions. If the simulation results are corrected for the fraction of off-vertex interactions in the LVL1 and LVL2 respectively, a enhancement factor of is obtained, which is in good agreement with the experimental data. This way the performances of the LVL2 trigger have been proven and quantitatively verified.
7 Summary
We have presented the design, development and performance of SiViO. This device is composed of two layers of silicon detectors and was developed to function as an online trigger for hyperon decay in from p+p collisions at . SiViO was built to fit inside the FOPI spectrometer at GSI, closed to the target region and was utilized during an experimental campaign with the dedicated goal to look for the existence of kaonic bound states like by analyzing the final state . The silicon detectors were read out with two different systems. On the one hand side the analog Mesytec modules were employed to compute the multiplicity of the hits by charged particles on the two silicon layers and build the online trigger. On the other side, the p-side of the second layer of SiViO was read out with the front-end APV25 chip, to be able to handle the 480 strip signal in the offline analysis. The shown design resulted in a compact structure.
The efficiency and purity of the online trigger for the MIPs signal was extracted by measurements with beam and were discussed in this work. It resultes into an efficiency and purity of and at least (Multiplicity=1) respectively. The effect of the trigger device on empty-target events was studied,too. The LVL2 trigger, built by combining the FOPI LVL1 trigger with the SiViO multiplicity information, turned out to be also very efficient as a reaction trigger, since it could suppress empty-target events with a purity of .
The momentum resolution of the FOPI spectrometer in the forward region is rather poor, the additional hit point provided by the SiViO B layer could improve the momentum determination of about for protons emitted in this phase space region. The SiViO hit information also improved the reconstruction of the secondary decay vertex for hyperons, yielding to a reconstructed invariant mass resolution of . This value extracted for the experimental data sample is comparable with the full-scale simulation.
The performance of the trigger was evaluated first by means of the full-scale simulations of the reaction and of the background reactions excluding the production. The background reduction achieved by employing the LVL1 and LVL2 trigger condition extracted with the simulations is determined to be and respectively. These factors contain only the effect of the geometrical acceptance of the events, before the hyperon reconstruction. The enhancement of events containing a candidate was studied in the experimental data comparing the hyperon reconstruction achieved for the LVL2 and LVL1 sample. Due to the limited statistics of the LVL1 sample, a large systematic error must be considered for the experimental ratio which was found to be . By including in the simulation the hyperon reconstruction and the contribution by the empty-target events, a final value of was obtained which is in very good agreement with the experimental findings.
In this way the effectivity of SiViO was verified.
8 Acknowledgements
We would like to thank Robert Gernhäuser and Jürgen Friese for reading and commenting the manuscript.
This work was supported by the Helmholtz VH-NG-330, by the DFG cluster of excellence ʻOrigin and Structure of the
Universeʼ and the TUM Graduate School. Part of the work was supported by the Austrian Science Fund FWF Project P21457-N16.
References
- [1] M. Maggiora et. al., IEEE Trans. Nucl. Sci. 45, 817 (1998).
- [2] M. Dahmen et al., Nucl. Instr. Meth. Phys. Ref. A 97 (1994).
- [3] J.Ritman et al., Nucl. Phys. Proc. Suppl. 44, 708 (1995).
- [4] Fopi-Collaboration, Search for kaonic nuclear cluster in the reaction with FOPI, Experimental Proposal to GSI, 2007.
- [5] T. Yamzaki and Y. Akaishi, Phys. Rev. C 65 (2002).
- [6] T. Yamzaki and Y. Akaishi, Phys. Rev. C 76 (2007).
- [7] X. Lopez et al., Prog. Part. Nucl. Phys. 53, 149 (2004).
- [8] K. Hildenbrand, GSI Nachr. 91-02, 6 (1992).
- [9] A. Gobbi et al., NIM A 324 (1993).
- [10] A. Schüttauf, NIM A 553, 65 (2004).
- [11] A. Schüttauf et al., Nuc. Phys. B 158, 52 (2006).
- [12] P. Bühler, O. Hartmann, M. Schafhauser, K. Suzuki, and J. Zmeskal, Start counter and target system for the FOPI S349 experiment, GSI Annual Report, 2009.
- [13] http://www.canberra.com.
- [14] http://www.mesytec.com.
- [15] L. Jones, APV25-S1 - User Guide Version 2.2, 2001.
- [16] N. Raymond et al., The CMS Tracker APV25 0,25 m CMOS Readout Chip, Paper presented at the 6th workshop on electronics for LHC experiments, Krakow, Poland, 2000.
- [17] http://www.gsi.de.
- [18] M. Böhmer, Messung der Spallationsreaktion in inverser Kinematik, Dissertation, TU München, 2006.
- [19] R. Muenzer, SiViO - Ein Trigger fuer -Hyperonen, Diploma Thesis, 2008.
- [20] Maier-Leibniz-Laboratoriums, Homepage:, http://www.bl.physik.uni-muenchen.de/.
- [21] C. Plettner, Strangenesspoduktion bei kleinen transversalen Impulsen und mittleren Rapidit ten in der Reaktion 96Ru +96Ru @ 1.69A.GeV, Dissertation, Technische Universit t Dresden, 1999, 1999.
- [22] H. Wind, Nucl. Instr. Meth. 115 (1974).
- [23] any paper with fopi lambda reconstruction.
- [24] I. Froehlich et al., ACAT2007 76 (2007).
- [25] M. e. a. Abdel-Bary et al., Eur.Phys.J. A46, 27 (2010).
- [26] S. Bass et al., Prog. Part. Nucl. Phys. 41, 225 (1998).