11email: zhangqm@pmo.ac.cn 22institutetext: Key Lab of Modern Astronomy and Astrophysics, Ministry of Education, China
Chromospheric evaporation in sympathetic coronal bright points
Abstract
Context. Chromospheric evaporation is a key process in solar flares that has extensively been investigated using the spectroscopic observations. However, direct soft X-ray (SXR) imaging of the process is rare, especially in remote brightenings associated with the primary flares that have recently attracted dramatic attention.
Aims. We intend to find the evidence for chromospheric evaporation and figure out the cause of the process in sympathetic coronal bright points (CBPs), i.e., remote brightenings induced by the primary CBP.
Methods. We utilise the high-cadence and high-resolution SXR observations of CBPs from the X-ray Telescope (XRT) aboard the Hinode spacecraft on 2009 August 23.
Results. We discover thermal conduction front propagating from the primary CBP, i.e., BP1, to one of the sympathetic CBPs, i.e., BP2 that is 60 away from BP1. The apparent velocity of the thermal conduction is 138 km s-1. Afterwards, hot plasma flowed upwards into the loop connecting BP1 and BP2 at a speed of 76 km s-1, a clear signature of chromospheric evaporation. Similar upflow was also observed in the loop connecting BP1 and the other sympathetic CBP, i.e., BP3 that is 80 away from BP1, though less significant than BP2. The apparent velocity of the upflow is 47 km s-1. The thermal conduction front propagating from BP1 to BP3 was not well identified except for the jet-like motion also originating from BP1.
Conclusions. We propose that the gentle chromospheric evaporation in the sympathetic CBPs were caused by thermal conduction originating from the primary CBP.
Key Words.:
Sun: corona – Sun: activity – Sun: X-rays, gamma rays1 Introduction
Solar flares are transient energy release via magnetic reconnection accompanied by localized plasma heating and particle accelerations (Svestka sves76 (1976); Gan et al. gan91 (1991); Ding & Fang ding01 (2001); Ji et al. ji06 (2006, 2007, 2008); Guo et al. guo08 (2008); Fletcher et al. fle11 (2011); Ning & Cao ning11 (2011); Shibata & Magara shi11 (2011); Chen chen12 (2012); Hao et al. hao12 (2012)). According to the standard flare model, i.e., CSHKP model (Carmichael car64 (1964); Sturrock stu66 (1966); Hirayama hir74 (1974); Kopp & Pneuman kop76 (1976)), substantial nonthermal electrons (10–100 keV) propagate downwards along the reconnected magnetic field lines and collide with the dense chromosphere, creating impulsive hard X-ray (HXR) emissions and thermalizing the local plasma to 1–10 MK. Meanwhile, thermal conduction propagates downwards from the super-hot reconnection region. The overpressure of the chromosphere propels hot plasma into the tenuous coronal loops that emit strong emissions in soft X-ray (SXR), a process entitled “chromospheric evaporation” (Neupert neu68 (1968); Fisher et al. 1985a ; 1985b ; 1985c ; Emslie et al. ems92 (1992); Allred et al. all05 (2005)). Fisher et al. (1985b ) divided the chromospheric evaporation into two types according to the inputted energy flux. If the energy flux exceeds a critical value of 1010 erg cm-2 s-1, then explosive evaporation takes place accompanied by blue-shifts at speed of hundreds of km s-1 in the emission lines formed in the coronal temperature and red-shifts at speed of tens of km s-1 in the emission lines formed in the transition region and upper chromosphere (Brosius & Holman bro07 (2007)). Otherwise, gentle evaporation takes place accompanied by blue-shifts at speed of tens of km s-1 in all emission lines (Brosius & Phillips bro04 (2004); Brosius & Holman bro09 (2009); Berkebile-Stoiser et al. ber09 (2009)). Both nonthermal electrons and thermal conduction have been reported to play an important role in the gentle evaporation (Milligan et al. mill06 (2006); Milligan mill08 (2008)). Up to now, chromospheric evaporation have been observed by the space-borne spectroscopic imagers in extreme ultraviolet (EUV; Chen & Ding chen10 (2010); Li & Ding li11 (2011)) and HXR (Liu et al. liu06 (2006); Ning et al. ning09 (2009)) wavebands. In SXR, however, the process has seldom been reported due to the low spatial resolution, time cadence, and temperature sensitivity of the previous telescopes (Silva et al. sil97 (1997)). Thanks to the state-of-the-art X-ray Telescope (XRT; Golub et al. golub07 (2007)) aboard Hinode (Kosugi et al. kos07 (2007)), it becomes possible to seek for direct evidence of chromospheric evaporation. Nitta et al. (nit12 (2012)) for the first time observed clear chromospheric evaporation upflows arising almost symmetrically from the footpoints of magnetic loops. Among the 13 small transient brightenings observed by Hinode/XRT, nearly 46% had an average apparent velocity of 100 km s-1, and the other 23% were much faster. Nevertheless, magnetic reconnections that lead to the evaporation were not recognized in their limited sample, and the cause of evaporation (thermal conduction or nonthermal electrons) was not clarified. Milligan (mill08 (2008)) showed apparent flow of hot material along the GOES B-class flare loop. The absence of detectable HXR emission coupled with lower upflow velocities suggests gentle chromospheric evaporation driven by thermal conduction.
Due to the complexities and interconnections of magnetic fields in the solar atmosphere, flares may not occur independently. Occasionally, a flare in the primary region may induce another one in a remote region, which is called “sympathetic flare” (Richardson rich51 (1951)). The mechanism of energy transport between the two regions has extensively been investigated. It was proposed that the possible driving agents could be energetic particles, shock waves, and thermal conduction (Machado et al. mach88 (1988)). For example, Zhang et al. (zhang00 (2000)) studied both the magnetic topology and time delay between the initial and sympathetic flares, finding that heat conduction is responsible for the sympathetic flare. For flares associated with coronal mass ejections (CMEs), the erupting flux rope and its envelope magnetic field may reconnect with the overlying field lines, producing a bright ribbon (or sympathetic flare) in a remote site (Wang wang05 (2005)). Interestingly, Brosius & Holman (bro07 (2007)) discovered explosive chromospheric evaporation in a remote solar flare-like transient. Wang & Liu (wang12 (2012)) found remote brightenings at a region far from the circular-ribbon flares. Deng et al. (deng13 (2013)) also discovered a circular-ribbon flare with a remote brightening that is predicted in three-dimensional fan-spine reconnection.
Coronal bright points (CBPs) are long-lived (8 hr) small-scale (10–40) brightenings in the lower corona (Golub et al. golub77 (1977); Priest et al. pri94 (1994); Tian et al. tian08 (2008)). Like big flares, they are also believed to be heated by magnetic reconnection. Sometimes, recurrent strong flashes appear in CBPs with significant brightness enhancement (Zhang et al. zqm12 (2012)). If a CBP flash occurs at the footpoint of a large-scale magnetic loop, chances are that another transient brightening, i.e., CBP, will be induced at the remote site of the large-scale loop due to the energy flux transported by nonthermal electrons or thermal conduction along the loop, which is termed “sympathetic CBP”. Such events and the associated chromospheric evaporation, to our knowledge, have not been investigated yet. In this letter, we report our detection of chromospheric evaporation in sympathetic CBPs observed by Hinode/XRT. In Section 2, we describe the data analysis and show the results. Discussion and conclusion are presented in Section 3.
2 Data analysis and results
XRT has 9 filters to achieve a wide temperature coverage from 0.3 MK to 30 MK. During 2009 August 22–23, it pointed to a high-latitude region close to the north polar coronal hole using the C_poly filter that has maximum temperature response at . The partial-frame (384) observations lasted for more than 10 hr from 15:00 UT on August 22 to 01:30 UT on August 23 with time cadence of 32 s and spatial resolution of 206. During the observations, a bright point in the field-of-view experienced several strong flashes, the last of which occurred around 01:00 UT on August 23 and triggered another two bright points.
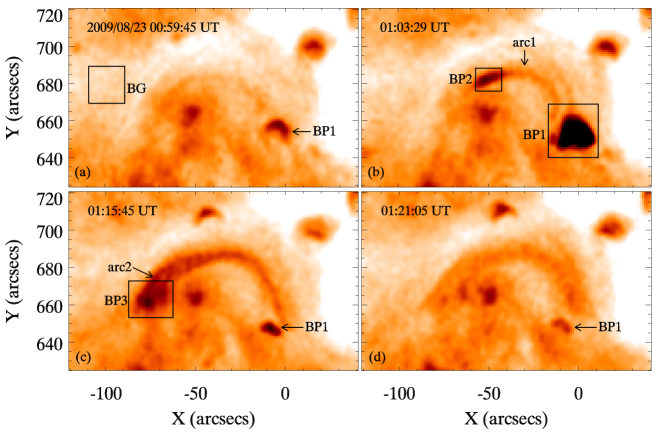
Figure 1 demonstrates four snapshots of the SXR images that represent the four stages of the evolution of the CBPs, respectively. Note that the color is reversed so that the dark regions in the panels stand for bright features in the corona. In Fig. 1a, the main bright point, i.e., BP1, exists as a tiny bright loop. The distance of the footpoints of the loop is about 15. It started to increase slowly in size and brightness from 00:56 UT on August 23. The quiescent square region, i.e., BG, within the box is the background with slight intensity fluctuation. The size and intensity of BP1 increased rapidly from 01:00 UT and reached maximum at 01:06 UT, showing a strong flash in SXR that resembles a microflare (Fig. 1b). Meanwhile, the brightening propagated from BP1 to a remote northeast region that is 60 away, producing another bright point BP2 that is 15 long and much fainter than BP1. The faint loop connecting BP1 and BP2 is labeled with arc1, whose length is estimated to be 94 assuming a semi-circular shape. Parallel to arc1, there is another arc that also takes root in BP1. Jet-like motion along the arc is observed. Before BP1 faded away, the third bright point, i.e., BP3, appeared and brightened 80 east to BP1 (Fig. 1c). It is 20 in size and is more diffused compared to BP1. Interestingly, BP3 is not an isolated one, but is probably connected to BP1 by arc2 in the panel. We speculate that the arc parallel to arc1 is the right segment of arc2. After the transient brightenings lasting for 30 min, the three bright points and two arcs gradually disappeared in the SXR images (Fig. 1d).

Figure 2 displays the light curves of BP1 (solid line), BP2 (dotted line), and BP3 (dashed line) where and denote the total intensities of the CBPs and background region. Therefore, signifies background-normalized intensity. Since BP2 and BP3 are weaker than BP1, we multiply the values of by 6 and 2 for BP2 and BP3 to get a clearer comparison. It is revealed that the intensity of BP1 increases gradually from 00:56 UT to 01:00 UT before a sharp rise until the maximum at 01:06 UT. Then, it declines rapidly to the value before the onset of flash. The intensity of BP3 starts to grow at 01:03 UT and reaches the apex at 01:15 UT before recovering to a low level at 01:25 UT. The maximum of BP3 is delayed by 9 min compared to BP1. The intensity of BP2 begins to rise gently at 01:00 UT and peaks at 01:04 UT before declining to a lower level. The seemingly second peak at 01:14 UT is due to the brightening of arc2 that lies in front of BP2. Afterwards, it decays slowly until 01:25 UT.
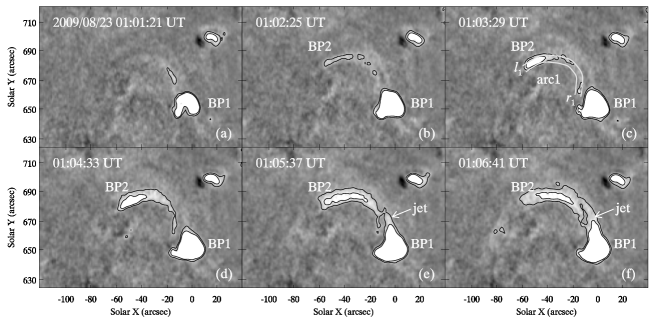
Albeit small compared to the flaring arcades (McKenzie & Hudson mck99 (1999)), we discovered the signature of chromospheric evaporation along the arcs, i.e., arc1 and arc2. To show the evaporation more obviously, we take the first image at 00:45:20 UT on August 23 as the base image before performing base-difference for the rest ones. Figure 3 displays 6 snapshots of the base-difference images where white/black color means intensity enhancement/depress. The black contours correspond to intensities of 25 and 50 DN s-1. In Fig. 3c, a pair of white parallel curves connecting and outline arc1. It is seen from the upper panels that the brightening propagates from to along the arc. The brightening does not stop abidingly at , i.e., BP2. On the contrary, it propagates backwards after the brightness of BP2 reaches maximum at 01:04 UT, which is illustrated in the lower panels of Fig. 3.
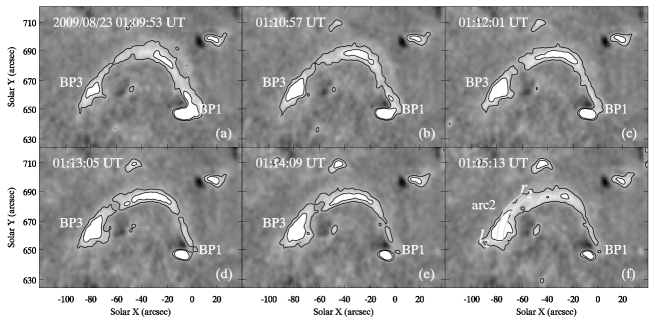
Similar to Fig. 3, we demonstrate 6 snapshots of the base-difference images in Fig. 4. Likewise, we outline arc2 with a pair of white parallel curves connecting and in Fig. 4f. It is seen that as BP3 increases in size and brightness, the brightening propagates from to along arc2 during 01:10 UT – 01:15 UT, a clear signature of chromospheric evaporation.
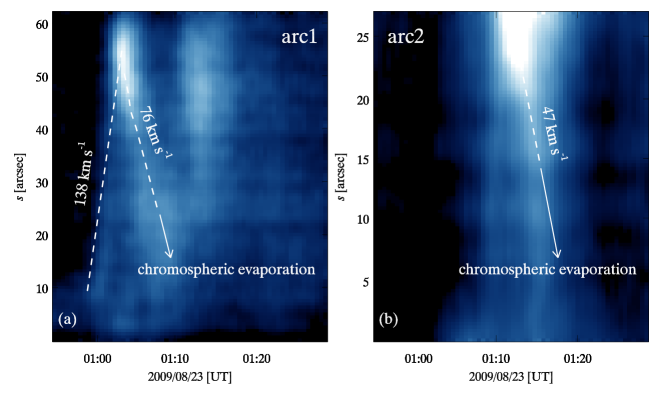
To calculate the apparent velocities of the propagations of the brightenings along the arcs, we derive the temporal evolutions of SXR intensity of the arcs marked in Fig. 3c and Fig. 4f using the standard program plot_arc.pro in the Solar Software. The time-slice diagrams are presented in Fig. 5, where denotes the distances from the right endpoints of the arcs. In the left panel, it seems that the brightening propagates from near the right endpoint during 00:58 UT – 01:03 UT, which is outlined by the white dashed line. The intensity contrast between this feature and the background levels elsewhere is quite low. The slope of the dashed line provides a rough estimation of the apparent velocity of the propagation, i.e., 138 km s-1. Afterwards, the brightening propagates reversely during 01:03 UT – 01:07 UT. As we have mentioned before, it is an indication of chromospheric evaporation demonstrated in the lower panels of Fig. 3. The apparent velocity is estimated to be 76 km s-1. In the right panel, the evaporation occurs during 01:10 UT – 01:15 UT at a speed of 47 km s-1.
3 Discussion and conclusion
As for the mechanism of energy transport from the main flare/CBP to sympathetic flare/CBP, several agents have been proposed in previous works. The most popular one is nonthermal electrons accelerated in the main flares and guided by the large-scale coronal loops connecting the primary and remote regions (Tang & Moore tang82 (1982); Nakajima et al. naka85 (1985); Martin & Svestka mart88 (1988)). The electrons produce chromospheric evaporation after penetrating into the dense chromosphere of the remote region. Another candidate of energy transport is thermal conduction at a speed of hundreds of km s-1 due to the super-hot plasma created by the primary flares (Rust et al. rust85 (1985); Bastian & Gary bast92 (1992)). The third one is hot jets guided by the coronal loops as a result of interaction between small emerging loops and large preexisting loops (Hanaoka hana96 (1996, 1997); Nishio et al. nis97 (1997)).
In our case study of sympathetic CBPs, we found tentative evidence of propagation of brightening from BP1 to BP2 at a speed of 138 km s-1 that is far less than the typical velocity of energetic electrons but in the same order of magnitude as thermal conduction speed (Campbell cam84 (1984); Mandrini et al. man96 (1996)). Therefore, we postulate that BP2 is heated by thermal conduction. For BP3, it is seen from Fig. 2 that the onset time of BP3 lags behind that of BP1 by 4 min, and the peak time of BP3 intensity is delayed by 9 min. However, definite propagation of brightening from BP1 to BP3 is not well observed except the jet-like motion guided by the arc parallel to arc1 prior to the onset of evaporation from BP3, as shown in Fig. 3e and Fig. 3f. If BP3 is heated by thermal conduction, the velocity is estimated to be 380 km s-1.
Although chromospheric evaporation have been extensively observed and investigated, direct evidence of the dynamic process is rare in SXR. Nitta (nit12 (2012)) recently reported the detection of chromospheric evaporation upflows in transient brightening events. The apparent velocities are up to hundreds of km s-1. In our case, the velocities are 76 km s-1 and 47 km s-1 for BP2 and BP3, respectively. Considering the velocities of evaporation in the sympathetic CBPs, we conclude that they belong to the gentle type. Milligan (mill08 (2008)) studied a B-class flare. There was no detectable HXR emission in the flare ribbons, and the blueshift was very weak (14 km s-1). Considering the apparent flow of hot material along the flare loop, the author tentatively proposed that it was signature of gentle evaporation caused by thermal conduction. We observed apparent evaporation flows of hot plasma along arc1 and arc2 that connect BP1 with BP2 and BP3, respectively. We also present tentative evidence of thermal conduction front.
In this letter, we report our first discovery of sympathetic CBPs and the chromospheric evaporation observed by Hinode/XRT on 2009 August 23. A strong flash occurred in the primary CBP, i.e., BP1, triggering the appearance of two adjacent CBPs, i.e., BP2 and BP3 that are 60 and 80 away from BP1, respectively. The peak time of BP2 intensity coincides roughly with that of BP1, but the peak time of BP3 intensity was delayed by 9 min compared to BP1. The SXR brightening propagates from BP1 to BP2 along arc1 at a speed of 138 km s-1 followed by chromospheric evaporation in BP2 at a speed of 76 km s-1. The propagation of brightening from BP1 to BP3 was not well identified except the jet-like motion along the arc parallel to arc1. Nevertheless, we found chromospheric evaporation at a speed of 47 km s-1 in BP3. We propose that the gentle evaporation in BP2 and BP3 were generated by thermal conduction. Additional case studies using high-cadence and high-resolution multi-wavelength observations are expected in the future. Numerical modelling would be helpful in trying to reproduce the observed upflows in response to a thermal conduction front.
Acknowledgements.
The authors are grateful to the referee for enlightening comments and suggestions to improve the quality of our work. Q. M. Zhang appreciates P. F. Chen, C. Fang, M. D. Ding, H. Peter, J. X. Wang, W. Q. Gan, Y. P. Li, S. M. Liu, L. Feng, H. Li, and Z. J. Ning for valuable discussions and suggestions. Hinode is a Japanese mission developed and launched by ISAS/JAXA, with NAOJ as domestic partner and NASA and STFC (UK) as international partners. The research is supported by the Chinese foundations NSFC (11025314, 10878002, 10933003, and 11173062) and 2011CB811402.References
- (1) Allred, J. C., Hawley, S. L., Abbett, W. P., & Carlsson, M. 2005, ApJ, 630, 573
- (2) Bastian, T. S., & Gary, D. E. 1992, Sol. Phys., 139, 357
- (3) Berkebile-Stoiser, S., Gömöry, P., Veronig, A. M., Rybák, J., Sütterlin, P. 2009, A&A, 505, 811
- (4) Brosius, J. W., & Holman, G. D. 2007, ApJ, 659, L73
- (5) Brosius, J. W., & Holman, G. D. 2009, ApJ, 692, 492
- (6) Brosius, J. W., & Phillips, K. J. H. 2004, ApJ, 613, 580
- (7) Campbell, P. M. 1984, Phys. Rev. A, 30, 365
- (8) Carmichael, H. 1964, NASA Special Publication, 50, 451
- (9) Chen, P. F. 2012, Hinode-3: The 3rd Hinode Science Meeting, 454, 265
- (10) Chen, F., & Ding, M. D. 2010, ApJ, 724, 640
- (11) Deng, N., Tritschler, A., Jing, J., et al. 2013, ApJ, 769, 112
- (12) Ding, M. D., & Fang, C. 2001, MNRAS, 326, 943
- (13) Emslie, A. G., Li, P., & Mariska, J. T. 1992, ApJ, 399, 714
- (14) Fisher, G. H., Canfield, R. C., & McClymont, A. N. 1985, ApJ, 289, 414
- (15) Fisher, G. H., Canfield, R. C., & McClymont, A. N. 1985, ApJ, 289, 425
- (16) Fisher, G. H., Canfield, R. C., & McClymont, A. N. 1985, ApJ, 289, 434
- (17) Fletcher, L., Dennis, B. R., Hudson, H. S., et al. 2011, Space Sci. Rev., 159, 19
- (18) Gan, W. Q., Zhang, H. Q., & Fang, C. 1991, A&A, 241, 618
- (19) Golub, L., et al. 2007, Sol. Phys., 243, 63
- (20) Golub, L., Krieger, A. S., Harvey, J. W., & Vaiana, G. S. 1977, Sol. Phys., 53, 111
- (21) Guo, Y., Ding, M. D., Wiegelmann, T., & Li, H. 2008, ApJ, 679, 1629
- (22) Hanaoka, Y. 1996, Sol. Phys., 165, 275
- (23) Hanaoka, Y. 1997, Sol. Phys., 173, 319
- (24) Hao, Q., Guo, Y., Dai, Y., et al. 2012, A&A, 544, L17
- (25) Hirayama, T. 1974, Sol. Phys., 34, 323
- (26) Ji, H., Huang, G., Wang, H., et al. 2006, ApJ, 636, L173
- (27) Ji, H., Huang, G., & Wang, H. 2007, ApJ, 660, 893
- (28) Ji, H., Wang, H., Liu, C., & Dennis, B. R. 2008, ApJ, 680, 734
- (29) Kopp, R. A., & Pneuman, G. W. 1976, Sol. Phys., 50, 85
- (30) Kosugi, T., et al. 2007, Sol. Phys., 243,3
- (31) Li, Y., & Ding, M. D. 2011, ApJ, 727, 98
- (32) Liu, W., Liu, S., Jiang, Y. W., & Petrosian, V. 2006, ApJ, 649, 1124
- (33) Machado, M. E., Xiao, Y. C., Wu, S. T., Prokakis, T., & Dialetis, D. 1988, ApJ, 326, 451
- (34) Mandrini, C. H., Démoulin, P., van Driel-Gesztelyi, L., et al. 1996, Sol. Phys., 168, 115
- (35) Martin, S. F., & Svestka, Z. F. 1988, Sol. Phys., 116, 91
- (36) McKenzie, D. E., & Hudson, H. S. 1999, ApJ, 519, L93
- (37) Milligan, R. O. 2008, ApJ, 680, L157
- (38) Milligan, R. O., Gallagher, P. T., Mathioudakis, M., & Keenan, F. P. 2006, ApJ, 642, L169
- (39) Nakajima, H., Dennis, B. R., Hoyng, P., et al. 1985, ApJ, 288, 806
- (40) Neupert, W. M. 1968, ApJ, 153, L59
- (41) Ning, Z., & Cao, W. 2011, Sol. Phys., 269, 283
- (42) Ning, Z., Cao, W., Huang, J., et al. 2009, ApJ, 699, 15
- (43) Nishio, M., Yaji, K., Kosugi, T., Nakajima, H., & Sakurai, T. 1997, ApJ, 489, 976
- (44) Nitta, S., Imada, S., & Yamamoto, T. T. 2012, Sol. Phys., 276, 183
- (45) Priest, E. R., Parnell, C. E., & Martin, S. F. 1994, ApJ, 427, 459
- (46) Richardson, R. S. 1951, ApJ, 114, 356
- (47) Rust, D. M., Simnett, G. M., & Smith, D. F. 1985, ApJ, 288, 401
- (48) Shibata, K., & Magara, T. 2011, Living Reviews in Solar Physics, 8, 6
- (49) Silva, A. V. R., Wang, H., Gary, D. E., Nitta, N., & Zirin, H. 1997, ApJ, 481, 978
- (50) Sturrock, P. A. 1966, Nature, 211, 695
- (51) Svestka, Z. 1976, Solar Flares. Svestka, Z., pp. 415. ISBN 90-277-0662-X. Springer-Verlag Berlin Heidelberg 1976
- (52) Tang, F., & Moore, R. L. 1982, Sol. Phys., 77, 263
- (53) Tian, H., Xia, L.-D., & Li, S. 2008, A&A, 489, 741
- (54) Wang, H. 2005, ApJ, 618, 1012
- (55) Wang, H., & Liu, C. 2012, ApJ, 760, 101
- (56) Zhang, C., Wang, H., Wang, J., & Yan, Y. 2000, Sol. Phys., 195, 135
- (57) Zhang, Q. M., Chen, P. F., Guo, Y., Fang, C., & Ding, M. D. 2012, ApJ, 746, 19