Distinction of Nuclear Spin States with the Scanning Tunneling Microscope
Abstract
We demonstrate rotational excitation spectroscopy with the scanning tunneling microscope for physisorbed H2 and its isotopes HD and D2. The observed excitation energies are very close to the gas phase values and show the expected scaling with moment of inertia. Since these energies are characteristic for the molecular nuclear spin states we are able to identify the para and ortho species of hydrogen and deuterium, respectively. We thereby demonstrate nuclear spin sensitivity with unprecedented spatial resolution.
pacs:
67.63.Cd, 67.80.ff, 67.80.F-, 33.20.Sn, 21.10.Hw, 68.43.-h, 68.37.EfInelastic electron tunneling spectroscopy (IETS) probes the energies of atomic and molecular excitations in a tunnel junction. When the electron energy reaches the excitation threshold, a new conductance channel opens, leading to a step in the differential conductance . IETS measurements were first carried out in planar tunnel junctions probing vibrations Lambe and Jaklevic (1968) and magnetic excitations Wolf (1989) of large ensembles of molecules or atoms. A major breakthrough was achieved when performing IETS with the scanning tunneling microscope (STM). This has first been demonstrated for molecular vibrations Stipe et al. (1998a), identifying the molecules and their isotopes Lauhon and Ho (1999). A few years later, this was followed by spin-excitations, revealing the Landé -factor, effective spin moment, and magnetic anisotropy energy Heinrich et al. (2004); Hirjibehedin et al. (2007). In either case, this information is retrieved for individual atoms and molecules of well known adsorption site, coordination-number, and -chemistry. These studies have significantly improved our understanding of surface chemistry and magnetism.
The only process that could so far not be characterized by IETS, neither in planar junctions nor in STM, are true molecular rotations. Albeit, their excitation energies contain manifold information, e.g., on chemical identity, bond lengths, rotational degrees of freedom, and molecular conformations. Notably, for homonuclear diatomics, the allowed rotational transitions depend on the nuclear spin state.
Here we demonstrate rotational excitation spectroscopy (RES) with the STM for physisorbed hydrogen, deuterium, and deuterium-hydride. We observe sharp conductance steps in at the energies corresponding to the allowed rotational transitions of the respective molecules in the gas phase. The ortho and para nuclear spin isomers of hydrogen and deuterium entail different rotational ground states Silvera (1980). We identify their distinct excitation energies and thus demonstrate nuclear spin sensitivity on ensembles containing by many orders of magnitudes less molecules than probed in neutron diffraction Nielsen et al. (1977); Frank et al. (1988), nuclear magnetic resonance Kubik et al. (1985); Kim and Sullivan (1997), and high-resolution electron energy loss spectroscopy (HREELS) Andersson and Harris (1982); Avouris et al. (1982); Palmer and Willis (1987). The mechanism at the origin of STM-RES is proposed to involve a resonant molecular ensemble state. In order to prevent its screening by the metal substrate, we introduced a monolayer of hexagonal boron nitride (-BN) or graphene Natterer et al. .
We focus here on molecules that were physisorbed on -BN/Ni(111)– grown by chemical vapor deposition using borazine precursors Nagashima et al. (1995). The H2, D2, or HD molecules were subsequently dosed onto the surface at 10 K and the STM measurements were performed at 4.7 K. The spectra were measured with a Lock-In amplifier using a bias modulation of 2 mV peak-to-peak at 397 Hz.
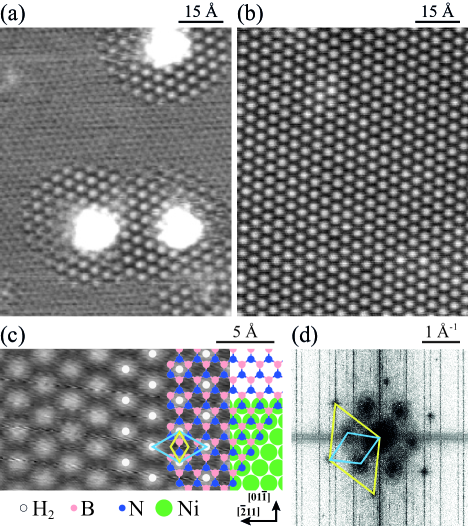
At low coverages, physisorbed hydrogen forms a two dimensional gas Nielsen et al. (1977) that is transparent to the STM allowing the imaging of the underlying -BN with atomic resolution as shown in Fig. 1. The honeycomb lattice appears as hexagonally close-packed depressions. We adsorbed individual Ti atoms Natterer et al. (2013) in order to condense part of the H2 gas in circular islands centered around the adatoms. The H2 molecules are imaged as protrusions. They are in registry with the -BN depressions, however, at times their distance and rotated by 30∘. Upon saturation coverage, H2 forms a perfectly ordered monolayer of this (R superstructure, see Fig. 1 (b). Many weakly physisorbed adsorbates adopt this structure, notably hydrogen on graphite Nielsen et al. (1977); Seguin and Suzanne (1982); Kubik et al. (1985) and on boron nitride Kim and Sullivan (1997).
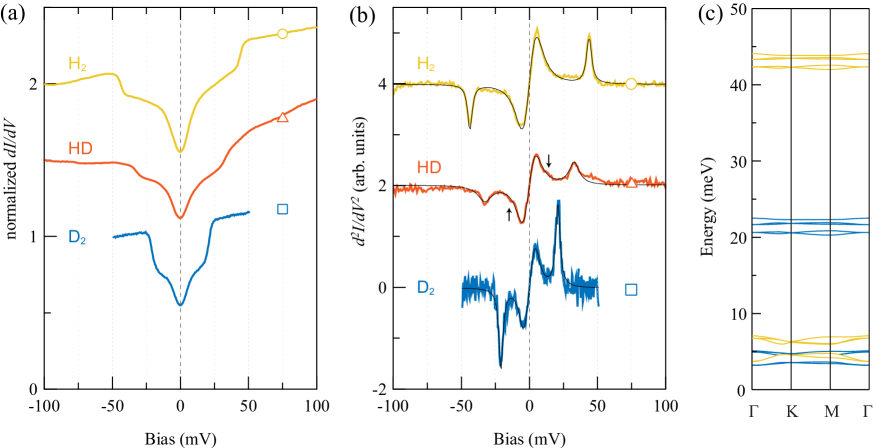
The spectra on the full monolayers of H2, D2, and HD are shown in Fig. 2 (a). Each curve reveals two pairs of conductance steps. Their threshold energies are symmetric around zero bias, as expected for IETS. The numerical derivatives in Fig. 2 (b) are used to determine their values. We focus first on the high energy excitations that are located at , , and meV, for H2, HD, and D2, respectively. Their ratios unambiguously identify them as rotational transitions since the energy of a rotational quantum state of a linear molecule is with inversely proportional to its moment of inertia . In addition, the absolute excitation energies of all three molecules match the reported gas-phase values (cp. Table 1). Most importantly, the spectra identify H2 in its para and D2 in its ortho nuclear spin configuration.
| Molecule | (meV) | STM-RES (meV) | ||||
|---|---|---|---|---|---|---|
| H2 | para | 0 | 0 | 43.9 | ||
| ortho | 1 | 1 | 72.8 | not observed | ||
| HD | 0 | 11.1 | 32.9 | and | ||
| D2 | ortho | 0/2 | 0 | 22.2 | ||
| para | 1 | 1 | 36.9 | not observed | ||
The distinct rotational excitation energies of the disparate nuclear spin states are caused by symmetry constraints of the total molecular wavefunction Silvera (1980). It is a product of the nuclear, rotational, electronic, and vibrational wavefunctions. Hydrogen nucleons are fermions, therefore this product must be antisymmetric with respect to proton permutation. For hydrogen, the vibrational and the electronic () ground states are symmetric. Consequently, the antisymmetric nuclear singlet state (, para) requires a symmetric rotational wavefunction (even ), whereas the symmetric nuclear triplet state (, ortho) implies an antisymmetric rotational wavefunction (odd ). The nucleons of deuterium are bosons requiring a symmetric molecular wavefunction. Hence, the symmetric nuclear spin state is associated with a symmetric rotational state and the antisymmetric nuclear spin configuration with an antisymmetric rotational state. Transitions between the nuclear spin isomers are forbidden for free molecules, but are catalyzed by paramagnetic impurities or inhomogeneous magnetic and electric fields Ilisca (1992); Sugimoto and Fukutani (2011).
For the case of HD, the nucleons are distinguishable and the above symmetry constraints do not apply. The observed threshold energy for HD is in agreement with a excitation (Fig. 2). For this molecule, also transitions are allowed, and the spectrum indeed shows a little shoulder at meV close to the reported transition energy (Table 1). Note that the RES steps are with 11 – 37 % fit significantly higher than the ones of vibrational-excitations for adsorbates on metals Stipe et al. (1998a), and they are comparable with the spin-excitation step heights observed for magnetic atoms on a decoupling monolayer Heinrich et al. (2004); Hirjibehedin et al. (2007).
We attribute the low-energy conductance steps in Fig. 2 to the excitation of phonons in the molecular layers. As can be seen from Fig. 2 (c), the substrate potential creates a phonon gap at the Brillouin zone center reaching from zero to the energy where the weakly dispersing bands are located Frank et al. (1988); Novaco (1988); Lauter et al. (1989); Janssen et al. (1991). This creates a narrow energy interval in which phonons can be excited and thus meets the necessary condition for the observation of a distinct threshold energy in IETS. The excitations are with , , and meV, for H2, HD, and D2, remarkably close to the centers of the measured phonon bands Frank et al. (1988); Lauter et al. (1989). Notably, the H2/D2 energy ratio of 1.3 matches the one of the phonon gaps. The deviation from is caused by the anharmonicity of the intermolecular and of the adsorption potential Frank et al. (1988); Novaco (1988); Janssen et al. (1991); Mattera et al. (1980).
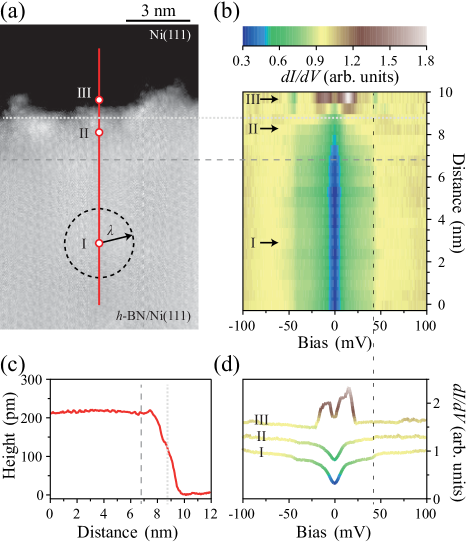
We determined in Fig. 3 the lateral range of excited molecules probed with STM-RES by recording spectra on samples with partial -BN coverage. This gives access to physisorbed H2, once in the phase on -BN, for which we observe RES features, and once directly adsorbed on Ni(111), where rotational excitation conductance steps are absent, in agreement with former low- STM studies Gupta et al. (2005); Temirov et al. (2008); Sicot et al. (2008); Weiss et al. (2010). The spectra recorded across the transition between these two surface terminations reveal the attenuation of the rotational excitation when approaching the -BN border to a distance of nm. Within this radius there are hydrogen molecules. This represents the ensemble size probed for the present system by STM-RES.
The mechanism underlying STM-RES has to be different from the one of HREELS, since the latter detected rotational excitations for physisorbed hydrogen on metal surfaces Andersson and Harris (1982); Avouris et al. (1982), while in STM there were no signs of such excitations for the same systems Gupta et al. (2005); Temirov et al. (2008); Sicot et al. (2008); Weiss et al. (2010). Instead, all observed spectroscopic features were reminiscent of two state switching Gupta et al. (2005). In EELS, a negative ion resonance is populated by the primary electrons and subsequently decays into several inelastic channels, one of them being the molecular rotation Schulz (1973); Palmer and Rous (1992). For hydrogen this resonance is at an energy accessible to the typical 5 eV incident electrons Schulz (1973); Andersson and Harris (1982); Avouris et al. (1982); Teillet-Billy and Gauyacq (2002), but evidently not to IETS operating at electron energies near the excitation threshold of the molecular rotations. However, the existence of a rotational resonance for ultra-low electron energies was demonstrated by molecular density dependent electron drift velocity measurements Frommhold (1968); Crompton and Robertson (1971). It has been attributed to a collective resonance state originating from the electrostatic, polarization, and quadrupole interactions between neighboring hydrogen molecules Garrett (1977). This state requires molecular densities of comparable order of magnitude than in the present work ( cm-2). Similar densities were also present in former STM studies Gupta et al. (2005); Temirov et al. (2008); Sicot et al. (2008); Weiss et al. (2010) and the absence of RES features, that we also note in Fig. 3 for H2/Ni(111), must be due to screening of the intermolecular interactions by the underlying substrate. Therefore a decoupling -BN layer enables the spectroscopy of molecular rotations with STM-IETS and the collective nature of the resonant state explains the finite lateral range of excited molecules. According to this mechanism, STM-RES is an intrinsically multi-molecule method, requiring for the case of H2 at least 60 interacting molecules. Our collective rotational excitations can be interpreted in terms of the calculated roton bands Janssen et al. (1991) shown in Fig. 2 (c). We note that 60 molecules is an unprecedented small number in terms of the demonstrated access to the nuclear spin state.
With para-H2 and ortho-D2 we observe for each molecule only the nuclear spin isomer with lowest energy rotational ground state, . However, for either molecule both nuclear spin isomers are present in the gas phase, with ortho/para ratios of for H2 and for D2 at room temperature. Therefore a fast conversion to the lowest energy nuclear spin configuration must take place on the surface. In line, former EELS studies either observed only the spin isomer with even Palmer and Willis (1987), as in our case, or they reported the ortho to para-H2 conversion after a few minutes Avouris et al. (1982). This conversion has been attributed to short range magnetic interactions with the surface Ilisca (1992). We never observed ortho-H2 and para-D2, neither on -BN nor on graphene, both grown on non-magnetic substrates Natterer et al. . Therefore the conversion to the lowest energy configuration must be driven by magnetic impurities. The electric fields of the tunnel junction are by at least one order of magnitude smaller than required Sugimoto and Fukutani (2011).
There is pioneering STM work related to molecular rotations. STM was used to induce and monitor the rotation of O2/Pt(111) Stipe et al. (1998b), the coupling of vibrational and rotational degrees of freedom was demonstrated for acetylene/Cu(100) Stipe et al. (1998c), and hindered rotations were reported for CO on two low-index Cu surfaces Lauhon and Ho (1999). However, here we reveal for the first time the molecular rotational eigenvalues and thereby complete the meanwhile well established and widely used STM-IETS vibrational and spin-excitation spectroscopy.
We demonstrated for H2 and D2 nuclear spin sensitivity and proposed a mechanism involving a collective low-energy resonant state that emerges from molecular interactions. STM-RES gives access to the eigenvalues of any molecular rotor; particularly well suited are molecules with large rotational constants . For homonuclear diatomics, such as N2 and O2, the nuclear spin states can now be inspected with unprecedented spatial resolution, as well as the intriguing ordering phenomena of ortho–para mixtures Kubik et al. (1985); Kim and Sullivan (1997). Furthermore, the coupling of the nuclear spin to the atomic environment and potentially also nuclear processes become accessible on a local scale. We finally note that even single molecule STM-RES might be feasible for those molecules with very low and broad negative ion resonance energy, thereby creating the necessary overlap with the rotational excitation threshold.
Funding from the Swiss National Science Foundation is greatly appreciated.
References
- Lambe and Jaklevic (1968) J. Lambe and R. C. Jaklevic, Phys. Rev. 165, 821 (1968).
- Wolf (1989) E. L. Wolf, Principles of Electron Tunneling Spectroscopy (Oxford University Press, New York, 1989).
- Stipe et al. (1998a) B. C. Stipe, M. A. Rezaei, and W. Ho, Science 280, 1732 (1998a).
- Lauhon and Ho (1999) L. J. Lauhon and W. Ho, Phys. Rev. B 60, R8525 (1999).
- Heinrich et al. (2004) A. J. Heinrich, J. A. Gupta, C. P. Lutz, and D. M. Eigler, Science 306, 466 (2004).
- Hirjibehedin et al. (2007) C. F. Hirjibehedin, C.-Y. Lin, A. F. Otte, M. Ternes, C. P. Lutz, B. A. Jones, and A. J. Heinrich, Science 317, 1199 (2007).
- Silvera (1980) I. F. Silvera, Rev. Mod. Phys. 52, 393 (1980).
- Nielsen et al. (1977) M. Nielsen, J. P. McTague, and W. Ellenson, J. Phys. Colloques 38, C4 (1977).
- Frank et al. (1988) V. L. P. Frank, H. J. Lauter, and P. Leiderer, Phys. Rev. Lett. 61, 436 (1988).
- Kubik et al. (1985) P. R. Kubik, W. N. Hardy, and H. Glattli, Can. J. Phys. 63, 605 (1985).
- Kim and Sullivan (1997) K. Kim and N. S. Sullivan, Phys. Rev. B 55, R664 (1997).
- Andersson and Harris (1982) S. Andersson and J. Harris, Phys. Rev. Lett. 48, 545 (1982).
- Avouris et al. (1982) P. Avouris, D. Schmeisser, and J. E. Demuth, Phys. Rev. Lett. 48, 199 (1982).
- Palmer and Willis (1987) R. Palmer and R. Willis, Surf. Sci. 179, L1 (1987).
- (15) F. D. Natterer, F. Patthey, and H. Brune, in preparation .
- Nagashima et al. (1995) A. Nagashima, N. Tejima, Y. Gamou, T. Kawai, and C. Oshima, Phys. Rev. B 51, 4606 (1995).
- Natterer et al. (2013) F. D. Natterer, F. Patthey, and H. Brune, Surf. Sci. 615, 80 (2013).
- Seguin and Suzanne (1982) J. Seguin and J. Suzanne, Surf. Sci. Lett. 118, L241 (1982).
- (19) Please consult the Supporting Material.
- Janssen et al. (1991) W. B. J. M. Janssen, T. H. M. van den Berg, and A. van der Avoird, Phys. Rev. B 43, 5329 (1991).
- Ilisca (1992) E. Ilisca, Prog. Surf. Sci. 41, 217 (1992).
- Sugimoto and Fukutani (2011) T. Sugimoto and K. Fukutani, Nat. Phys. 7, 307 (2011).
- Novaco (1988) A. D. Novaco, Phys. Rev. Lett. 60, 2058 (1988).
- Lauter et al. (1989) H. Lauter, V. Frank, P. Leiderer, and H. Wiechert, Physica B 156, 280 (1989).
- Mattera et al. (1980) L. Mattera, F. Rosatelli, C. Salvo, F. Tommasini, U. Valbusa, and G. Vidali, Surf. Sci. 93, 515 (1980).
- Gupta et al. (2005) J. A. Gupta, C. P. Lutz, A. J. Heinrich, and D. M. Eigler, Phys. Rev. B 71, 115416 (2005).
- Temirov et al. (2008) R. Temirov, S. Soubatch, O. Neucheva, A. C. Lassise, and F. S. Tautz, New J. Phys. 10, 053012 (2008).
- Sicot et al. (2008) M. Sicot, O. Kurnosikov, H. Swagten, and B. Koopmans, Surf. Sci. 602, 3667 (2008).
- Weiss et al. (2010) C. Weiss, C. Wagner, C. Kleimann, M. Rohlfing, F. S. Tautz, and R. Temirov, Phys. Rev. Lett. 105, 086103 (2010).
- Schulz (1973) G. J. Schulz, Rev. Mod. Phys. 45, 423 (1973).
- Palmer and Rous (1992) R. E. Palmer and P. J. Rous, Rev. Mod. Phys. 64, 383 (1992).
- Teillet-Billy and Gauyacq (2002) D. Teillet-Billy and J. Gauyacq, Surf. Sci. 502, 358 (2002).
- Frommhold (1968) L. Frommhold, Phys. Rev. 172, 118 (1968).
- Crompton and Robertson (1971) R. W. Crompton and A. G. Robertson, Aust. J. Phys. 24, 543 (1971).
- Garrett (1977) W. R. Garrett, Phys. Rev. A 16, 2305 (1977).
- Stipe et al. (1998b) B. C. Stipe, M. A. Rezaei, and W. Ho, Science 279, 1907 (1998b).
- Stipe et al. (1998c) B. C. Stipe, M. A. Rezaei, and W. Ho, Phys. Rev. Lett. 81, 1263 (1998c).