Formation, orbital and thermal evolution, and survival of planetary-mass clumps in the early phase of circumstellar disk evolution
Abstract
We report the results of our three-dimensional radiation hydrodynamics simulation of collapsing unmagnetized molecular cloud cores. We investigate the formation and evolution of the circumstellar disk and the clumps formed by disk fragmentation. Our simulation shows that disk fragmentation occurs in the early phase of circumstellar disk evolution and many clumps form. The clump can be represented by a polytrope sphere of index and at central temperature K and K, respectively. We demonstrate, numerically and theoretically, that the maximum mass of the clump, beyond which it inevitably collapses, is . The entropy of the clump increases during its evolution, implying that evolution is chiefly determined by mass accretion from the disk rather than by radiative cooling. Although most of the clumps rapidly migrate inward and finally fall onto the protostar, a few clumps remain in the disk. The central density and temperature of the surviving clump rapidly increase and the clump undergoes a second collapse within – years after its formation. In our simulation, three second cores of masses , , and formed. These are protostars or brown dwarfs rather than protoplanets. For the clumps to survive as planetary-mass objects, the rapid mass accretion should be prevented by some mechanisms.
keywords:
star formation – circum-stellar disk – methods: hydrodynamics – smoothed particle hydrodynamics – protoplanetary disk – planet formation1 Introduction
Stars form in molecular cloud cores. When the angular momentum in the core is non-negligible, circumstellar disk formation is inevitable because most of the gas cannot directly fall onto central protostar. According to theoretical studies on the gravitational collapse of unmagnetized molecular cloud cores, the protostar is surrounded by a circumstellar disk immediately after its formation (Bate, 1998; Machida, Inutsuka & Matsumoto, 2010; Tsukamoto & Machida, 2011; Bate, 2011).
As noted by Inutsuka, Machida & Matsumoto (2010), the resulting disk should be sufficiently massive to develop gravitational instability (GI). If Toomre’s value of the disk is , the disk is gravitationally unstable to non-axisymmetric perturbation and develops spiral arms (Laughlin & Bodenheimer, 1994). These spiral arms readjust the surface density (Takahashi, Inutsuka & Machida, 2013) and raise the disk temperature, thereby re-stabilizing the disk. However, if radiative cooling is effective enough or the mass accretion onto the disk is sufficiently high, the disk may fragment and form clumps (Gammie, 2001; Rice, Lodato & Armitage, 2005; Inutsuka, Machida & Matsumoto, 2010; Stamatellos, Whitworth & Hubber, 2011; Kimura & Tsuribe, 2012).
Disk fragmentation is a candidate mechanism of wide-orbit planet formation (Rice, Lodato & Armitage, 2005; Vorobyov & Basu, 2010; Machida, Inutsuka & Matsumoto, 2011; Vorobyov, DeSouza & Basu, 2013). A wide-orbit planet is a planet separated from the central star by more than 10 AU (Marois et al., 2008; Thalmann et al., 2009; Lagrange et al., 2009; Marois et al., 2010; Lafrenière, Jayawardhana & van Kerkwijk, 2010). On the other hand, it has been suggested that disk fragmentation can also explain the formation of brown dwarfs (Stamatellos & Whitworth, 2009a; Stamatellos et al., 2011) or multiple stellar systems (Machida et al., 2008; Kratter et al., 2010).
The ultimate fate of the clumps depends upon their orbital and internal evolution. If the migration timescale is very small, the clump accretes onto the central protostar and eventually disappears. On the other hand, if the collapse timescale of the clump is sufficiently long, dust sedimentation may cause planetary embryos to form inside the clump (Nayakshin, 2010a).
Although the orbital and internal evolution of clumps in circumstellar disk is clearly important, a limited number of studies exist on the topic. Baruteau, Meru & Paardekooper (2011) investigated the orbital evolution of massive planets formed by disk fragmentation. They showed that the planets rapidly migrate inward on a type I migration timescale (Tanaka, Takeuchi & Ward, 2002). Adopting an analytical approach, Nayakshin (2010b) showed that the collapse timescale of the clumps is years, considerably longer than the orbital timescale at AU (approximately one thousand years). However, Nayakshin used a simplified opacity model, and he ignored further mass accretion onto the clumps from the disk. Recently, Galvagni et al. (2012) investigated the internal evolution of clumps which were extracted from three-dimensional (3D) global disc simulations. They reported a collapse timescale of about several thousand years, shorter than the estimates of Nayakshin (2010b). However, these authors similarly neglected further mass accretion onto the clumps.
To investigate the internal evolution of clumps permitting realistic gas accretion from the disk, we must simultaneously calculate the evolution of both disk and clumps. Furthermore, appropriate treatment of radiative transfer and a realistic equation of state are crucial in studies of both the disk fragmentation (Boley et al., 2007) and internal evolution of the clumps. Since clump evolution cannot be modeled assuming the thin disk approximation, 3D simulations are required. Two-dimensional simulations of the circumstellar disk would also overestimate the extent of disk fragmentation (T. Tsuribe, private communication). Stamatellos & Whitworth (2009b), who investigated the internal evolution of clumps in 3D radiative SPH simulations, reported that clumps collapse on a timescale of years. However, they initially assumed a massive isolated disk and it is unclear whether such a disk can be realized during the star formation process.
To realize a self-consistent study of disk fragmentation and clump evolution, we conducted a 3D radiation hydrodynamics simulation initiated from gravitational collapse of a molecular cloud core. Using this approach, we can follow the formation of a central protostar, disk and its fragmentation. We can also follow the orbital and internal evolution of clumps with a realistic mass accretion from the disk onto them.
In this study, we ignore the magnetic field and focus on the effects of radiative cooling on the evolution of circumstellar disk and the internal structure of clumps. Note however, that magnetic field may play an important role in the formation and evolution of the circumstellar disk, because it can efficiently transfer angular momentum (Mellon & Li, 2008; Hennebelle & Ciardi, 2009; Inutsuka, Machida & Matsumoto, 2010; Li, Krasnopolsky & Shang, 2011; Machida, Inutsuka & Matsumoto, 2011; Joos, Hennebelle & Ciardi, 2012; Seifried et al., 2013). We will describe the effect of magnetic field in our subsequent paper using new numerical methods for smoothed particle magnetohydrodynamics (SPMHD) (Iwasaki & Inutsuka, 2011; Tsukamoto, Iwasaki & Inutsuka, 2013).
This paper is organized as follows. In §2, we summarize the protostar formation process in a molecular cloud core and introduce the relevant terminology. The numerical method and initial condition are described in §3, while §4, presents the results. The paper concludes with a discussion in §5.
2 From cloud core to protostar
For later convenience, we summarize protostar formation process in the spherically symmetric cloud core and introduce the relevant terminology. The property of clumps formed in the disk are similar to the first core which is hydrostatic core formed during star formation. Thus, the internal evolution of the clump can be suitably described using the terminology of star formation (for more complete descriptions of the protostar formation process, see Larson, 1969; Masunaga & Inutsuka, 2000; Inutsuka, 2012, and references therein).
When the gravitational energy dominates the thermal energy around the center of the core, the cloud core begins to contract and the central density increases. While the radiative cooling due to dust thermal emissions overwhelms the compressional heating, the gas evolves isothermally, maintaining the temperature at about 10 K (isothermal collapse phase). The inner dense region collapses faster than the envelope because the timescale of gravitational collapse is a decreasing function of density, causing runaway gravitational collapse.
At sufficiently high density (), the compressional heating catches up with radiative cooling and the isothermal collapse terminates. The gas evolves almost adiabatically within the density range . The gas temperature rises under adiabatic contraction with the adiabatic index, for K and with for K. During this phase, thermal energy dominates over gravitational energy and a quasi-hydrostatic core forms. We refer to this quasi-hydrostatic core as the first core.
Once the central temperature of the first core reaches K, the hydrogen molecules begin to dissociate. This endothermic reaction promotes a second round of gravitational collapse at , known as the second collapse. Finally, when the molecular hydrogen is completely dissociated, the gas again evolves adiabatically with to form another hydrostatic core called as the second core. The initial mass of and radius of the second core are and , respectively. Only a small proportion of the first core collapses into the second core. Therefore, the mass of the second core is rapidly increased by mass accretion from the remnant of the first core.
3 Numerical Method and Initial Condition
In this study, we extend the simulation code used in our previous studies (Tsukamoto & Machida, 2011, 2013), to include radiative transfer with flux-limited diffusion approximation according to Whitehouse & Bate (2004); Whitehouse, Bate & Monaghan (2005). Unlike these works, we adopted standard explicit scheme for the gas pressure and the artificial viscosity in the gas energy equation. We adopted the equation of state (EOS) used in Tomida et al. (2013), which involves seven species: . Molecular hydrogen is assumed as a 3:1 mixture of ortho- and para- hydrogen and the translational, rotational and vibrational degrees of freedom are taken into account. The hydrogen and helium mass fractions are and , respectively.
We used dust opacity table provided by Semenov et al. (2003) and gas opacity table by Ferguson et al. (2005). We did not use individual time-step technique for this work and all particles were updated simultaneously. When the density exceeds the threshold density, , a sink particle was introduced. Around , the gas temperature reaches the dissociation temperature of molecular hydrogen ( K) and the second collapse begins in the clump. Therefore, we can follow the thermal evolution of the clump just prior to second collapse. The sink radius was set as AU.
The initial condition is an isothermal cloud core of uniform density, rigidly rotating with angular velocity s-1. The mass, radius and temperature of the core are , AU and K, respectively. The resultant density is g cm-3. The initial condition was subjected to a density perturbation, . The ratios of thermal to gravitational energy () and rotational to gravitational energy () are and , respectively, where , and denote the thermal, rotational and gravitational energy of the initial cloud core. These values are consistent with the results of recent 3D MHD simulation of molecular cloud and involved core formation (Inoue & Inutsuka, 2012). The cloud core was modeled with about 530 000 SPH particles.
4 Results
4.1 Overview of evolution
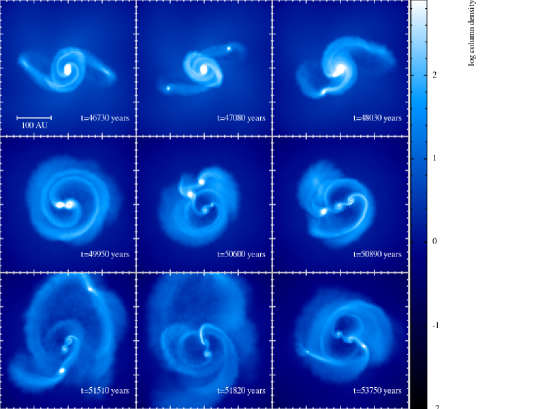
Starting from a prestellar core, we calculated the disk and clump evolutions to years following the first fragmentation. Figure 1 shows the surface density evolution at the center of the cloud core. This figure indicates that many clumps can form in the circumstellar disk during the early stages of disk evolution. Because the clumps connect smoothly to the disk, they are not always clearly delineated. In this paper, we defined a clump as a gaseous object whose central density, is .
When the central density exceeds , the clumps are clearly distinguished from the background gas (of typical density, ). At , the central temperature exceeds the dissociation temperature of the hydrogen molecule ( K) and the second collapse begins. We also defined an epoch of clump formation as the time when its central density exceeds , although gravitational contraction begins at lower density. Since the central first core is not formed in the disk, its thermal evolution is different from that of the other clumps. Therefore, we do not regard it as a clump. The central density of the first core exceeded at years (between Fig. 1b and Fig. 1c) and the first sink particle was introduced at this stage.
Two clumps formed (Fig. 1b) by the disk fragmentation. They rapidly migrated to the center and accreted onto the sink particle (Fig. 1c). During this migration, a new clump formed at AU (Fig. 1c) and similarly migrated rapidly to the center. As it journeyed, the new clump gathered mass from the disk, increasing its central density and temperature (Fig. 1d). The central density of the clump exceeded and the second sink particle was introduced between Fig. 1d and e. The two sink particles were gravitationally bound and formed a binary. As seen in Fig. 1e-g, clump formation continued in the circumbinary disk throughout the simulation time, despite the presence of the second sink (Fig. 1e-g). Most of the clumps rapidly accreted onto the sink particles and disappeared. However, one clump formed relatively far from both sink particles (see upper region of Fig. 1g) survived. The central density of this clump exceeded and a third sink particle was introduced.
Seven clumps formed within 6000 years after the first clump formation, of which five migrated to the central region and finally accreted onto the sink particles. The two clumps survived to second collapse. At the end of the calculation, the masses of the sink particles (in order of decreasing age) were , , and , respectively.
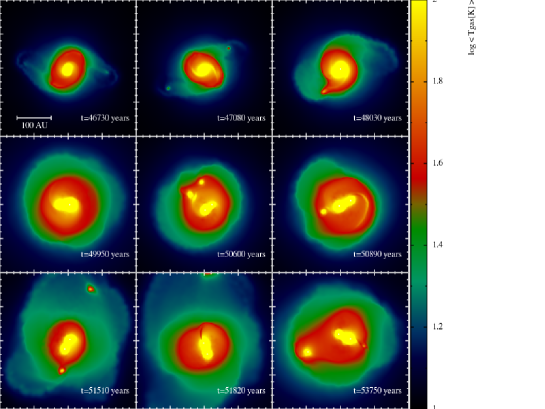
Figure 2 shows the gas temperature at the epochs indicated in Fig. 1. Collectively, Figs. 1 and 2 reveal a weak correlation between density and temperature. The gas temperature is rather determined by the gravitational potential. Therefore, EOSs that assume a polytropic relationship between pressure and density, (or the barotropic approximation) do not appropriately describe the thermal evolution of the disk. We also observe that clumps form in the outer cold regions of the disk, where the gas temperature is several tens Kelvin. Once a clump has formed, its temperature rapidly increases to higher than K under compressional heating.

4.2 Orbital and internal evolution of clumps
In this subsection, we investigate the orbital and thermal evolution of the clumps. We also investigate the orbital and thermal history of the gas prior to clump formation by tracking the fluid element at the center of each clump. To this end, we identify representative gas particles that reside at the center of each clump. When a clump undergoes a second collapse, the representative gas particle is defined as the gas particle which has maximum density immediately before the sink particle is introduced. If a clump is tidally disrupted and accreted onto the sink particle, its central density begins to decrease at some epoch. In this case, the representative gas particle is defined as the particle which has the maximum density in the clump, at the time when the central density of clump is maximum. With this definition, the representative gas particle traces the evolution of the center of each clump.
Figure 3 shows the orbits of the representative gas particles. In this figure, the orbits of formed clumps (particle densities exceeding ), are plotted with solid lines, while the preceding orbits are plotted with dashed lines. According to Fig. 3, the gas particles orbit within the disk for several orbital periods after they have accreted onto the disk. The ensuing gravitational contraction leads to clump formation. Most of the clumps are destroyed by tidal disruption and accrete onto the sink particle(s) in less than one orbital period. A notable exception is the clump shown by the cyan line. The gas was kicked out by the gravitational interaction between the binary and the clump formed relatively far from the binary. This clump was granted sufficient time for second collapse.
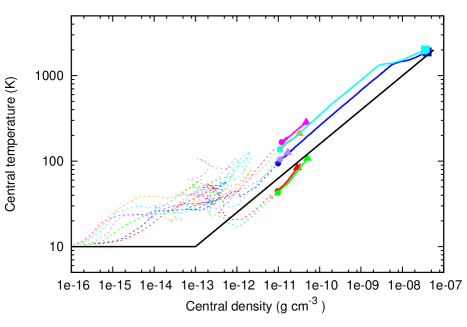
Figure 4 shows the temperature evolution of the representative gas particles as a function of density. In this figure, a typical temperature evolution of the barotropic approximation is shown for comparison (see, for example, Bate, 2011).
Unlike the barotropic approximation, the gas temperature increases to several tens Kelvin at . While the gas particles orbit in the disk, they undergo the complex density and temperature evolution around . The temperature of the gas can increase to K due to the heating caused by the gravitational instability. Once the density exceeds , the gas becomes adiabatic and further evolution of the central temperature of the clumps consistent with adiabatic contraction. However, the complex thermal evolution at densities around induces the large variance of the central entropies. As described above, most of the clumps are tidally disrupted prior to the second collapse. However, in two instances (clump evolution shown by blue and cyan lines in Figs. 3 and 4), the central temperature reaches the dissociation temperature of the molecular hydrogen, and second collapse is initiated. Dissociation is revealed by shallower slope at K in Fig. 4.
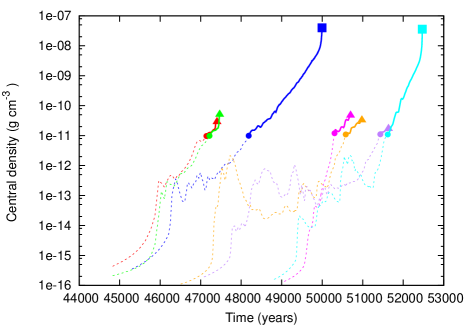
The collapse timescales of the clumps (timescales required for second collapse) are of particular interest because some interesting planet formation scenarios assume the long collapse timescales of the clumps (e.g., Nayakshin, 2010a; Cha & Nayakshin, 2011). Long collapse timescales also enable direct observation of the clumps. Figure 5 shows how the density of the representative gas particles evolves over time. When the gas accretes onto the disk, its density rapidly increases from to and oscillates between within the disk. Gravitational contraction (occurring at ) is accompanied by a rapid increase in density. Although most of the clumps disappeared within several hundred years, two clumps survived and collapsed over a timescale of – years (blue and cyan lines). This timescale is much shorter than that estimated by Nayakshin (2010b).
4.3 Structure of clumps
In figure 6, for the two clumps that survived to second collapse, temperature is plotted as a function of density at different epochs (the clumps evolve from the circles to the rhombi in the figure) to investigate how the clump structure evolves. The profiles within 10 AU from the center of the clumps are shown. The clump that collapses at years (blue lines in figure 3, 4, 5) is referred as clump 1, while that collapsing at years (cyan lines in figure 3, 4, 5) is denoted clump 2. The polytropic relationship, (), where and are the density and temperature, respectively, is plotted for comparison.
The clump structures are adequately modeled by the polytrope of index at central temperatures, is K. As the central temperature increases, the profiles become shallower, and they can be represented with the polytropes of at central temperatures exceeding K. However, the structure of clump 1 is distorted and a single-index polytrope yields a poor fit at K. On the other hand, the single-index polytrope sufficiently fits the structure of clump 2 at these temperature.
The structural difference between clumps 1 and 2 is attributable to the entropy of the accretion flow. The rapid inward migration of clump 1 (see, Fig. 3) is accompanied by rapid entropy changes of the ambient disk gas, which distort the clump structure. On the other hand, the semi-major axis of clump 2 remains relatively constant suggesting that the entropy of the accretion flow also changes little throughout the clump evolution.
As shown in Fig. 6, the entropy of the clumps increases during their evolution. This is easily understood from the increased temperature at fixed density as the clump evolves. Entropy is introduced by mass accretion from the disk. Therefore, mass accretion plays an important role in the structural evolution of the clumps. In clumps evolving solely by radiative cooling, the entropy declines over time (see, for example, Chp. 17 of Cox & Giuli, 1968).
4.4 Mass evolution of clumps
The mass evolution of the clumps is plotted in figure 7. The solid and dashed lines denote the masses of clumps 1 and 2, respectively. Because the clumps smoothly connect to the disk, their masses cannot be directly specified. Here, we define the mass of the clump, , so that it satisfies
| (1) |
where and signify the pressure, density, and cumulative mass at , respectively. Note that equation (1) is identical to Virial theorem, if the surface pressure is negligible and the clump is in hydrostatic equilibrium. The discretized form of equation (1) is,
| (2) |
where and are the pressure, density, mass, and radius from the clump center of the j-th particle, respectively. Summation is performed in ascending order from the particle of smallest radius. is the total mass within . As shown in Fig. 7, the clumps continually aggregate mass throughout their evolution. Clump 1 and 2 undergo second collapse at 900 years and 1800 years after its formation, respectively. The clump mass at second collapse is , consistent with the maximum clump mass predicted for a polytrope sphere (see, Equation (3) in §5).
The mass accretion rate onto the clump can be estimated from Fig. 7. The clump mass increases by approximately within years, yielding a mass accretion rate onto the clumps, . This result also accords with the theoretical estimate (see, Equation (4) in §5).


5 Summary and Discussion
In this paper, we performed a radiation hydrodynamics simulation using a realistic equation of state and investigated the orbital and internal evolution of clumps formed by disk fragmentation. Note that we investigated the formation and evolution of disk and clumps self-consistently.
According to our simulation, disk fragmentation and clump formation occur in the early evolution phase of the circumstellar disk. Disk fragmentation is induced by mass accretion from the infalling envelope. These results are consistent with previous works (Machida, Inutsuka & Matsumoto, 2011; Zhu et al., 2012). We show that most of the clumps rapidly migrate inward and accrete onto protostar(s). However, some clumps may survive to second collapse.
The disk gas and clump centers show the following evolutionary trends in their density and temperature. At densities of , the gas resides in the disk, where it undergoes complex thermal evolution. Heating caused by gravitational instability can raise the gas temperature to K. When the density exceeds , gravitational contraction begins and clumps form. The central gas of the clump evolves adiabatically and further evolution typifies that of first cores (Masunaga & Inutsuka, 2000). However, reflecting the complex thermal history, the central entropy of the clumps has large deviation. Once gravitational contraction has begun, the central density increases rapidly toward second collapse within - years. We found that the clumps are adequately modeled by the polytrope spheres of index at central temperatures K and at higher central temperature. These indices are much higher than those used in Zhu et al. (2012).
Fixing the polytropic index, the clump mass can be estimated as a function of the central temperature, and central density, . During adiabatic contraction, the entropy is constant and , assuming constant heat capacity at constant volume and constant ratio of heat capacity . we define the adiabatic density, and adiabatic temperature, as the values above which the central gas in the clump evolves adiabatically. The mass of the clumps is then given as
| (3) |
where, , and are the Boltzmann constant, mean molecular weight, and atomic mass, respectively. In this estimate, and () are assumed constant for simplicity, and the clump mass is expressed in terms of central temperature, adiabatic density, and adiabatic temperature. Molecular hydrogen begins to dissociate at central temperatures K, the temperature of second collapse. Thus, equation (3) indicates that second collapse occurs when the clump mass reaches . In other words, the clump has a maximum mass and second collapse is inevitable in clumps of mass . Therefore, the timescale of clump collapse is related to the mass accretion rate. This estimate of the maximum mass agrees favorably with our simulation results. The two clumps formed in our simulation collapsed at masses and (see Fig. 7).
We also showed that the clump entropy increases as the clump evolves. This implies that clump evolution is driven by mass accretion. By contrast, entropy decreases in clumps evolving by radiative cooling alone. The mass accretion rate onto the clump can be estimated by the Bondi-Hoyle-Lyttleton (Bondi & Hoyle, 1944) accretion rate as
| (4) |
where, , , and are the density, sound velocity and the characteristic velocity of the gas far from the clump, respectively. Here, we assumed the typical velocity of the gas as , which is close to the value of the sound velocity at K. From the accretion rate, the timescale of second collapse is estimated as years (yr-1), consistent with the collapse timescale of the simulated clumps (see, Fig. 7), but much smaller than the estimates of Nayakshin (2010b). This difference is largely attributable to the negligence of further mass accretion in the earlier study. Our simulation suggests that mass accretion is a main driver of clump collapse.
The typical luminosity of clumps in circumstellar disks has been estimated as (see, for example, Zhu et al., 2012). Here, we emphasize that clump luminosity would significantly increase at second collapse, as the clump gas rapidly accretes onto the new born second core. The luminosity is estimated as
| (5) |
where , , and are the second core mass, second core radius and the mass accretion rate onto the second core, respectively. The mass accretion rate is estimated as
| (6) |
is the typical radius of a young protostar (e.g., Palla & Stahler, 1993; Masunaga & Inutsuka, 2000). This luminosity increase would continue over about years.
Following second collapse, the newly formed second core accumulates further mass from the disk. The final masses of the sink particles emerging from our simulation were , , and at the end of the calculation. Thus, they are rather protostars or brown dwarfs than protoplanets. This is consistent with the results of Stamatellos & Whitworth (2009b, a).
In our simulation, the formed clumps either fall onto the protostar(s) and disappear or evolve into protostars or brown dwarfs. The clump mass easily exceeds the planetary mass range (). Therefore, if disk fragmentation is responsible for the wide-orbit planets found in recent observations (e.g., Marois et al., 2010), the rapid migration to the central star should be avoided, and the mass of the clumps should be kept small. Although the latter condition is little recognized, it is problematic in explaining how distant planets can emerge from disk fragmentation. To retain small mass clump and avoid rapid inward migration, an additional mechanism that decouples the disk and the clumps may be required. We will investigate such mechanisms in a more realistic setup involving magnetic fields (see, Iwasaki & Inutsuka, 2011; Tsukamoto, Iwasaki & Inutsuka, 2013, Iwasaki in preparation)
Acknowledgments
We thank T. Tsuribe, K. Iwasaki, S. Okuzumi, E.I. Vorobyov, and K. Tomida for their fruitful discussions. We also thank K. Tomida and Y. Hori to provide their EOS table to us. The snapshots were produced by SPLASH (Price, 2007). The computations were performed on a parallel computer, XT4 system at CfCA of NAOJ and SR16000 at YITP in Kyoto University. Y.T. is financially supported by Research Fellowships of JSPS for Young Scientists.
References
- Baruteau, Meru & Paardekooper (2011) Baruteau C., Meru F., Paardekooper S.-J., 2011, MNRAS, 416, 1971
- Bate (1998) Bate M. R., 1998, ApJ, 508, L95
- Bate (2011) —, 2011, MNRAS, 417, 2036
- Boley et al. (2007) Boley A. C., Hartquist T. W., Durisen R. H., Michael S., 2007, ApJ, 656, L89
- Bondi & Hoyle (1944) Bondi H., Hoyle F., 1944, MNRAS, 104, 273
- Cha & Nayakshin (2011) Cha S.-H., Nayakshin S., 2011, MNRAS, 415, 3319
- Cox & Giuli (1968) Cox J. P., Giuli R. T., 1968, Gordon and Breach, science publishers
- Ferguson et al. (2005) Ferguson J. W., Alexander D. R., Allard F., Barman T., Bodnarik J. G., Hauschildt P. H., Heffner-Wong A., Tamanai A., 2005, ApJ, 623, 585
- Galvagni et al. (2012) Galvagni M., Hayfield T., Boley A., Mayer L., Roškar R., Saha P., 2012, MNRAS, 427, 1725
- Gammie (2001) Gammie C. F., 2001, ApJ, 553, 174
- Hennebelle & Ciardi (2009) Hennebelle P., Ciardi A., 2009, A&A, 506, L29
- Inoue & Inutsuka (2012) Inoue T., Inutsuka S.-i., 2012, ApJ, 759, 35
- Inutsuka (2012) Inutsuka S., 2012, Prog. Theor. Exp. Phys., 2012, 307
- Inutsuka, Machida & Matsumoto (2010) Inutsuka S., Machida M. N., Matsumoto T., 2010, ApJ, 718, L58
- Iwasaki & Inutsuka (2011) Iwasaki K., Inutsuka S., 2011, MNRAS, 418, 1668
- Joos, Hennebelle & Ciardi (2012) Joos M., Hennebelle P., Ciardi A., 2012, A&A, 543, A128
- Kimura & Tsuribe (2012) Kimura S. S., Tsuribe T., 2012, PASJ, 64, 116
- Kratter et al. (2010) Kratter K. M., Matzner C. D., Krumholz M. R., Klein R. I., 2010, ApJ, 708, 1585
- Lafrenière, Jayawardhana & van Kerkwijk (2010) Lafrenière D., Jayawardhana R., van Kerkwijk M. H., 2010, ApJ, 719, 497
- Lagrange et al. (2009) Lagrange A.-M. et al., 2009, A&A, 493, L21
- Larson (1969) Larson R. B., 1969, MNRAS, 145, 271
- Laughlin & Bodenheimer (1994) Laughlin G., Bodenheimer P., 1994, ApJ, 436, 335
- Li, Krasnopolsky & Shang (2011) Li Z.-Y., Krasnopolsky R., Shang H., 2011, ApJ, 738, 180
- Machida, Inutsuka & Matsumoto (2010) Machida M. N., Inutsuka S., Matsumoto T., 2010, ApJ, 724, 1006
- Machida, Inutsuka & Matsumoto (2011) —, 2011, ApJ, 729, 42
- Machida et al. (2008) Machida M. N., Tomisaka K., Matsumoto T., Inutsuka S., 2008, ApJ, 677, 327
- Marois et al. (2008) Marois C., Macintosh B., Barman T., Zuckerman B., Song I., Patience J., Lafrenière D., Doyon R., 2008, Science, 322, 1348
- Marois et al. (2010) Marois C., Zuckerman B., Konopacky Q. M., Macintosh B., Barman T., 2010, Nature, 468, 1080
- Masunaga & Inutsuka (2000) Masunaga H., Inutsuka S., 2000, ApJ, 531, 350
- Mellon & Li (2008) Mellon R. R., Li Z.-Y., 2008, ApJ, 681, 1356
- Nayakshin (2010a) Nayakshin S., 2010a, MNRAS, 408, L36
- Nayakshin (2010b) —, 2010b, MNRAS, 408, 2381
- Palla & Stahler (1993) Palla F., Stahler S. W., 1993, ApJ, 418, 414
- Price (2007) Price D. J., 2007, PASA, 24, 159
- Rice, Lodato & Armitage (2005) Rice W. K. M., Lodato G., Armitage P. J., 2005, MNRAS, 364, L56
- Seifried et al. (2013) Seifried D., Banerjee R., Pudritz R. E., Klessen R. S., 2013, MNRAS, 432, 3320
- Semenov et al. (2003) Semenov D., Henning T., Helling C., Ilgner M., Sedlmayr E., 2003, A&A, 410, 611
- Stamatellos et al. (2011) Stamatellos D., Maury A., Whitworth A., André P., 2011, MNRAS, 413, 1787
- Stamatellos & Whitworth (2009a) Stamatellos D., Whitworth A. P., 2009a, MNRAS, 392, 413
- Stamatellos & Whitworth (2009b) —, 2009b, MNRAS, 400, 1563
- Stamatellos, Whitworth & Hubber (2011) Stamatellos D., Whitworth A. P., Hubber D. A., 2011, ApJ, 730, 32
- Takahashi, Inutsuka & Machida (2013) Takahashi S. Z., Inutsuka S., Machida M. N., 2013, ApJ, 770, 71
- Tanaka, Takeuchi & Ward (2002) Tanaka H., Takeuchi T., Ward W. R., 2002, ApJ, 565, 1257
- Thalmann et al. (2009) Thalmann C. et al., 2009, ApJ, 707, L123
- Tomida et al. (2013) Tomida K., Tomisaka K., Matsumoto T., Hori Y., Okuzumi S., Machida M. N., Saigo K., 2013, ApJ, 763, 6
- Tsukamoto, Iwasaki & Inutsuka (2013) Tsukamoto Y., Iwasaki K., Inutsuka S., 2013, MNRAS, 434, 2593
- Tsukamoto & Machida (2011) Tsukamoto Y., Machida M. N., 2011, MNRAS, 416, 591
- Tsukamoto & Machida (2013) —, 2013, MNRAS, 428, 1321
- Vorobyov & Basu (2010) Vorobyov E. I., Basu S., 2010, ApJ, 714, L133
- Vorobyov, DeSouza & Basu (2013) Vorobyov E. I., DeSouza A. L., Basu S., 2013, ApJ, 768, 131
- Whitehouse & Bate (2004) Whitehouse S. C., Bate M. R., 2004, MNRAS, 353, 1078
- Whitehouse, Bate & Monaghan (2005) Whitehouse S. C., Bate M. R., Monaghan J. J., 2005, MNRAS, 364, 1367
- Zhu et al. (2012) Zhu Z., Hartmann L., Nelson R. P., Gammie C. F., 2012, ApJ, 746, 110