Rapidity and momentum transfer distributions of coherent photoproduction in ultraperipheral pPb collisions at the LHC
Abstract
Based on accurate calculations of the flux of equivalent photons of the proton and heavy nuclei and the pQCD framework for the gluon distribution in the proton and nuclei, we analyze the rapidity and momentum transfer distributions of coherent photoproduction in ultraperipheral proton–Pb collisions at the LHC. We demonstrate that unlike the case of proton–proton UPCs marred by certain theoretical uncertainties and experimental limitations, after a cut excluding the region of small momentum transfers, ultraperipheral proton–Pb collisions offer a clean way to study the gluon distribution in the proton down to . Our analysis of the momentum transfer distributions shows that an interplay of production by low-energy photons on the nucleus and by high-energy photons on the proton in proton–Pb UPCs can result in some excess of events at small in a definite region of the rapidity .
Keywords:
ultraperipheral collisions, nuclear shadowing, gluon distribution in nuclei and in the proton1 Introduction
In this paper, we discuss sources of the model dependence of the analysis of photoproduction on the proton in proton–proton () ultraperipheral collisions (UPCs) and show that the study of this process in proton–nucleus () UPCs is free from these shortcomings. Part of our results presents an update of the earlier prediction Frankfurt:2006tp for coherent photoproduction in ultraperipheral proton–Pb collisions (for reviews of high-energy ultraperipheral collisions and proton–nucleus collisions at the LHC, see Refs. Baltz:2007kq and Salgado:2011wc , respectively).
The recent ALICE alice1 ; alice2 and LHCb lhcb measurements of exclusive photoproduction in Pb-Pb and proton–proton UPCs at the LHC confirmed the expectations Baltz:2007kq that UPCs are a very promising way to study the gluon distributions in nuclei and the proton at small . In particular, the leading order pQCD analysis Guzey:2013xba ; Guzey:2013qza of the cross section of exclusive photoproduction in PbPb UPCs alice1 ; alice2 allowed one—for the first time—to establish the evidence of the large nuclear gluon shadowing at .
The LHCb measurements of the yield of at forward rapidities () in proton–proton UPCs at 7 TeV lhcb resulted in the extension of the small- region previously studied at HERA in photon–nucleon scattering down to . The analysis of the data confirmed the power law energy dependence of the cross section ( with lhcb ) consistent with the previous HERA results and did not reveal any evidence of new phenomena such as an onset of the gluon saturation regime at small . However, this conclusion should be considered preliminary because of the large experimental errors and certain theoretical uncertainties in the data analysis.
There are two main problems with studies of exclusive photoproduction in proton–proton UPCs at the LHC. First, for symmetric (same energy) collisions and in the situation when both protons in the final state remain intact, it is not possible to select kinematics allowing one to determine which proton emitted the photon and which one served as a target (the LHC detectors have not been capable so far to detect these protons because of their very small transverse momenta). As a result, the cross section of production in proton–proton UPCs is given by the sum of two terms of a comparable magnitude. Each term can be calculated within the Weizsäcker–Williams (WW) approximation as a product of the photon flux emitted by one of the colliding participants and the cross section of photoproduction on its partner:
| (1) |
In eq. (1), and stand either for the proton or a nucleus; is the photon flux; is the rapidity, where is the photon energy, is the center-of-mass energy, is the mass of , is the nucleon mass, and and are the Lorentz factors corresponding to projectiles and , respectively. In the case of proton–proton UPCs, provided that the photon flux is evaluated with good accuracy, the cross section of photoproduction on the proton can in principle be reliably extracted from eq. (1) only in two cases: (i) at , where both contributions in eq. (1) are equal since the energies of photons emitted by both protons are equal, and (ii) in the region, where one of the contributions dominates.
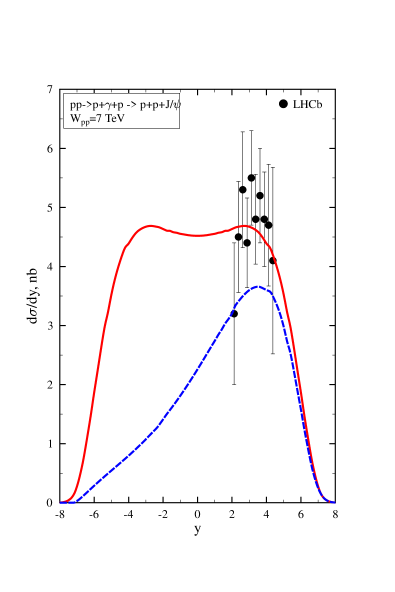
However, one can demonstrate that the latter case is not realized at the LHC. Using the leading order (LO) pQCD analysis of photoproduction on the proton Guzey:2013qza , we calculate the rapidity distribution for exclusive photoproduction in proton–proton UPCs in the kinematics of the LHCb experiment lhcb (details of the calculation are discussed in section 3). Our results are presented in figure 1: the red solid curve corresponds to the sum of both terms in eq. (1); the blue dashed curve represents the contribution of the first term in eq. (1). One can clearly see from the figure that the two curves deviate from each other in the region of covered by the LHCb measurement: the term corresponding to photoproduction by low-energy photons contributes at the level of 20% in the rapidity range of . This means that the dominance of either of the terms in eq. (1) is not realized in the LHCb kinematics.
The second problem with proton–proton UPCs is related to the account for initial and final state strong interaction between the colliding protons. In coherent photoproduction, strong interactions between colliding protons resulting in particle production should be suppressed, while elastic rescattering can still contribute 111Experimentally coherent events are selected by requiring only two leptons from the decay and otherwise an empty detector.. Some estimates of this suppression Khoze:2002dc ; Schafer:2007mm predict the suppression effect at the level of 20% for photoproduction at central rapidities in proton–proton UPCs at the LHC energies; the suppression increases with an increase of rapidity since higher photon energies require a more significant contribution of small impact parameters. Besides, at very high photon energies, one can expect an increasing role of photon emission in inelastic transitions Bertulani:1987tz and even the breakdown of the WW approximation and, hence, invalidity of eq. (1).
We argue that the study of photoproduction on the proton is much more preferable in proton–nucleus UPCs than in proton–proton UPCs. First, in the case of UPCs, the collision is asymmetric and, hence, coherent photoproduction on the proton and on the nucleus have strongly different momentum transfer distributions, which could allow one to separate these contributions using a cut on the transverse momentum, . While the contribution of coherent photoproduction on the nucleus can dominate for small ( MeV/c), it is strongly suppressed by the nuclear form factor for MeV/c.
Second, the ATLAS, CMS and ALICE detectors are equipped with Zero Degree Calorimeters (ZDC) that can be effectively used to select events of coherent photoproduction not accompanied by the strong interaction between the proton and the nucleus. Correspondingly, in theoretical estimates, one should also suppress the strong interaction in the initial and final states. In the framework of the WW approximation, this is usually done by modifying the photon fluxes emitted by protons and nuclei using the Glauber model of multiple proton–nucleus scattering.
2 Estimates of the photon fluxes in proton–nucleus UPCs
The expression for the photon flux of a fast moving non-point-like charged particle with the charge is given in many review papers (see, e.g., Bertulani:1987tz ):
| (2) |
where is the fine-structure constant; is charge form factor of the particle () and is its Lorentz factor; is the energy of the emitted photon.
In the proton case, one usually uses the dipole form of in eq. (2), . With , the integral in eq. (2) can be readily calculated analytically or numerically. However, in proton–proton UPCs, one frequently uses an approximate expression for Drees:1988pp (see also starlight ):
| (3) |
where . Different approximations to the evaluation of are discussed in Nystrand:2004vn .
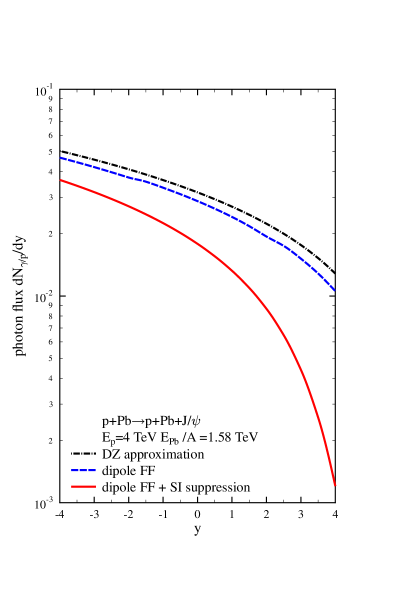
Figure 2 presents the flux of equivalent photons of the fast moving proton as a function of the rapidity of () produced in proton–Pb UPCs at TeV. In the figure, the exact calculation of eq. (2) is given by the blue dashed curve; the approximate result of eq. (3) is shown as the black dot-dashed curve (labeled “DZ approximation”). One can see from the figure that while the two results agree well for large negative (corresponding to low ), the difference between the results of eqs. (2) and (3) can reach up to 20% for large in the region of the LHCb measurement of proton–nucleus UPCs.
In the case of proton–nucleus UPCs, one also needs to take into account the suppression of the strong interaction between colliding particles (see the discussion above). The resulting photon flux of the fast proton (nucleus) can be expressed as the following convolution over the impact parameter (the distance between the proton and nucleus centers of mass):
| (4) |
where is the photon flux the transverse distance away from the proton (nucleus) (see, e.g., vidovic ),
| (5) |
is the probability to suppress the proton–nucleus strong interaction at small impact parameters ,
| (6) |
In eq. (5), is the Bessel function of the first kind. In eq. (6), is the total nucleon–nucleon cross section at the corresponding (we use mb at TeV); is the nuclear density.
The photon flux calculated using eqs. (4)–(6) is presented by the red solid curve in figure 2. One can see from the figure that compared to the results of eqs. (2) and (3), the strong proton–nucleus interaction reduces the photon flux by the factor of at low photon energies (large negative ), by the factor of two at central rapidities, and strongly suppresses at large rapidities 222 The presented result does not include the effect that the proton interacts not with the entire nucleus located at its center, but with the nucleons inside the nucleus whose spatial distribution is given by the nuclear density. The inclusion of this effect leads to some increase of at large Baron:1993nk ..
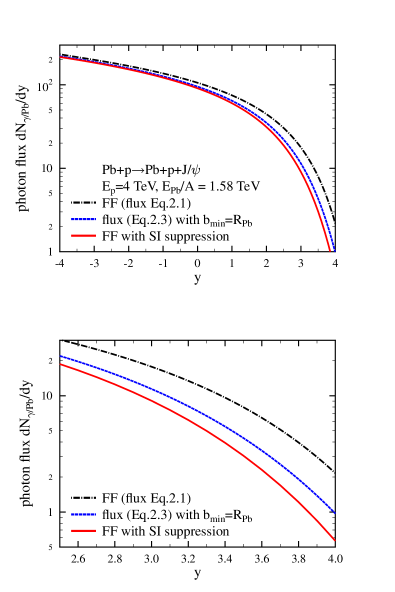
The photon flux generated by a fast moving nucleus can be calculated using eqs. (4)–(6) with the appropriate nuclear charge form factor. In the case of Pb, we used the nuclear density distribution obtained in the Hartree–Fock–Skyrme model, which describes well the root-mean-square charge radius of Pb and elastic electron–Pb scattering. The resulting photon flux of a fast moving Pb nucleus, , as a function of the rapidity of produced in Pb–proton UPCs at TeV is presented by the red curve in figure 3.
For comparison, in figure 3 we also present calculated using the following two approximations. First, the blue dashed curve corresponds to the calculation neglecting the suppression of the strong proton–nucleus interaction by setting in eq. (4) and using instead the lower limit on the integration over , ( is the radius of Pb). Second, the black dot-dashed curve corresponds to the evaluation of using eq. (2) with the Pb charge form factor.
Note that while both panels in figure 3 present the same information, the lower one highlights the region of large rapidities of important for the measurement of coherent production by high-energy photons in Pb–proton UPCs at the LHC.
To simplify calculations, one frequently uses the following approximate analytical expression for the photon flux of a fast moving nucleus:
| (7) |
where and are the modified Bessel functions of the second kind; , where is the minimal admitted distance in the impact parameter space chosen to suppress the strong interaction between the colliding particles. In the considered case of the proton–Pb interaction, it is reasonable to take . In particular, with 3% accuracy, eq. (7) with reproduces the exact result of eqs. (4)–(6) (the red solid curve in figure 3) and with — the result presented by the blue dashed curve.
3 Cross section of coherent photoproduction in LO pQCD
Equation (1) allows one to calculate the rapidity distribution of photoproduction in proton–nucleus UPCs. In obtaining the results presented below, we used the exact results for the photon flux of the proton, [eq. (2) and the red solid curve in figure 2] and for the photon flux of Pb, [eqs. (4)-(6) and the red solid curve in figure 3] and the results of our leading order (LO) pQCD analysis of exclusive photoproduction on the proton and nuclei Guzey:2013qza .
To recapitulate main results of Guzey:2013qza , at the leading order, the cross section of exclusive photoproduction on the proton reads:
| (8) |
where is the width of the electronic decay; is the slope of the dependence of the cross section; is the strong running coupling constant; is the gluon density of the proton; ; is the ratio of the real to the imaginary parts of the amplitude; is the enhancement factor taking into account the effect of skewness in the exclusive reaction; is the suppression factor stemming from a host of effects beyond the approximation used in eq. (8) (next-to-leading order corrections, the effect of the overlap between the photon and wave functions, etc.).
The analysis of Guzey:2013qza demonstrated that the HERA and LHCb data on photoproduction on the proton can be described very well by eq. (8) evaluated at the hard scale of GeV2 using a large array of modern gluon distributions in the proton. The results presented below (including the nuclear case) are calculated with the MNRT07 gluon distribution Martin:2007sb : since this distribution is constrained to describe the HERA photoproduction data, the corresponding suppression factor is absent, i.e., .
When extending eq. (8) to the case of a nuclear target, one needs to take into account the effect of the leading twist nuclear gluon shadowing Frankfurt:2011cs and the fact that and for the amplitude are smaller than their proton counterparts 333At small , the leading twist nuclear gluon shadowing slows down an increase of the nuclear gluon density with a decrease of , which leads to a decrease of and .; the combination of these two effects is encoded in the nuclear suppression factor Guzey:2013xba ; Guzey:2013qza . The resulting cross section of exclusive photoproduction on a nucleus is:
| (9) |
where , where is the minimal momentum transfer to the nucleus and is the nucleus form factor.
4 Results and discussion

Figure 4 presents our predictions for the rapidity distribution of photoproduction in proton–Pb UPCs integrated over the momentum transfer in the LHC kinematics calculated using eq. (1) and the input discussed above. In the figure, the red solid curves correspond to the sum of both terms in eq. (1); the blue dashed curves are the contribution of the photon–nucleus term only. One expects that the photon–proton contribution should by far dominate the photon–nucleus one because (i) the nuclear enhancement of the photon flux emitted by the nucleus (the factor of ) is much stronger than that of the -integrated coherent photon-nucleus cross section (the factor of ) and (ii) because nuclear shadowing suppresses the photon–nucleus cross section. One can readily see from the figure that the contribution of photoproduction of on the proton dominates in the whole range of rapidities which can be studied by the ALICE, ATLAS, CMS and LHCb detectors (the ranges of covered by the corresponding experiments are indicated by the labels “ALICE”, “ATLAS, ALICE, CMS” and “LHCb”).
Since during the run in 2013 the beam direction was inverted, we show two options of the collision geometry. In the top panel of figure 4, the rapidity is positive in the nucleus beam direction. In this case, the ALICE muon detector covering the rapidity range of probes (i) production of on the proton by low-energy photons emitted by lead (the proton gluon density around for ) and (ii) production on the nucleus by high-energy photons emitted by the proton (the nuclear gluon distribution down to ). The corresponding average values of the probed are indicated in the figure.
One should note that with the considered beam directions, the LHCb detector, which covers the range, can measure photoproduction on the proton by high-energy photons emitted by lead and, hence, can access the gluon distribution in the proton down to .
The bottom panel of figure 4 corresponds to the inverse beam direction. Therefore, ALICE will study photoproduction in the interaction of high-energy photons with the proton (small ) and of low-energy photons with Pb (around ); the LHCb detector will access scattering of low-energy photons on the proton and of high-energy photons on Pb.
From the calculated rapidity distributions presented in figure 4, we find that the contribution of photoproduction on the nucleus is small – its contribution ranges from 2% for the high-energy photon–nucleus photoproduction to about 7% for the low-energy photons. Note that since our theoretical description Guzey:2013xba of the cross section at and reproduces well the ALICE data alice1 ; alice2 and very weakly depends on the choice of the gluon distribution and the hard scale , the proton–nucleus contribution can be considered to be reliably fixed. Therefore, one can try to exclude it using a cut on the momentum transfer since the momentum transfer distributions in photoproduction on the nuclear and the proton targets are strongly different.
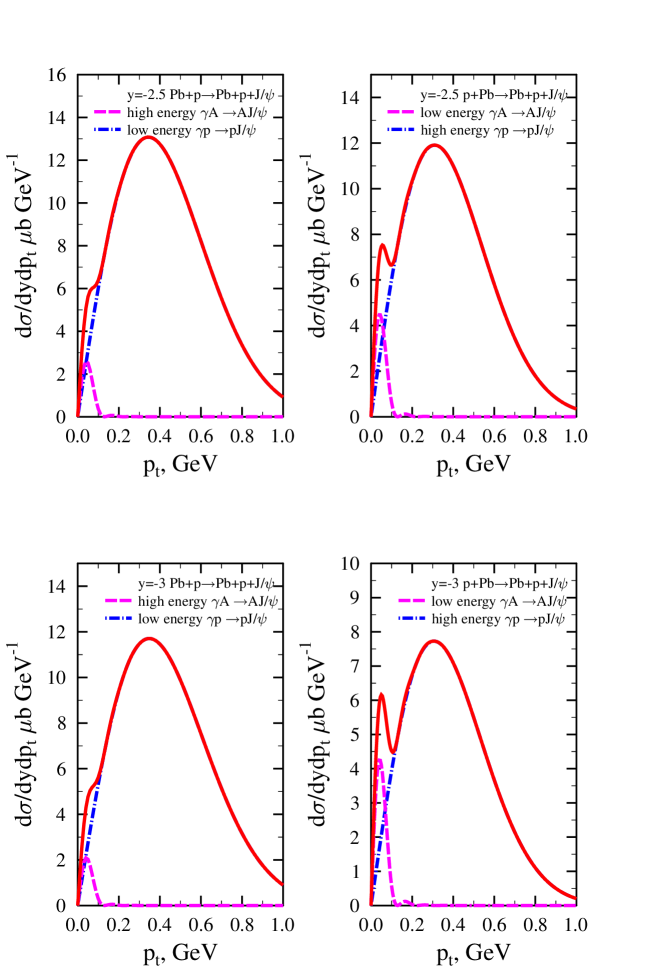
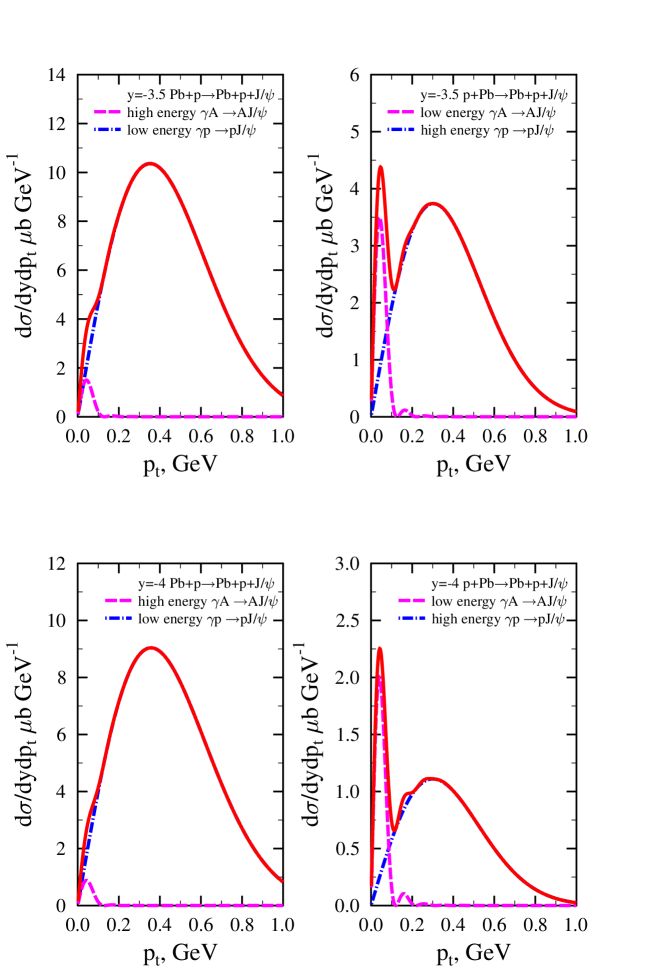
To check whether it is possible to separate coherent photoproduction of on the nuclear and proton targets in the current kinematics, we calculated the distribution of coherent photoproduction in proton-Pb and Pb-proton UPCs in the LHC kinematics as a function of the momentum transfer squared at a few values of the rapidity (see figure 5). As expected, the contribution of photoproduction on the nuclear target is strongly peaked at very small . Thus, it can be either separated by the cut on small , GeV2, or analyzed provided the experiment has sufficiently high statistics.
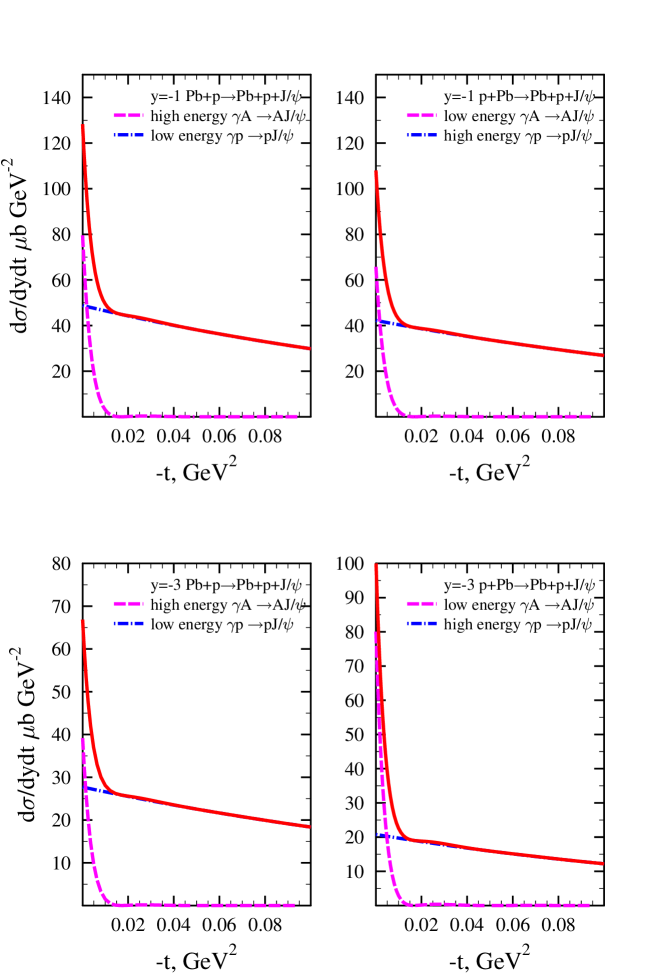
There is an interesting feature which can be seen when the distribution of coherent photoproduction in proton-Pb and Pb-proton UPCs is presented as a function of the transverse momentum transfer (see figures 6 and 7). Coherent photoproduction on lead by low-energy photons from the proton results in a narrow peak in the momentum transfer distribution starting from the rapidities of (the same effect can be observed at positive rapidities when the beam direction is reversed). For the rest of rapidities (), photoproduction on the proton target is significantly larger and, thus, this peak disappears. This effect arises due to the steep drop of the photon flux generated by Pb with an increase of the photon energy. While experimentally this effect can be revealed only with the high transverse momentum resolution, this should nevertheless result in some excess of events at small MeV/c . It is important to follow our suggestions for the cuts in and by detailed numerical studies/simulations examining how these cuts can be realized in the LHC experiments.
It is of interest to check feasibility to quantify the magnitude of the nuclear gluon shadowing and, thus, to differentiate among different theoretical predictions for nuclear shadowing, using the analysis of the shape of transverse momentum distributions measured in coherent photoproduction in ultraperipheral proton-Pb collisions at .
From the ALICE measurements of coherent photoproduction in Pb-Pb UPCs at TeV, it was found that at , the nuclear gluon shadowing is Guzey:2013xba . This value is in a good agreement with the predictions of the EPS09LO fit and the leading twist approximation (LTA) in the theory of nuclear shadowing employing a large array (CTEQ6L, CTEQ6L1, MRST04, NNPDF, and MNRT07LO) of leading order gluon distributions in the proton, for details and references, see Guzey:2013qza . While the ALICE Pb-Pb UPC data does not allow one discriminate between the EPS09LO and the LTA approaches since their respective predictions for converge at , in the current proton–Pb study, the ALICE and LHCb muon spectrometers extend the kinematic coverage in down to , where the difference between the EPS09LO and LTA+MNRT07LO predictions for is sizable. Indeed, while EPS09LO predicts that is practically constant for with , the LTA+MNRT07LO nuclear gluon shadowing increases with a decrease of and reaches . This difference in the predicted values of leads to the approximately factor of two difference in the predicted values of the cross section. In spite of the smallness of the contribution to the process (see figures 6 and 7), this difference can be seen in the transverse momentum distribution.
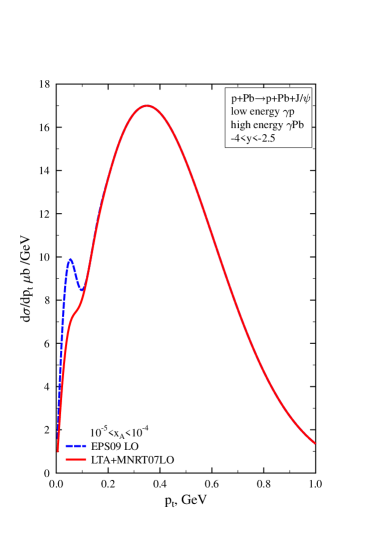
Figure 8 presents the result of our calculations of the transverse momentum distribution integrated over the rapidity interval. Note that for the ALICE detector, the positive rapidity is in the Pb beam direction. (In the case of the LHCb detector, this kinematics corresponds to in pPb collisions with the positive rapidity in the direction of the proton beam.) The red solid curve corresponds to the LTA+MNRT07LO prediction for the nuclear gluon shadowing (see the left panels in figures 6 and 7); the blue dashed curve corresponds to the central value of the EPS09LO fit. As we explain below, we do not show the small error band around each curve since its effect is negligibly small.
One can see from figure 8 that the two scenarios of the nuclear gluon shadowing predict different shapes of the transverse momentum distribution at small . In particular, since the small- gluon shadowing is weaker in EPS09LO than in LTA+MNRT07LO, a peak—about 30% excess—appears at small in the EPS09LO case. Since the shape of the momentum transfer distribution in in this region of is well known (), an observation or non-observation of a small- shoulder in the transverse momentum distribution would be unambiguously correlated with the magnitude of the nuclear gluon shadowing. Thus, such a measurement could be the first experimental estimate of the nuclear gluon shadowing at in lead.
Note that the analysis and interpretation of data require taking into account the following three effects. First, the process contributing at small should be subtracted. The cross section of this process is reliably calculated in StarLight. Second, the process with diffractive dissociation of the proton target distorts the shape of the transverse momentum distribution. However, since this process was studied in this region of at HERA, its contribution can be easily modeled. Third, the target dissociation in the process can be rejected by a ZDC.
It should be emphasized that the numerical predictions using eqs. (8) and (9), which we show in this section, employ the MNRT07 gluon density at GeV2. This parameterization describes very well the data on photoproduction on the proton and well the data on coherent photoproduction on Pb Guzey:2013qza . A similarly good description of these data sets can be obtained with other parametrizations of the gluon distributions of the proton (CTEQ6L, CTEQ6L1, MRST04, NNPDF) and the corresponding nuclear suppression factors , which could be evaluated at a range of near GeV2, GeV2. Thus, different choices of the gluon distribution and the scale do not affect our conclusions. At the same time, the use of a different gluon parameterization evaluated at a slightly different scale will affect our predictions for the photon–nucleus cross section at high energies corresponding to , see the corresponding curves in figs. 5, 6 and 7. An example of sensitivity to this effect is presented in fig. 8.
Note also that we do not show the theoretical uncertainty of the photon–nucleus contribution, which comes from the uncertainties of the predicted amount of nuclear gluon shadowing in the framework of the leading twist approximation (LTA+MNRT07L0). Its effect is small compared to the magnitude and pattern of the rapidity distributions presented in this section.
Our results can be compared to the predictions for photoproduction in proton–nucleus UPCs available in the literature. The approach used in Adeluyi:2013tuu is very similar to ours but different in implementation. First, the photon flux of the proton used in Adeluyi:2013tuu does not include the effect of the suppression of the proton–nucleus strong interaction at small impact parameters. As a result, the maximum of the rapidity distribution of photoproduction on the nucleus is shifted to significantly higher . Second, the MSTW08 gluon distribution Martin:2009iq used in Adeluyi:2013tuu fails to describe the LHCb data on the behavior of the cross section. This gluon distribution leads to a strong increase of the cross section at high photon energies (small gluon ) resulting in a significant shift (by two units of rapidity) of the maximum of the rapidity distribution of photoproduction on the proton in Pb–proton UPCs compared to our results in figure 5. As a result, in the range of rapidities corresponding to high-energy photons emitted by Pb, our predictions differ by as much as a factor of three. Third, the combination of the MSTW08 gluon distribution with the nuclear PDFs extracted from the global QCD fits (such as the EPS09 nuclear PDFs eps09 ) is inconsistent, see the discussion in Guzey:2013qza .
Predictions for the rapidity distribution of the cross section were also made using the framework of the color dipole model Lappi:2013am . The resulting distribution is quantitatively similar to our result. However, one has to keep in mind that the dipole approach overestimates the cross section measured by the ALICE collaboration alice1 , see the discussion in Guzey:2013qza .
Note also that the momentum transfer distributions have not been analyzed in Adeluyi:2013tuu and Lappi:2013am .
5 Conclusions
In conclusion, we have shown that the study of photoproduction in Pb-proton and proton-Pb UPCs at the LHC energies allows one to measure with good accuracy photoproduction of charmonium on the proton target at small , when one imposes a cut on the transverse momentum of produced at the level of MeV/c. It will be hardly possible to extract the cross section of photoproduction on a nucleus at small and, hence, to quantify the effect of the nuclear gluon shadowing since even after applying the MeV/c cut, the contribution at large is still comparable to the contribution at small . By analyzing the momentum transfer distributions, we found that an interplay of production by low-energy photons on the nucleus and by high-energy photons on the proton in proton–Pb UPCs can result in some excess of events at small in a definite region of rapidities (for ). Such an excess can be studied by the ALICE and LHCb collaborations.
Acknowledgements
We would like to thank E. Kryshen for useful discussions.
References
- (1) L. Frankfurt, M. Strikman and M. Zhalov, Phys. Lett. B 640 (2006) 162 [hep-ph/0605160].
- (2) A. Baltz et al., Phys. Rept. 458 (2008) 1 [arXiv:0706.3356 [nucl-ex]].
- (3) C. A. Salgado, J. Alvarez-Muniz, F. Arleo, N. Armesto, M. Botje, M. Cacciari, J. Campbell and C. Carli et al., J. Phys. G 39 (2012) 015010 [arXiv:1105.3919 [hep-ph]].
- (4) E. Abbas et al. [ALICE Collaboration], Eur. Phys. J. C 73 (2013) 2617 [arXiv:1305.1467 [nucl-ex]].
- (5) B. Abelev et al. [ALICE Collaboration], Phys. Lett. B 718 (2013) 1273 [arXiv:1209.3715 [nucl-ex]].
- (6) R. Aaij et al. [LHCb Collaboration], J. Phys. G 40 (2013) 045001 [arXiv:1301.7084 [hep-ex]].
- (7) V. Guzey, E. Kryshen, M. Strikman and M. Zhalov, Phys. Lett. B 726 (2013) 290 [arXiv:1305.1724 [hep-ph]].
- (8) V. Guzey and M. Zhalov, JHEP 1310 (2013) 207 [arXiv:1307.4526 [hep-ph]].
- (9) V. A. Khoze, A. D. Martin and M. G. Ryskin, Eur. Phys. J. C 24 (2002) 459 [hep-ph/0201301].
- (10) W. Schafer and A. Szczurek, Phys. Rev. D 76 (2007) 094014 [arXiv:0705.2887 [hep-ph]].
- (11) C. A. Bertulani and G. Baur, Phys. Rept. 163 (1988) 299.
- (12) M. Drees and D. Zeppenfeld, Phys. Rev. D 39 (1989) 2536.
- (13) S. Klein, J. Nystrand, Phys. Rev. C 60 (1999) 014903; http://sourceforge.net/projects/upcstarlight
- (14) J. Nystrand, Nucl. Phys. A 752 (2005) 470 [hep-ph/0412096].
- (15) M. Vidovic, et. al. Phys. Rev. C 47 (1993) 2308.
- (16) N. Baron and G. Baur, Phys. Rev. C 48 (1993) 1999.
- (17) A. D. Martin, C. Nockles, M. G. Ryskin and T. Teubner, Phys. Lett. B 662 (2008) 252.
- (18) L. Frankfurt, V. Guzey and M. Strikman, Phys. Rept. 512 (2012) 255 [arXiv:1106.2091 [hep-ph]].
- (19) A. Adeluyi and T. Nguyen, Phys. Rev. C 87 (2013) 027901 [arXiv:1302.4288 [nucl-th]].
- (20) A. D. Martin, W. J. Stirling, R. S. Thorne and G. Watt, Eur. Phys. J. C 63 (2009) 189 [arXiv:0901.0002 [hep-ph]].
- (21) K. J. Eskola, H. Paukkunen and C. A. Salgado, JHEP 0904 (2009) 065 [arXiv:0902.4154 [hep-ph]].
- (22) T. Lappi and H. Mantysaari, Phys. Rev. C 87 (2013) 032201 [arXiv:1301.4095 [hep-ph]].