0214689544@mail.ecc.u-tokyo.ac.jp
Flux Avalanches in Nb Superconducting Shifted Strip Arrays
Abstract
Flux penetrations into three-dimensional Nb superconducting strip arrays, where two layers of strip array are stacked by shifting a half period, are studied by using magneto-optical imaging method. Flux avalanches are observed when the overlap between the top and bottom layers is large even if the width of each strip is well below the threshold value. In addition, anomalous linear avalanches perpendicular to the strip are observed in the shifted strip array when the overlap is very large and the thickness of superconductor is greater than the penetration depth. We discuss possible origins of the flux avalanches including the linear ones by considering the flux penetration calculated by the Campbell method assuming the Bean model.
pacs:
74.78.Fk, 68.60.Dv, 74.25.Ha, 74.25.Op1 Introduction
Superconductors have been fabricated into three-dimensional structures to realize their unique functionalities. They can be used as metamaterials with unusual electric permittivity or magnetic permeability [1, 2], which can realize the magnetic cloaking without disturbing the external magnetic lines of force compared with the conventional magnetic shielding by superconductors or mu-metals [3, 4, 5]. The rapid single-flux-quantum device is also a major application which can replace the conventional CMOS semiconductor device for its high operation speed with low power consumption [6]. Additionally, the superconducting Roebel cable with a three-dimensional structure can suppress AC losses by twisting superconducting tapes [7]. For those applications, bulk magnetization measurements, evaluations of device operation, or transport measurements have been extensively undertaken as well as theoretical calculations [8]. However, little is known about the local magnetic response of such three-dimensional superconductors. Therefore, it is of great importance to investigate their local magnetic properties to obtain scientific and technological information on the three-dimensional superconductors and to improve the performance of their applications.
The magnetic flux penetrates into superconductors as quantized vortices under magnetic fields above the lower critical field, and the vortices arrange themselves in a self-organized manner into the critical state, where the Lorentz force by the shielding current balances the pinning force by defects [9]. On the other hand, unique phenomena known as flux avalanches (flux jumps) due to thermo-magnetic instabilities are often observed when the heat generated by the vortex motion surmounts the heat diffusion [10, 11]. This instability becomes an obstacle for the applications of superconductors due to quenching [12] or generation of noise [13]. The condition for flux avalanches depends on various kinds of parameters; temperature, applied field, thermal conductivity, the geometry of samples, and so on [14]. Flux avalanches can occur at very low magnetic fields in thin film samples due to stronger demagnetization effect [15]. This effect can be enhanced even more in superconducting structures consisting of many thin films arranged close by [16]. Recently, electromagnetic responses in hexagonal arrays of superconducting strips have been reported theoretically as a metamaterial with stronger anisotropy in magnetic permeability [17]. The larger magnetic anisotropy in the system is suitable to realize magnetic cloaking and other applications by controlling magnetic field distribution. However, it always accompanies a risk of thermomagnetic instability due to stronger demagnetizing effect. Therefore, it is important to investigate conditions for flux avalanches and get information on the controlling parameter to such phenomena.
In this paper, we extract two layers from the hexagonal array of superconducting strips, and investigate its local magnetic response with changing temperatures, fields, and the sizes of the samples. Hereafter, we call these three-dimensional structures as “shifted strip arrays (SSAs)”.
2 Experiments
-
Name (nm) (nm) SSA50-50 50 50 SSA100-100 100 100 SSA200-200 200 200 SSA300-300 300 300 SSA300-50 300 50 SSA500-50 500 50
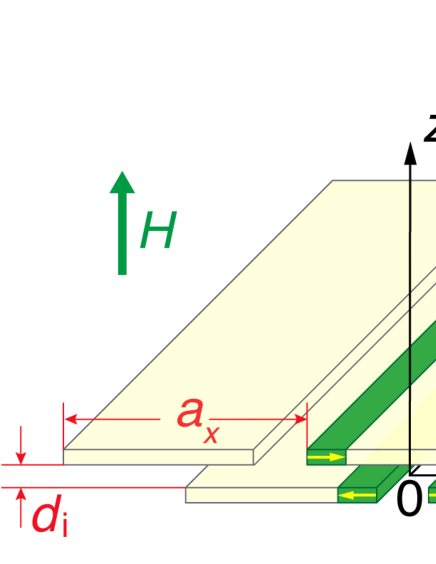
We have fabricated several kinds of SSAs of Nb ( K) on Si substrates by using DC magnetron sputtering, photolithography, SF6 reactive ion etching, caldera planarization technique [18, 19], and have cut unnecessary parts by using focused-ion-beam etching technique. Figure 1 shows the schematic drawing of SSA, which corresponds to two layers of hexagonal strip arrays. The array consists of strips with a fixed width of m and thicknesses ranging from 50 to 500 nm. Strips are arranged periodically along axis with period ranging from 9 to 16 m. Two layers of such arrays are displaced by /2 along -axis and stacked by sandwiching SiO2 insulating layer with thicknesses ranging from 50 to 300 nm. We define names of SSAs as SSA- as shown in Tab. 1.
Flux distributions in SSAs are observed under the external magnetic field ( mT) along axis after cooling them down to temperature ranging from 4.5 to 8.5 K under zero-field. To visualize flux penetrations in SSAs, we use the magneto-optical (MO) imaging technique in which the spatial variation of the out-of-plane flux density is detected by using the Faraday effect in a ferromagnetic garnet film [20, 21]. The gap between the sample and the garnet film has been minimized by gently pushing down the garnet film with two small phosphor bronze plates. In MO measurements, we used a commercial optical microscope (OLYMPUS BX30MF) with a x20 objective lens (Nikon CF Plan 20X) and a cooled-CCD camera with 12-bit resolution (ORCA ER, Hamamatsu). The samples are cooled down to temperatures ranging from 4.2 K to 8.5 K under zero-field by using a He-flow cryostat (MicrostatHighRes II, Oxford Instruments). Magnetic field along -axis was applied isothermally at each temperature. The obtained MO images are integrated over tens of images and subtracted by a zero-field background image to improve the magnetic resolution and to suppress artifacts originated from in-plane magnetic domains or scratches on the garnet film [22]. It should be noted that even single vortices can be observed by this technique [22, 23, 24, 25].
3 Results and Discussion
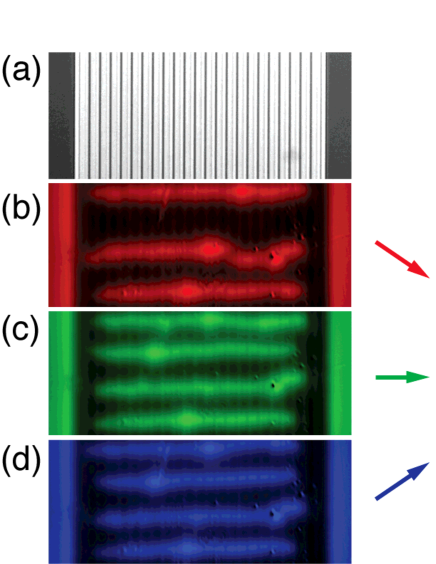
Figure 2(a) shows an optical image of SSA300-50 with m. Numbers of strips in direction are chosen to limit the samples within a range of 200 m. In this sample, 23 and 24 strips are fabricated on the top and bottom layers, respectively. Lengths of strips in direction are also 200 m, which is long enough to consider the system as a collection of infinite strips. MO images of flux penetrations into the sample are shown in Figs. 2(b)-2(d) under the same condition at 4.2 K and under mT repeatedly. These images are colored in three kinds of channels (red, green, and blue) and are added into an image as shown in Fig. 2(e). In this combined image, the gray scale regions show reproduced flux penetrations, known as the usual critical state. On the other hand, colored areas indicate that the flux front is not reproducible. This phenomenon is known as the flux avalanche caused by the thermo-magnetic instability, which rapidly appears with increasing field and has non-reproducible shapes [26]. Some avalanches, however, repeatedly occur at similar locations possibly due to defects in the superconductor or the stray field generated by the magnetic domains in the indicator film. Flux avalanches usually occur with their positions far from each other due to the nonlocal repulsive force between flux in thin films, and the observed flux avalanches similarly do not overlap but align. There are two noteworthy points different in flux avalanches in SSA different from those in plain films. One is about morphology of flux avalanches. The observed flux avalanches have linear shapes traversing many strips. Flux avalanches in plain films are known to have various kinds of shapes [27]: uniform [28], finger-like [29], and dendritic [30]. On the contrary, flux avalanches in SSAs likely jump from one strip to another and tend to form anomalous linear shapes perpendicular to the strips as shown in Figs. 2(b)-2(d). Another point is about the starting point of flux avalanches. They do not start at the outermost edges of SSAs as they do in plain films. In addition, we should not overlook that linear flux avalanches have knots around the middle of the lines and they may have initiated there. However, the time-resolved measurements of flux propagation is needed to discuss where flux avalanches start from [31].
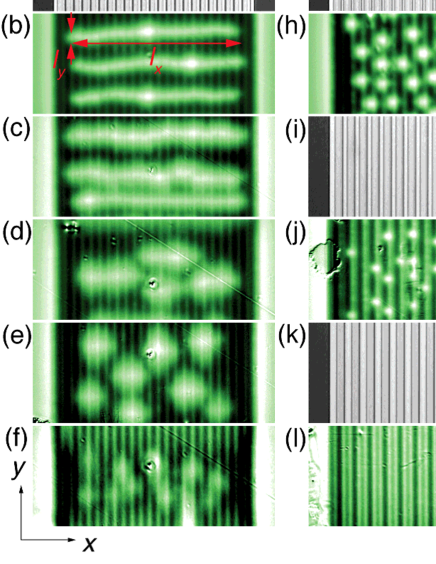
Figure 3 shows and dependences of flux penetrations in SSA300-50. The MO images shows flux distribution after applying magnetic fields isothermally at each temperatures. With m, flux avalanches occur at high temperatures up to 8.5 K (0.92) as shown in Fig. 3(f). Generally, flux avalanche in strips or films occur below a characteristic field-dependent temperature, so-called threshold temperature, and in range of magnetic fields above a threshold field and below a certain upper field in isothermal conditions [14, 32, 33]. The typical value of the threshold temperature in Nb film is about 5 K [30, 33, 34, 35]. According to Eq. (1) of Ref. [30], flux avalanches occur only below threshold temperature 1 K in an isolated superconducting single strip with thickness of 300 nm and width of 8 m assuming typical physical parameters of Nb [30]. Therefore, it seems reasonable to suppose that the three-dimensional structures of SSAs enhance flux avalanches. We will discuss how the structures induce flux avalanches in latter part of this paper. In the followings, detailed account of linear flux avalanches is given. As shown in Fig. 3(b), the linear avalanches at 4.2 K expand over the entire width of the sample (200 m). At higher temperatures (Figs. 3(c)-3(f)), the length of the flux avalanche along axis, , becomes smaller and avalanches form small fragments. It is obvious that the average length monotonically decreases with increasing . In contrast, the behavior of the width of the linear flux avalanche along axis, , is different. It is the smallest at 4.2 K (Fig. 3(b)), and increases with increasing as shown in Figs. 3(c)-3(e), followed by a decrease near (Fig. 3(f)). According to earlier theory and experiments [14, 36], sizes of flux avalanches both along and directions increase monotonically with increasing . It is opposite to out result that the length decreases as temperature increases. There is no satisfactory explanation about this anomalous temperature dependence at the present stage. On the other hand, the positive temperature dependence of in SSAs below 8 K agrees with the theory for the single strip. In addition, the anomaly of at 8.5 K (Fig. 3(f)) can be explained by the large penetration depth near which is even larger than the thickness when we assume two-fluid model for its dependence [37]. Next, dependence of the flux avalanches at 4.2 K is shown in Figs. 3(g)-3(l). With increasing , the linear avalanches disappear at 11 m as shown in Fig. 3(h). Instead of the linear flux avalanches, spot-like avalanches appear in each strip. With larger , the size of spots shrinks (Fig. 3(j)). Finally, no flux avalanches occur in SSA with m (Fig. 3(l)), confirming that the threshold temperature in single strips with m is below 4.2 K as estimated above, because SSA without an overlap can be treated as a quasi two-dimensional array of single strips. It indicates that the three-dimensional structure in SSA promotes flux avalanches. In the following section, we discuss possible origins of the linear flux avalanches.
There are two scenarios to explain the origin of the linear avalanches; thermal and magnetic couplings. The interlayer thermal coupling promotes the linear flux avalanches. The heat generated by an avalanche diffuses into the surroundings which are usually considered as a heat bath at a fixed temperature. The heat transfer coefficient is an important parameter to determine the condition for flux avalanches [14]. However, special care needs to be taken in SSAs because the strips are thermally coupled to each other via thin insulating layers. Therefore the heat produced by the first flux motion in one layer triggers the motion of another flux in the neighboring layer due to the interlayer thermal coupling. Besides, the linear flux avalanches can occur due to the magnetic coupling between vortices in two overlapping layers. The motion of vortices in the bilayer superconductors has been well-studied for its application of the dc superconducting transformer [38]. The stray field generated by a vortex in one superconducting layer attracts another vortex in the neighboring layer. Even when the Lorentz force is applied only on one of the vortices, the other vortex is dragged by the magnetic coupling force. Of course, the two couplings are not mutually exclusive rather they can cooperate to promote the linear flux avalanche.
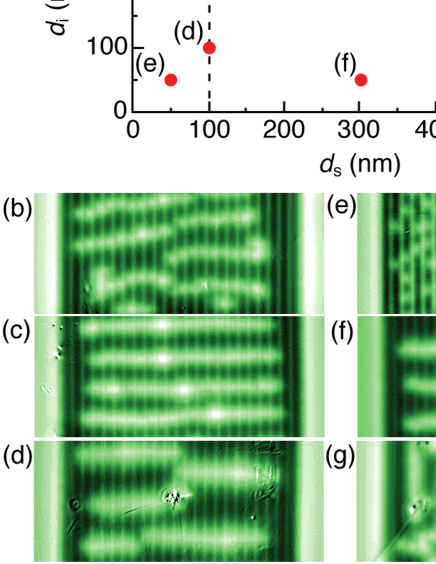
Figure 4 shows MO images for SSAs with different and with m at 4.2 K. Considering dependence with a fixed (see Figs. 4(b) and 4(f)), the length becomes larger with a smaller . This result is consistent with thermal/magnetic coupling scenarios. Next, dependence with a fixed is non-monotonic as shown in Figs. 4(e)-4(g), indicating that it is difficult to explain the dependence only by the above scenario because the thermal/magnetic coupling should hold constant with the same . It is especially anomalous that no linear avalanche is observable with small as shown in Fig. 4(e). To explain this behavior, a dashed line for the condition with nm at 4.2 K is plotted in Fig. 4(a), where is the penetration length [37]. As noted in the temperature dependence, we confirm the anomaly occurs when becomes comparable to or larger than (Fig. 3(f)). Finally, flux avalanches with equal and are shown in Figs. 4(b)-4(e). This dependence is complicated because it has both and dependences. Similar to the dependence with fixed , the length decreases with increasing when is larger than 200 nm (Figs. 4(b) and (c)). However, even with thinner , the linear avalanches disappear when is less than nm (Figs. 4(d) and 4(e)). From the results on , , , and dependences, the conditions for the linear avalanche can be summarized as follows; (1) large overlap between top and bottom layers, (2) thinner for the stronger interlayer thermal/magnetic coupling, (3) thinner for the longer length , and (4) the thickness should be larger than . In the following section, we discuss the origin of the flux avalanches in SSA by considering the flux distribution.
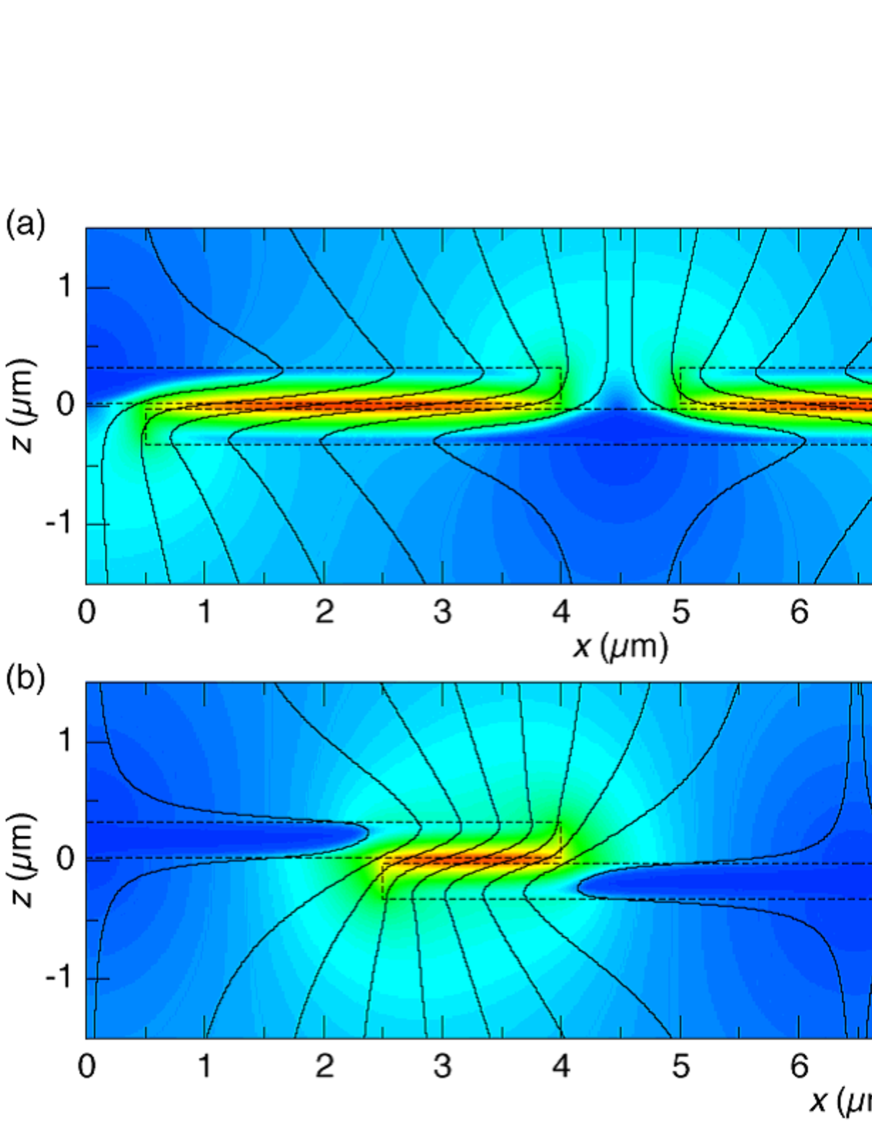
The electromagnetic responses of SSAs are calculated by using the Campbell method with assuming the Bean model [39]. Figure 5 shows the flux distribution in SSA300-50 with = (a) 9 m and (b) 13 m under applied field of , where is the critical current density. The magnitude of the flux density, , is plotted in a color scale. It is noted that, becomes 10 times larger than within the overlaps, and the maximum values are almost the same for different ’s. We speculate that this enhancement of the local flux density and its temporal evolution generates the large electric field and heat dissipation when the flux penetrates into SSA, which finally promotes the flux avalanches at such high temperatures close to . In addition to distribution, the magnetic lines of force are shown as black solid lines in Fig. 5. The lines lie in-plane, indicating that the magnetic coupling is weak in this system compared with the conventional superconducting dc transformer, where flux lines penetrate two films perpendicularly. Therefore, we can conclude that the most possible origin of linear flux avalanches is the thermal coupling between overlapping strips. It should be noticed that these numerical calculations corresponds to flux distributions at low or thick since is considered to be much smaller than . Therefore, further discussions on the condition where becomes comparable to will be required to explain the experimental anomaly at high temperatures.
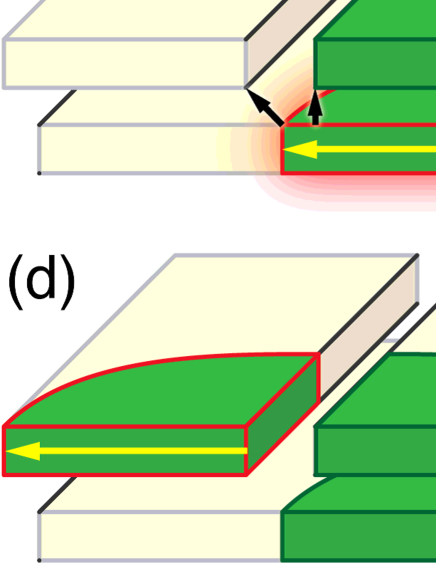
Finally, we explain how interlayer thermal couplings promote linear flux avalanches. Figure 6 shows a schematic model how a linear avalanche evolves in time. We assume that the flux front of an avalanche can reach only the middle of the strip and that the thermal diffusion is slower than the magnetic diffusion. (a) An avalanche occurs at A due to thermal or magnetic fluctuations in one layer and it proceeds towards B in the strip as shown as a yellow arrow. (b) The heat generated by the avalanche diffuses out into the surroundings as shown by a red shadow. Then, new avalanches are triggered at C and D due to the thermal fluctuations which are enhanced by the heat transfers from the original strip via an insulating layer as shown by black arrows. (c) Linear flux avalanches proceed in the bottom layer by the same processes and the generated heat is transferred to the top layer as shown by black arrows. (d) New linear avalanches are formed in the top layer as shown by yellow arrows. However, the processes will stop when the following condition is satisfied. The heat transfer from on layer to the other is not enough with large or thick , which is shown by black arrows in Fig. 6(b). This consideration is consistent with the experimental results that linear avalanches occur with small , small as shown in Fig. 3 and Fig. 4.
4 Summary
Flux penetrations into three-dimensional double-layered superconducting strips, shifted strip arrays, are studied by using magneto-optical imaging method. Flux avalanches are observed when the period of a shifted strip array is small, or the overlap between the top and bottom layers is large. Anomalous linear flux avalanches are observed in the shifted strip array when the overlap is very large when the thickness of superconductor is larger than the penetration depth, and when the interlayer gap is small. We conclude that the linear flux avalanches are caused by the interlayer thermal coupling. We believe that our work opens a new direction of the study of three-dimensional nanostructured superconductors.
References
References
- [1] Pendry J B 2006 Science 312 1780–1782
- [2] Schurig D, Mock J J, Justice B J, Cummer S A, Pendry J B, Starr A F and Smith D R 2006 Science 314 977–980
- [3] Magnus F, Wood B, Moore J, Morrison K, Perkins G, Fyson J, Wiltshire M C K, Caplin D, Cohen L F and Pendry J B 2008 Nat. Mater. 7 295–297
- [4] Narayana S and Sato Y 2011 Adv. Mater. 24 71–74
- [5] Gömöry F, Solovyov M, Souc J, Navau C, Prat-Camps J and Sanchez A 2012 Science 335 1466–1468
- [6] Chen W, Rylyakov A V, Patel V, Lukens J E and Likharev K K 1999 IEEE Trans. Appl. Supercond. 9 3212–3215
- [7] Goldacker W, Nast R, Kotzyba G, Schlachter S I, Frank A, Ringsdorf B, Schmidt C and Komarek P 2006 J. Phys.: Conf. Ser. 43 901–904
- [8] Nii M, Amemiya N and Nakamura T 2012 Supercond. Sci. Technol. 25 095011
- [9] Bean C 1962 Phys. Rev. Lett. 8 250–253
- [10] Swartz P S 1968 J. Appl. Phys. 39 4991–4998
- [11] Duran C A, Gammel P L, Wolfe R, Fratello V J, Bishop D J, Rice J P and Ginsberg D M 1992 Nature 357 474–477
- [12] Bellis R H and Iwasa Y 1994 Cryogenics 34 129–144
- [13] Olson C J, Reichhardt C, Groth J, Field S B and Nori F 1997 Physica C 290 89–97
- [14] Denisov D V, Rakhmanov A L, Shantsev D V, Galperin Y M and Johansen T H 2006 Phys. Rev. B 73 014512
- [15] Colauto F, Patiño E J, Aprilli M and Ortiz W A 2009 J. Phys.: Conf. Ser. 150 052038
- [16] Mawatari Y 1996 Phys. Rev. B 54 13215–13221
- [17] Mawatari Y, Navau C and Sanchez A 2012 Phys. Rev. B 85 134524
- [18] Nagasawa S, Hinode K, Satoh T, Akaike H, Kitagawa Y and Hidaka M 2004 Physica C 412-414 1429–1436
- [19] Satoh T, Hinode K, Akaike H, Nagasawa S, Kitagawa Y and Hidaka M 2005 IEEE Trans. Appl. Supercond. 15 78–81
- [20] Polyanskii A A, Vlasko-Vlasov V K, Indenbom M V and Nikitenko V I 1989 Sov. Tech. Phys. Lett. 15 872
- [21] Dorosinskii L A, Indenbom M V, Nikitenko V I, Ossip’yan Y A, Polyanskii A A and Vlasko-Vlasov V K 1992 Physica C 203 149–156
- [22] Soibel A, Zeldov E, Rappaport M, Myasoedov Y, Tamegai T, Ooi S, Konczykowski M and Geshkenbein V 2000 Nature 406 282–287
- [23] Goa P E, Hauglin H, Baziljevich M, Il’yashenko E, Gammel P L and Johansen T H 2001 Supercond. Sci. Technol. 14 729–731
- [24] Yasugaki M, Itaka K, Tokunaga M, Kameda N and Tamegai T 2002 Phys. Rev. B 65 212502
- [25] Tsuchiya Y, Nakajima Y and Tamegai T 2010 Physica C 470 1123–1125
- [26] Altshuler E and Johansen T 2004 Rev. Mod. Phys. 76 471–787
- [27] Vestgarden J I, Shantsev D V, Galperin Y M and Johansen T H 2013 Supercond. Sci. Technol. 26 055012
- [28] Prozorov R, Shantsev D and Mints R 2006 Phys. Rev. B 74 220511
- [29] Altshuler E, Johansen T H, Paltiel Y, Jin P, Bassler K E, Ramos O, Chen Q Y, Reiter G F, Zeldov E and Chu C W 2004 Phys. Rev. B 70 140505
- [30] Denisov D, Shantsev D, Galperin Y, Choi E M, Lee H S, Lee S I, Bobyl A, Goa P, Olsen A and Johansen T 2006 Phys. Rev. Lett. 97 077002
- [31] Leiderer P, Boneberg J, Brüll P, Bujok V and Herminghaus S 1993 Phys. Rev. Lett. 71 2646–2649
- [32] Yurchenko V V, Shantsev D V, Johansen T H, Nevala M R, Maasilta I J, Senapati K and Budhani R C 2007 Phys. Rev. B 76 092504
- [33] Colauto F, Patiño E J, Blamire M G and Ortiz W A 2008 Supercond. Sci. Technol. 21 045018
- [34] Nowak E R, Taylor O W, Liu L, Jaeger H M and Selinder T I 1997 Phys. Rev. B 55 11702
- [35] Behnia K, Capan C, Mailly D and Etienne B 2000 Phys. Rev. B 61 3815–3818
- [36] Johansen T H, Baziljevich M, Shantsev D V, Goa P E, Kang W N, Kim H J, Choi E M, Kim M S and Lee S I 2002 Europhys. Lett. 59 599
- [37] Gubin A I, Vitusevich S A, Siegel M and Klein N 2005 Phys. Rev. B 72 064503
- [38] Sherrill M D and Lindstrom W A 1975 Phys. Rev. B 11 1125–1130
- [39] Campbell A M 2007 Supercond. Sci. Technol. 20 292–295