Lamellar and inverse micellar structures of skin lipids: Effect of templating
Abstract
The outermost layer of skin comprises rigid non-viable cells (corneocytes) in a layered lipid matrix. Using atomistic simulations we find that the equilibrium phase of the skin lipids is inverse micellar. A model of the corneocyte is used to demonstrate that lamellar layering is induced by the patterned corneocyte wall. The inverse micellar phase is consistent with in vivo observations in regions where corneocyte walls are well separated (lacunar spaces) and in the inner layers of skin, and suggests a functional role in the lipid synthesis pathway in vivo.
pacs:
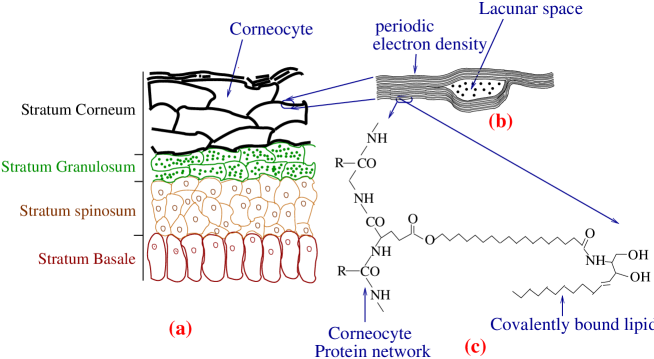
87.16.D- 87.10.Tf 61.30.PqIntroduction: The outermost layer of skin, the stratum corneum (SC), comprises non-viable rigid cells (mainly keratin filled corneocytes) in a lipid matrix (Fig. 1a). The continuous lipid matrix is responsible for the extraordinary barrier property of skin and is the first line of defence against invasion of foreign pathogens Elias (2005). The integrity of the lipid matrix is essential for proper functioning of skin, and an understanding of its structures will help in the design of agents to rejuvenate damaged lipid layers and selectively perturb the lipid structure to temporarily and reversibly increase the permeability for trans-dermal drug delivery Prausnitz et al. (2004).
The SC matrix is conspicuous by the absence of lipids with polar head groups and by having large molecular polydispersity. The earliest models introduced a coarse picture of “bricks” (corneocyte) surrounded by “mortar” (lipid) Michaels et al. (1975). Later in vivo observations Breathnach et al. (1973); White et al. (1988); Boustra et al. (1991); Al-Amoudi et al. (2005), and experiments with reconstituted SC lipid layers Groen et al. (2008); Schr oter et al. (2009), showed a multilamellar arrangement of lipids. Scattering experiments White et al. (1988); Boustra et al. (1991); Schr oter et al. (2009) and cryo-EM Breathnach et al. (1973); Al-Amoudi et al. (2005) images yielded a large number of apparently contradictory results: lipids in gel-like Norlén (2001) or fluid phases Bommannan et al. (1990), one Al-Amoudi et al. (2005) or two Boustra et al. (1991) periodicities (in a multilayer arrangement), and signatures of different crystalline arrangements Pilgram et al. (1999). Existing models Swartzendruber et al. (1989); Bouwstra et al. (1998); Forslind (1994); Hill and Wertz (2003); McIntosh (2003); Iwai et al. (2012) have described some of these features by including specific lipids in particular positions of essentially a periodic crystalline arrangement. However, skin employs more than 300 different lipid molecules, and the relative concentrations of the different components vary widely (more than 100% between individuals and across the body sites of the same individual Norlén et al. (1999)) without affecting the normal skin function. A periodic fixed molecular arrangement is unlikely to accommodate such large variations in composition, or explain the low but finite permeability for small molecules Bartek et al. (1972), the pliability of healthy skin in accommodating deformation from mechanical and hydration stresses Wu et al. (2006), or the activity of colocalised antimicrobial peptides and proteases Aberg et al. (2007).
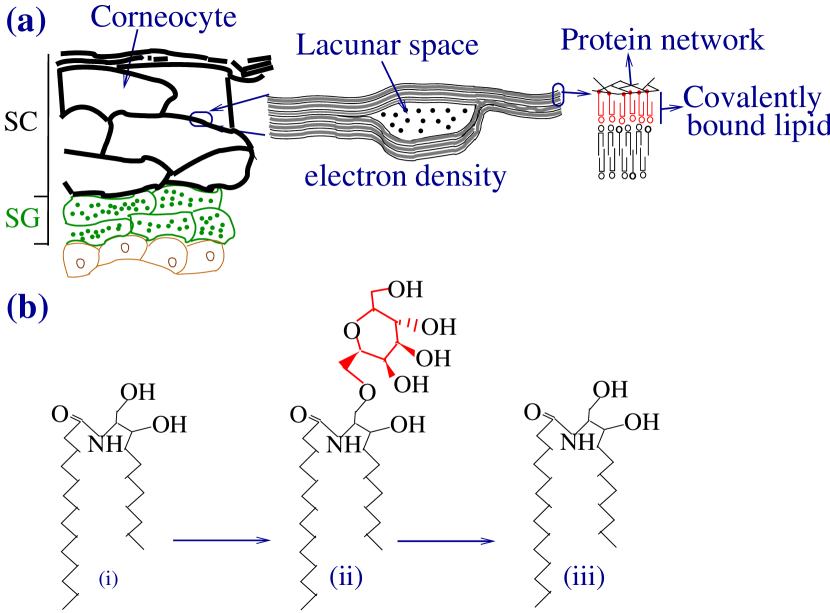
Ceramide sphingolipids (CER) constitute of SC lipids Weerheim and Ponec (2001); Farwanah et al. (2005). CER is synthesised in the stratum granulosum (SG), a layer below the SC Mizutani et al. (2009). Immediately after synthesis a sugar moiety is attached to the head group of the CER (fig. 1b) and the resulting galactoceramides are secreted by endocytosis. Enzymes in the extra-cellular space remove the sugar group to revert the molecules back to CER Mizutani et al. (2009). In response to removing the SC lipids by chemical insult, cells in the SG release lipid vesicles within minutes Menon et al. (1992), but the permeability barrier recovers only after a few days Grubauer et al. (1989). The seemingly unnecessary step of attaching and removing a head group, and the large separation of time-scale between lipid release and barrier recovery, remain unexplained.
Previous molecular simulations of SC lipids have been limited to selected lipid components in pre-formed hydrated bilayers without realistic polydispersity Höltje et al. (2001); Pandit and Scott (2006); Notman et al. (2007); Das et al. (2009, 2010); Hoopes et al. (2011); Engelbrecht et al. (2011). Here we report results from large scale molecular dynamics simulations ( united atoms and s time scales) of SC lipids with realistic polydispersity. The main findings are: (i) Randomly oriented initial conditions lead to an inverse-micellar arrangement in 30 wt% water. (ii) This structure is not just kinetically trapped, since an initial lamellar phase structure transforms to an inverted phase in simulation time-scales. (iii) A weak multilamellar arrangement develops when the lipid molecules are confined between two walls that mimic the corneocyte-bound lipid envelope. These results are consistent with existing in-vivo and in-vitro observations on the SC lipid arrangments, and can shed light on the relevance of the temporary addition of a head group in ceramide biosynthesis and the reason for separation of lipid-release and barrier-recovery timescales.
Simulations: The three main lipid components of the SC are CER, free fatty acids (FFA), and cholesterol (CHOL) Weerheim and Ponec (2001); Farwanah et al. (2005). By changing the numbers and positions of the hydroxy groups in the sphingosine motif, nature uses 11 different families of CER molecules - each having large polydispersity in the tail lengths sup . FFA molecules also show similar polydispersity in the tail lengths. We use the GROMACS molecular dynamics package Berendsen et al. (1995) with the ‘Berger’ force-field Chiu et al. (1995); Berger et al. (1997) for the lipids and the SPC model for the water molecules. To probe the bulk arrangement, for the 1:1:1 composition (molar ratio of CER, CHOL and FFA), we use 2000 CER, 2000 CHOL and 2000 FFA molecules and 50000 water molecules (3.7106 united atoms). We use three members of the ceramide family (CER NS, CER NP and CER EOS Fig.2), with the experimentally observed tail length polydispersity, and thus 15 different CER molecules. The molar fractions of these three families were increased to account for the CER molecules of similar structure not explicitly considered in the simulations. Simulation details are included in the online supplementary material sup .
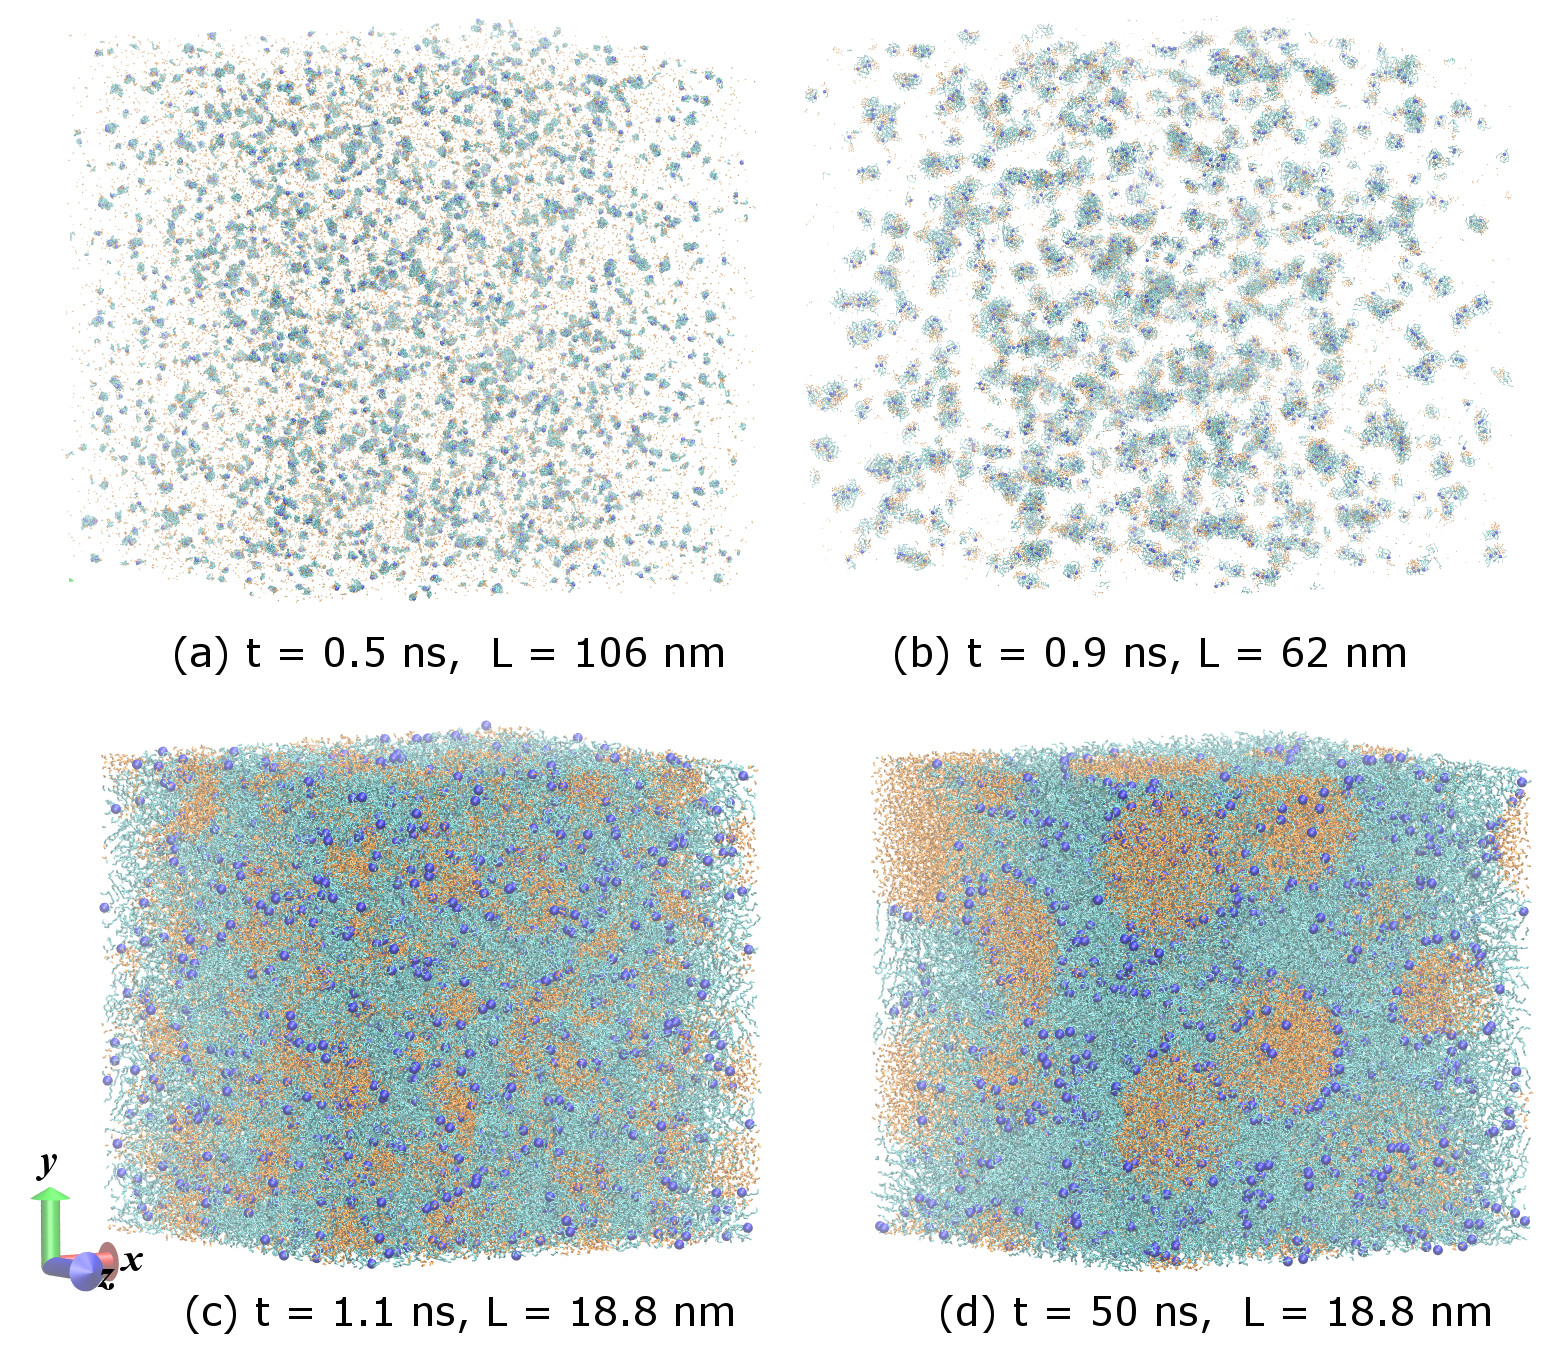
Hydrated bulk SC lipids - inverse micelles: To probe the bulk structure of the SC lipids in 30 wt.% water (approximate water content in the outer SC Warner et al. (1988), though much of this water remains inside corneocytes Bouwstra et al. (2003)) with the least amount of bias, we place randomly oriented lipid and water molecules at random positions in a large simulation box. The imposed atmospheric pressure compresses this ‘gas’ until most of the water molecules aggregate into a few large and roughly spherical clusters, leading to an inverse-micellar phase (Fig. 3). We used three different initial conditions each for 1:1:1 and 2:2:1 composition ratios of CER, CHOL and FFA molecules. In all cases the system acquired an inverse micellar phase sup .
In one of the 2:2:1 systems we prepared the initial simulation box with the -dimension much smaller than the lateral dimensions. After the isotropic compression to atmospheric pressure, but before the water molecules formed isolated clusters, we used different imposed pressures along the -direction (1 bar) and the lateral directions (1000 bar). The resulting flow aligns the lipid tails preferentially along the -direction. Once the box becomes roughly cubic, we switched back to an isotropic pressure coupling. The final structure, once again, is an inverse micellar arrangement with the lipid tails isotropically distributed. This shows that liquid-crystalline ordering of the lipid molecules alone is not strong enough to sustain a lamellar arrangement.
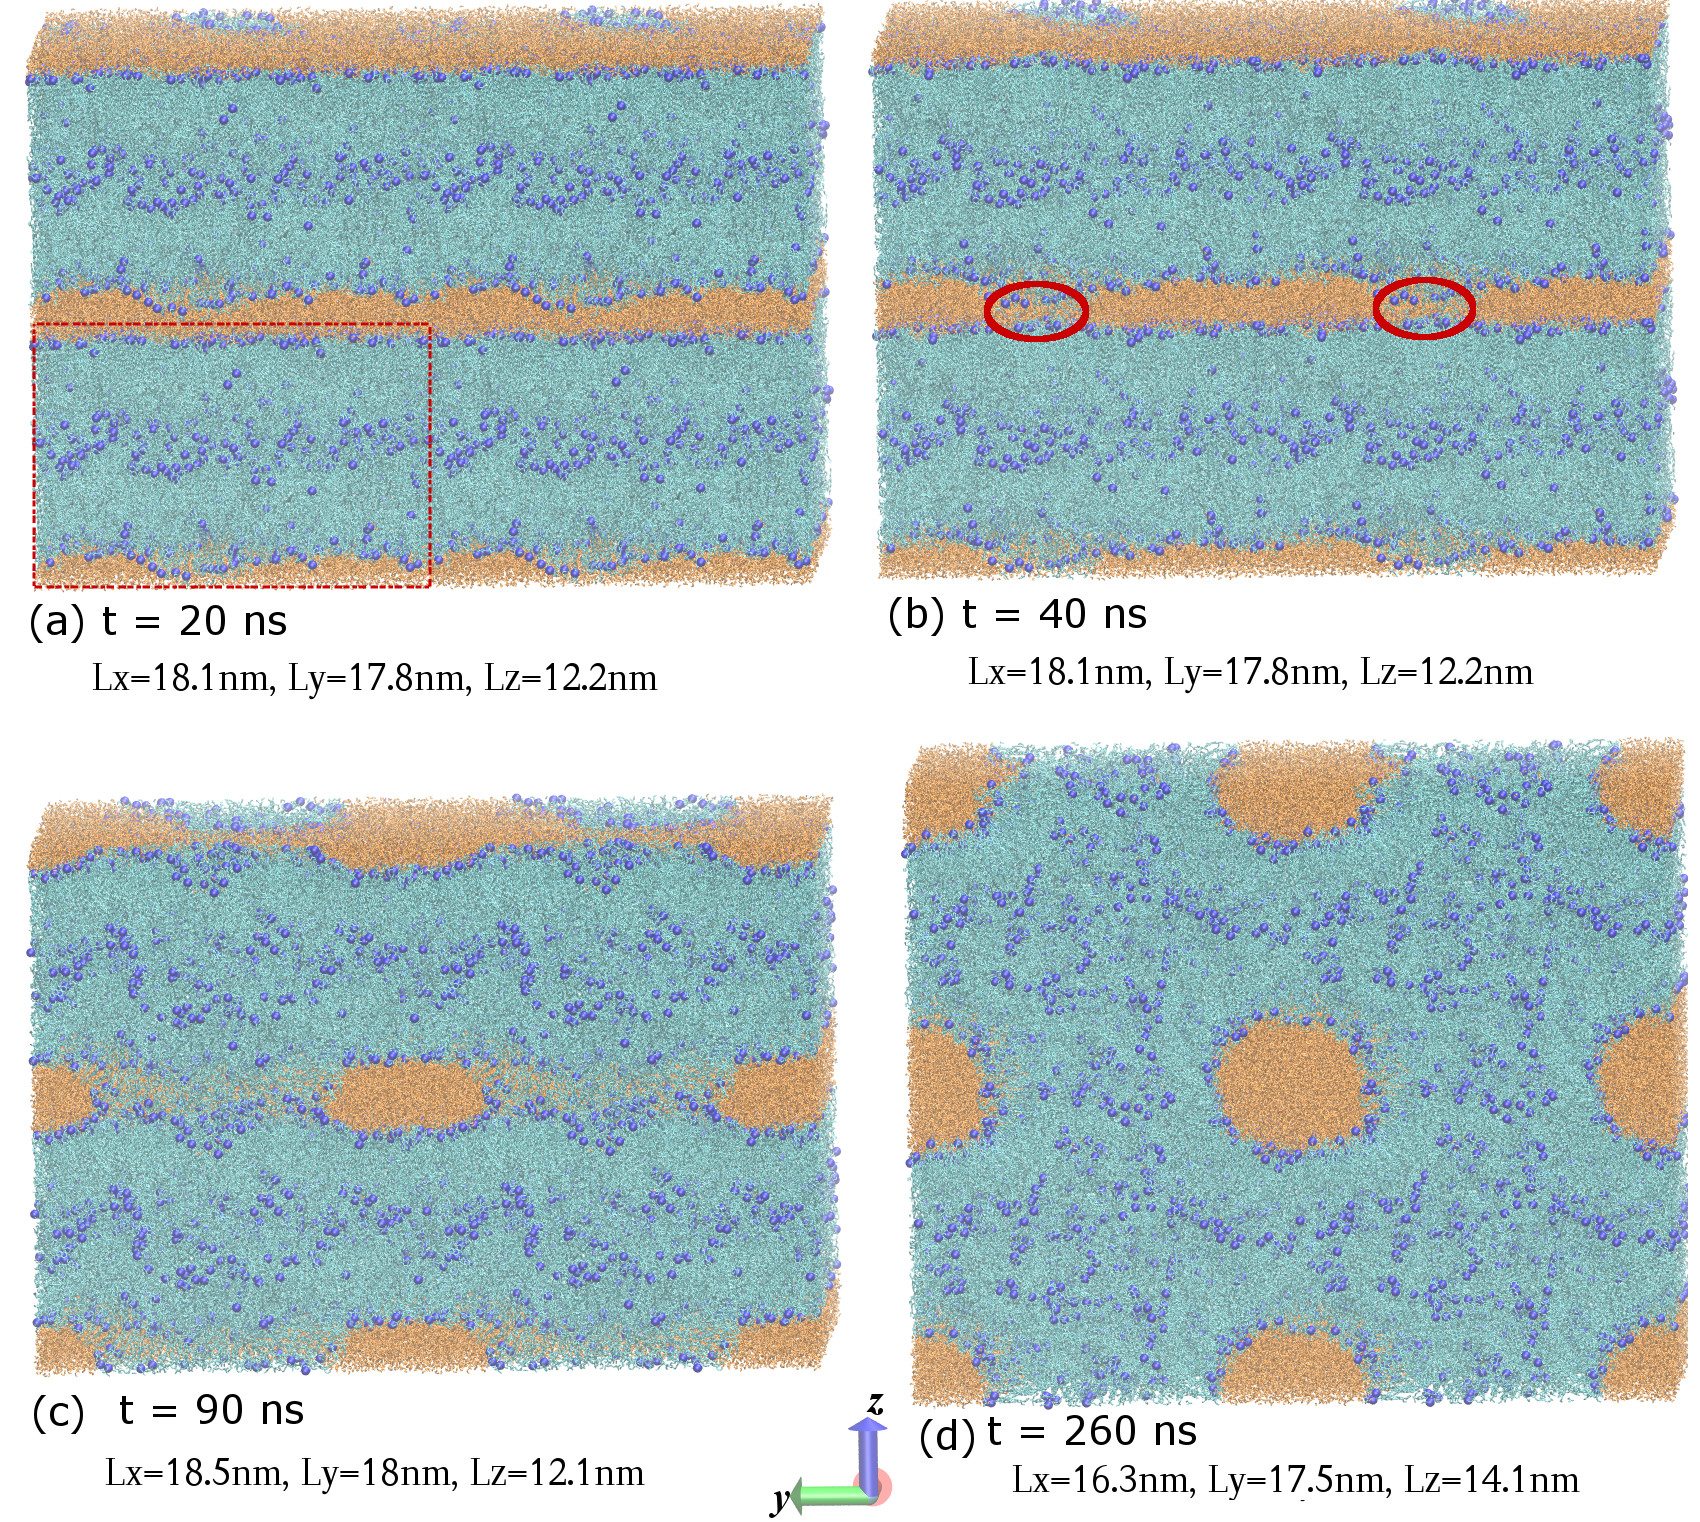
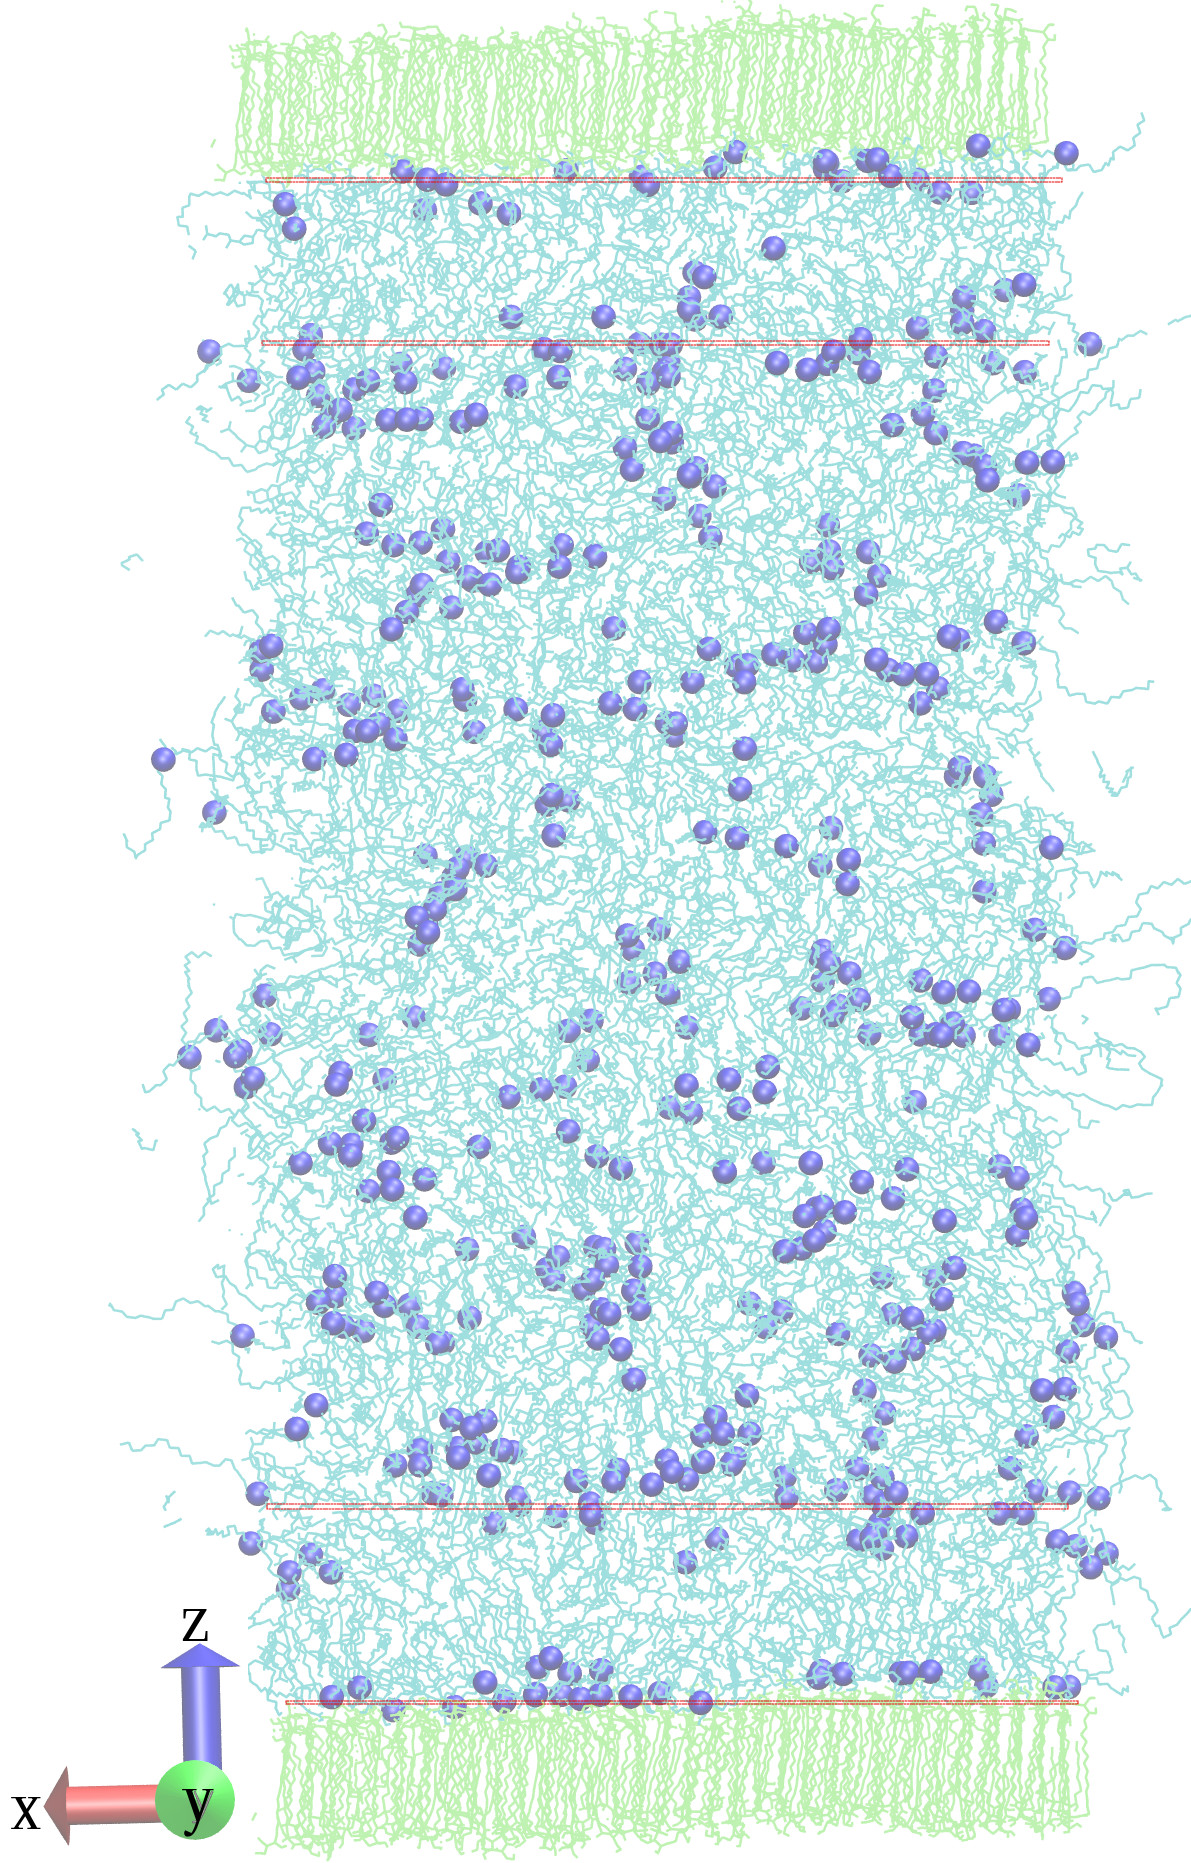
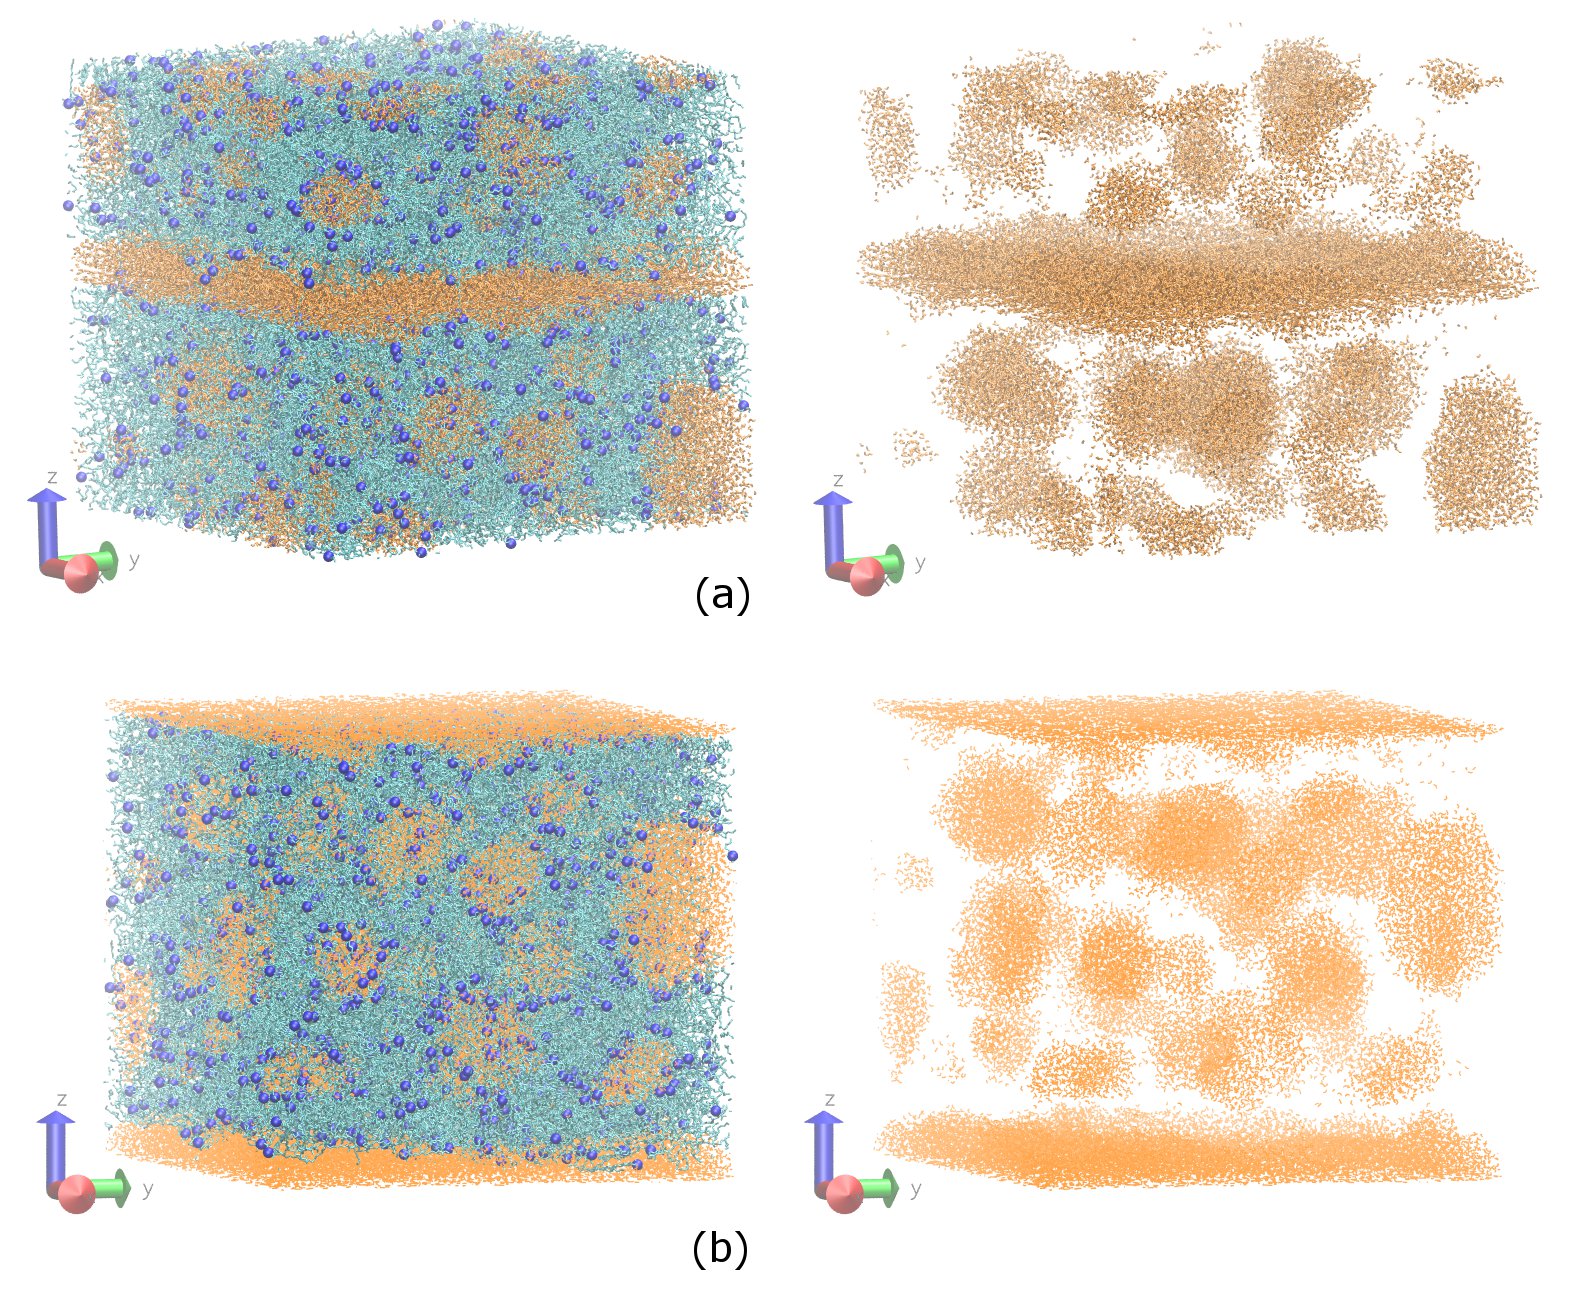
To further probe whether or not the inverse micellar phase is due to the preparation process, we created a dry double bilayer (1:1:1 composition). After equilibration with a continuous water wall along the -direction, the continuous water wall was replaced by a thin layer of water () and standard periodic boundary conditions were used in all three directions. When, by natural fluctuation, a few of the lipid molecules in the outer leaflet of the top bilayer come in contact with the outer leaflet of the bottom bilayer across the thin water layer (via periodic boundary conditions), the head-head contact area increases irreversibly, creating columns of water separated by the lipid corona (Fig. 4). The lipids retain a bilayer topology, with a cylindrical water column surrounded by bilayers instead of the usual monolayers.
A small fully hydrated bilayer of SC lipids is indefinitely stable in simulations. The local stress tensor across such a bilayer contains information about the spontaneous curvature favoured by the molecules Seddon (1990). Using local pressure tensor data from a 2:2:1 bilayer simulation, we find the spontaneous curvature for (half of) the bilayer as sup . The sign of the curvature points towards equilibrium inverse phases and the magnitude is similar to the length-scale of the observed checkerboard pattern at the SC-SG boundary in cryo-EM Al-Amoudi et al. (2005).
Imposed layering near corneocyte: The corneocytes are surrounded by an envelope of grafted ceramide molecules whose fatty acid end is believed to be covalently bonded to the protein network in the corneocyte Swartzendruber et al. (1987) (Fig. 1a). The highly hygroscopic corneocyte interior retains most of the water in the SC Bouwstra et al. (2003), leaving an essentially dry lipid matrix confined in the narrow space between corneocytes. The grafted ceramides in the corneocyte-bound lipid envelope (CLE) presents a patterned surface of favourable hydrogen-bond (H-bond) sites to this confined lipid matrix. By analogy with confined liquid crystals Ajdari et al. (1991) and growth of colloidal crystals over patterned substrates Hoogenboom et al. (2003), we expect that a surface with such patterning of favourable H-bonding sites will impose layering in the lipids. We model the CLE as a wall of hypothetical molecules formed by joining the two tails of a symmetric CER NS molecule with the mirror image of its head group (Fig. 5b). By construction, this molecule (termed CRW for corneocyte wall) forms a stable flat layer structure.
 (a)
(a) (b)
(b)
 (c)
(c)
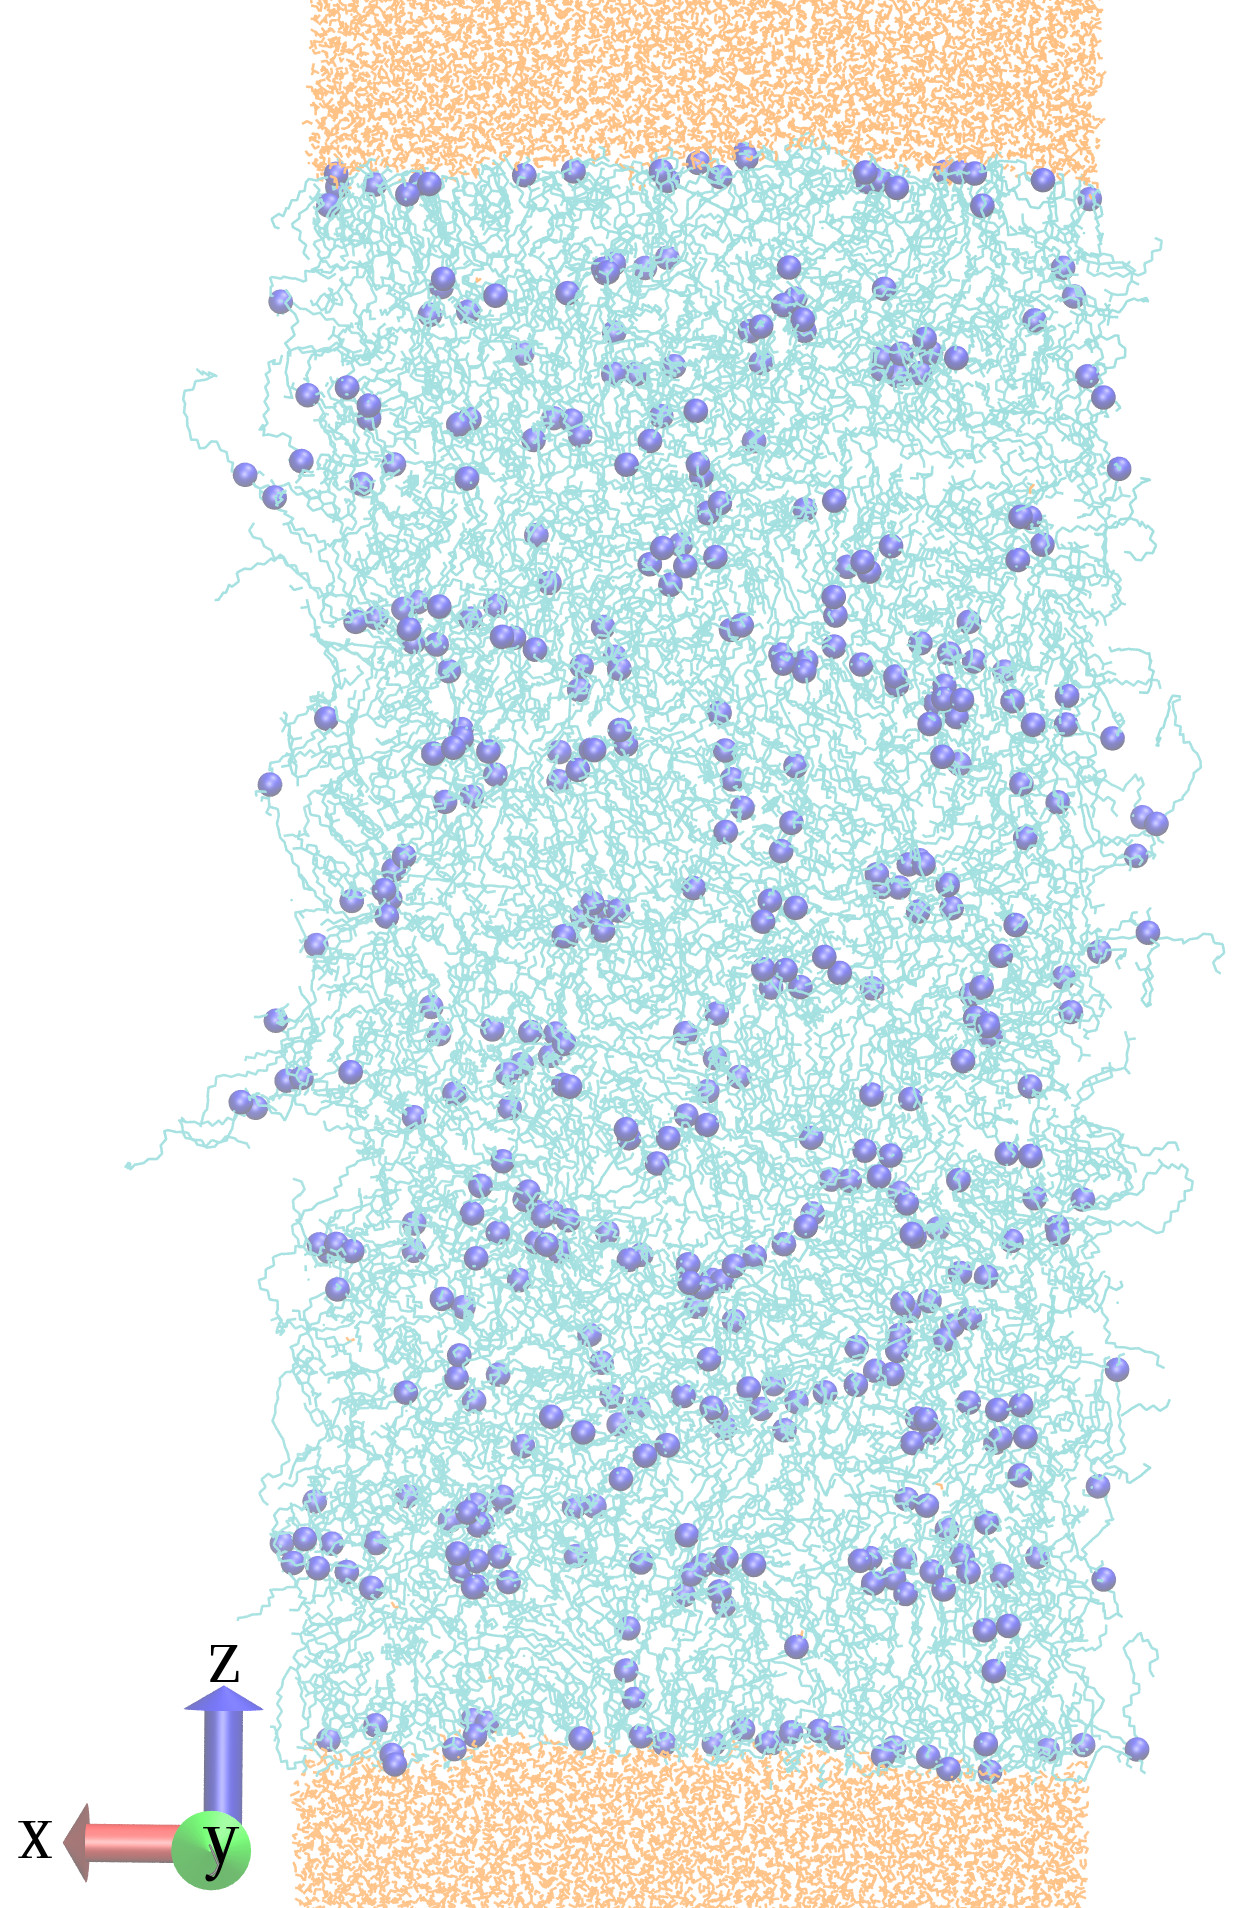
To be far from lamellar structure, we chose a final inverse-micellar phase configuration (2:2:1 lipid composition) as the starting point of this simulation. We partition the lipids along the -direction by freezing the water molecules in a narrow strip, making that region unfavourable for the lipid molecules sup . The structure away from this frozen water layer remain broadly unchanged. Next we slowly remove the water molecules, and equilibrate the lipids for 100ns between two continuous water walls. No layering developed during these steps (Fig. 5a). A layer of CRW was separately equilibrated with the number of CRW chosen to match the lateral dimension of the lipid system. The lipids were placed between the CRW walls. Fig. 5c shows the final configuration after subsequent evolution at 340K for 1s in the presence of the CRW wall. The lipid tails predominantly align perpendicular to the wall. Close to the wall, layering is near perfect and is parallel to the CRW walls. The ordering grows slowly due to low mobility of the molecules.
Discussion: These simulations show that the SC lipids form inverted micellar phases. A patterned wall mimicking the conrneocyte-bound lipid envelope induces layering in SC lipids. A continuous wall failed to induce layering, suggesting that the hydrogen-bonding with the wall molecules plays an important role in forming multilayered structures.
These simulations provide some rationale behind the synthesis pathway and the lipid structures found in the SC in vivo. The seemingly unnecessary step of adding and removing a sugar group Mizutani et al. (2009) becomes meaningful by noting that the ceramide lipids would have formed an inverse micellar phase if left without a large head group inside the cells in the SG, and thus frustrate the vesicle trafficking mechanism necessary for their release. Once the sugar group is removed, if the molecules remain in the water-rich SG-SC boundary region they can form an inverse micellar phase, leading to the granular pattern seen in cryo-EM Al-Amoudi et al. (2005). These water-containing inverted structures may play a role in the activity of anti-microbial peptides that are released along with the lipid molecules Aberg et al. (2007) and possibly are responsible for higher permeability in skin regions lacking corneocyte stacks Schätzlein and Cevc (1998). Such non-lamellar structures have also been observed in some in vitro depositions Plasencia et al. (2007). When transported into the region between corneocyte walls, the patterned surface and confinement leads to a lamellar structure. The growth of this lamellar structure is necessarily slow because of low molecular mobility in the crowded confined environment. From in vivo measurement of recovery of permeability barrier, we expect the time-scale of this patterned wall induced ordering to be of order days Grubauer et al. (1989) and the rate limiting step in the recovery process. The polydispersity stops the lipids from forming crystalline structures, thus providing some plasticity and dissipation. The polydisperse tails also lower the defect energies (as evidenced by the diffuse defect structure in fig. 4d) so that the lipids can envelope the corneocytes in three dimensions without forming strongly localised defects and thereby compromising the barrier.
Acknowledgements.
This work was supported by Yorkshire Forward through the grant YFRID Award B/302 and part financed by the European Regional Development Fund (ERDF). Computational resources were provided by SoftComp EU Network of Excellence. We gratefully acknowledge helpful comments by Patrick Warren. CD thanks Lars Norlén for useful discussions and for sharing unpublished results.References
- Elias (2005) P. M. Elias, J. Invest. Dermatol. 125, 183 (2005).
- Prausnitz et al. (2004) M. R. Prausnitz, S. Mitragotri, and R. Langer, Nat. Rev. Drug Discovery 3, 115 (2004).
- Michaels et al. (1975) A. S. Michaels, S. K. Chandrasekaran, and J. E. Shaw, AICHE J. 21, 985 (1975).
- Breathnach et al. (1973) A. Breathnach, T. Goodman, C. Stolinsky, and M. Gross, J. Anat. 114, 65 (1973).
- White et al. (1988) S. White, D. Mirejovsky, and G. King, Biochemistry 27, 3725 (1988).
- Boustra et al. (1991) J. Boustra, G. Gooris, J. van der Spek, and W. Bras, J. Invest. Derm. 97, 1005 (1991).
- Al-Amoudi et al. (2005) A. Al-Amoudi, J. Dubochet, and L. Norlén, J. Invest. Derm. 124, 764 (2005).
- Groen et al. (2008) D. Groen, G. Gooris, M. Ponec, and J. Bouwstra, BBA-Biomembranes 1778, 2421 (2008).
- Schr oter et al. (2009) A. Schr oter, D. Kessner, M. Kiselev, T. Hau, S. Dante, and R. H. Neubert, Biophys. J. 97, 1104 (2009).
- Norlén (2001) L. Norlén, J. Invest. Derm. 117, 830 (2001).
- Bommannan et al. (1990) D. Bommannan, R. O. Potts, and R. H. Guy, J. Invest. Derm. 95, 403 (1990).
- Pilgram et al. (1999) G. S. Pilgram, A. M. Engelsma-van Pelt, J. A. Bouwstra, and H. K. Koerten, J. Invest. Derm. 113, 403 (1999).
- Swartzendruber et al. (1989) D. C. Swartzendruber, P. W. Wertz, D. J. Kitko, K. C. Madison, and D. T. Downing, J. Invest. Derm. 92, 251 (1989).
- Bouwstra et al. (1998) J. Bouwstra, G. Gooris, F. Dubbelaar, A. Weerheim, A. IJzerman, and M. Ponec, J. Lipid Res. 39, 186 (1998).
- Forslind (1994) B. Forslind, Acta Dermato Venerol 74, 1 (1994).
- Hill and Wertz (2003) J. Hill and P. Wertz, Biochim. Biophys. Acta - Biomembranes 1616, 121 (2003).
- McIntosh (2003) T. J. McIntosh, Biophys. J. 85, 1675 (2003).
- Iwai et al. (2012) I. Iwai, H. Han, L. den Hollander, S. Svensson, L. Öfverstedt, J. Anwar, J. Brewer, M. Bloksgaard, A. Laloeuf, D. Nosek, S. Masich, L. Bagatolli, U. Skoglund, and L. Norlén, J. Invest. Derm. 132, 2215 (2012).
- Norlén et al. (1999) L. Norlén, I. Nicander, B. L. Rozell, S. Ollmar, and B. Forslind, J. Invest. Derm. 112, 72 (1999).
- Bartek et al. (1972) M. Bartek, J. Labudde, and H. Maibach, J. Invest. Derm. 58, 114 (1972).
- Wu et al. (2006) K. S. Wu, W. W. van Osdol, and R. H. Dauskardt, Biomaterials 27, 785 (2006).
- Aberg et al. (2007) K. Aberg, M.-Q. Man, R. Gallo, T. Ganz, D. Crumrine, B. Brown, E.-H. Choi, D.-K. Kim, J. Schröder, K. Feingold, and P. Elias, J. Invest. Derm. 128, 917 (2007).
- Mizutani et al. (2009) Y. Mizutani, S. Mitsutake, K. Tsuji, A. Kihara, and Y. Igarashi, Biochimie 91, 784 (2009).
- Weerheim and Ponec (2001) A. Weerheim and M. Ponec, Arch. Derm. Res. 293, 191 (2001).
- Farwanah et al. (2005) H. Farwanah, J. Wohlrab, R. H. H. Neubert, and K. Raith, Anal. Bioanal. Chem. 383, 632 (2005).
- Menon et al. (1992) G. K. Menon, K. R. Feingold, and P. M. Elias, J. Invest. Derm. 98, 279 (1992).
- Grubauer et al. (1989) G. Grubauer, P. Elias, and K. Feingold, J. Lipid Res. 30, 323 (1989).
- Höltje et al. (2001) M. Höltje, T. Förster, B. Brandt, T. Engels, W. von Rybinski, and H.-D. Höltje, Biochim. Biophys. Acta 1511, 156 (2001).
- Pandit and Scott (2006) S. A. Pandit and H. L. Scott, J. Chem. Phys. 124, 014708 (2006).
- Notman et al. (2007) R. Notman, W. K. den Otter, M. G. Noro, W. J. Briels, and J. Anwar, Biophys. J. 93, 2056 (2007).
- Das et al. (2009) C. Das, M. G. Noro, and P. D. Olmsted, Biophys. J. 97, 1941 (2009).
- Das et al. (2010) C. Das, P. D. Olmsted, and M. G. Noro, SoftMatter 5, 4549 (2010).
- Hoopes et al. (2011) M. I. Hoopes, M. G. Noro, M. L. Longo, and R. Faller, J. Phys. Chem. B 115, 3164 (2011).
- Engelbrecht et al. (2011) T. Engelbrecht, T. Hauß, K. Süß, A. Vogel, M. Roark, S. Feller, R. Neubert, and B. Dobner, Soft Matter 7, 8998 (2011).
- (35) Supplementary online material contains an introduction to the skin lipids, simulation details, and additional results. Animations of the trajectories of Fig. 3 and Fig. 4 are at http://goo.gl/qqMzrE .
- Berendsen et al. (1995) H. J. C. Berendsen, D. van der Spoel, and R. van Drunen, Comp. Phys. Comm. 91, 43 (1995).
- Chiu et al. (1995) S. Chiu, M. Clark, V. Balaji, S. Subramaniam, H. Scott, and E. Jackobsson, Biophys. J. 69, 1230 (1995).
- Berger et al. (1997) O. Berger, O. Edholm, and F. Jähnig, Biophys. J. 72, 2002 (1997).
- Warner et al. (1988) R. Warner, M. Myers, and D. Taylor, J. Invest. Dermatol. 90, 218 (1988).
- Bouwstra et al. (2003) J. A. Bouwstra, A. de Graaff, G. S. Gooris, J. Nijsse, J. W. Wiechers, and A. C. van Aelst, J. Invest. Derm. 120, 750 (2003).
- Seddon (1990) J. M. Seddon, Biochim. Biophys. Acta 1031, 1 (1990).
- Swartzendruber et al. (1987) D. Swartzendruber, P. Wertz, K. Madison, and D. Downing, J. Invest. Derm. 88, 709 (1987).
- Ajdari et al. (1991) A. Ajdari, L. Peliti, and J. Prost, Phys. Rev. Lett. 66, 1481 (1991).
- Hoogenboom et al. (2003) J. P. Hoogenboom, A. K. van Langen-Suurling, J. Romijn, and A. van Blaaderen, Phys. Rev. Lett. 90, 138301 (2003).
- Schätzlein and Cevc (1998) A. Schätzlein and G. Cevc, British Journal of Dermatology 138, 583 (1998).
- Plasencia et al. (2007) I. Plasencia, L. Norlén, and L. A. Bagatolli, Biophys. J. 93, 3142 (2007).
Supplementary material:
Lamellar and inverse micellar structures of skin lipids: Effect of templating
Chinmay Das, Massimo G. Noro and Peter D. Olmsted
S1 Stratum Corneum lipid molecules
Epidermis, the outer layer of the skin, has a stratified organization and is named according to the visual appearance under optical microscope (Fig. S1.a). The stratum corneum (SC) is the outermost layer of the epidermis, comprising dead pancake-like flattened cells (corneocytes) in a lipid matrix. Keratinocytes, the dominant cell type in the stratum basale, the innermost layer of epidermis, migrate through the intervening layers while changing in shape and content. In the stratum granulosum, immediately below the SC, keratinocytes over-produce keratin and secrete specialized lipids. By the time keratinocytes migrate to SC, the neuclei and other internal organelles disintegrate and the cell attains a comparatively rigid structure through keratin network. The dead keratinocytes are called corneocytes. The lipid matrix in the SC provides the main barrier against water loss and invasion of foreign pathogens [1].
The lipid matrix in the extracellular space of the corneocytes shows a multilamellar structure in electron microscopy (Fig. S1.b) [2]. This multilamellar structure is often punctuated by lacunar spaces where the periodic structure in electron density is lost. The lipids adjacent to the corenocytes are covalently bound to the protein network of the corneocytes forming the corneocyte-bound lipid envelope (CLE) (Fig. S1.c), which shows up as electron-dense regions in electron microscopy.
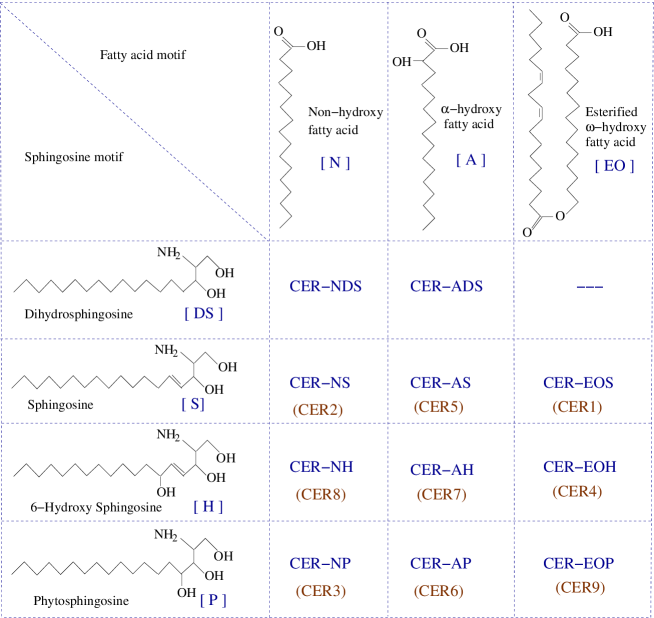
The main components of the SC lipid matrix are the ceramide sphingolipids (CER), cholesterol (CHOL) and free fatty acid (FFA). There are 11 families of CER molecules found in the SC (Fig. S2), differing by the numbers and the positions of the hydroxyl groups. Each member of these CER families shows additional polydispersity in the number of carbons in the fatty acid tail motif, leading to more than 300 different CER molecules [6]. We refer to the molecules by their family names followed by the number of carbon atoms in the fatty acid motif. Thus, CER NS 24 refers to CER NS with lignoceric acid as the fatty acid motif. Similarly the different FFA molecules are distinguished by the number of carbon atoms. In the literature, ceramide familes often are distinguished by the order of their appearance in the chromatograph: CER EOS is often refereed to as ceramide 1, CER NS as ceramide 2 and CER NP as ceramide 3.
S2 Simulation Details
All simulations were carried out with the molecular dynamics software GROMACS [7,8] with Nosé-Hoover thermostats separately coupled to the lipid molecules and the water molecules, and with a Parrinello-Rahman barostat. Bond lengths were constrained with the LINCS algorithm for the lipid molecules and with the SETTLE algorithm for water molecules. The time steps for MD simulations were 2 fs.
We used the ‘Berger’ force-field [9] for the lipid molecules, which accurately reproduces experimental results for different lipid systems [10]. We have used the same force-field in the past for simulations of a smaller subset of SC lipid molecules for studying small fully hydrated bilayers and water permeation [11,12]. Water is modeled with the SPC potential [13]. The partial charges used are shown in Fig.S3.
We use a group-based cut-off with the cut-off length for both the van der Waals and electrostatic interactions. In our previous simulations [11], we have explicitly compared simulations involving a group-based cut-off with particle-mesh Ewald summation (PME) simulations. The effect of the long range electrostatics was found to be negligible. In simulations of lipid bilayers, long range electrostatics often plays an important role. The reasons for the negligible contribution of long range electrostatics in our simulations are two-fold: Firstly, the SC lipids are uncharged at skin pH, with only small partial charges contributing to the electrostatic interaction. Thus, the dipole moments involved are about times smaller than the typical phospholipid dipole created from well separated N- and P+ charges. Secondly phospholipid dipoles have a component normal to the water-lipid interface, which can give rise to a macroscopic dipole moment. By contrast, the small dipoles from the partial charges in the SC lipid system, even in a bilayer arrangement, orient themselves in random directions. Thus, the effect of the electrostatic interaction beyond the cut-off becomes much smaller than the thermal energy.
| molecule | fatty acid tail | Number of molecules | ||
|---|---|---|---|---|
| family | (number of carbons) | setA | set B | set C |
| CER EOS | 30 | 30 | 30 | 20 |
| 32 | 80 | 80 | 52 | |
| 33 | 30 | 30 | 20 | |
| 34 | 60 | 60 | 40 | |
| CER NS | 22 | 100 | 100 | 68 |
| 24 | 200 | 200 | 132 | |
| 25 | 100 | 100 | 68 | |
| 26 | 300 | 300 | 200 | |
| 28 | 200 | 200 | 132 | |
| 30 | 100 | 100 | 68 | |
| CER NP | 24 | 80 | 80 | 52 |
| 26 | 136 | 136 | 92 | |
| 28 | 208 | 208 | 140 | |
| 30 | 240 | 240 | 160 | |
| 32 | 136 | 136 | 92 | |
| FFA | 20 | 100 | 50 | 64 |
| 22 | 200 | 100 | 136 | |
| 24 | 800 | 400 | 536 | |
| 25 | 200 | 100 | 136 | |
| 26 | 460 | 230 | 304 | |
| 28 | 200 | 100 | 136 | |
| 30 | 40 | 20 | 24 | |
| CHOL | – | 2000 | 2000 | 1332 |
| SOL | – | 50000 | 43600 | 20000 |
| Molar ratio | 1:1:1 | 2:2:1 | 1:1:1 | |
| CER:CHOL:FFA | ||||
Table S1 gives the number of molecules used in the different simulations. Guided by the mass-spectroscopic profiles for the ceramides [14,15], we choose a fixed molar ratio 1:5:4 for the CER EOS : CER NS : CER NP. In doing so, we assume that the ceramides with esterified -hydroxy fatty acids (CER EOS, CER EOH and CER EOP) behave similarly and CER EOS alone represents all three of these families in our simulations. Similarly, ceramides that do not have such esterified fatty acid and have a double bond in the sphingosine motif are represented by CER NS. CER NP accounts for rest of the ceramides (all of which do not have double bonds in the sphingosine motif). Set A and set C consider CER, CHOL and FFA in 1:1:1 molar ratio. Set B considers a molar ratio of CER : CHOL : FFA = 2:2:1. Set A and set B contains 30 wt% water. In both of these two sets (A and B), three separate simulations were performed with different initial conditions, which we will distinguish as set Aa, set Ab and so on. Set C was used to look at the stability of pre-formed multilayer arrangements (Details follow in S2.4).
S2.1 Inverse micellar phase
Configurations with a single molecule of each of the lipid species were energy minimized in vacuum separately. For the simulations in sets A and B, a large simulation box was divided into small grids with dimensions large enough to accommodate the longest lipid species. The desired number of energy-minimized lipid molecules were placed with random orientations in randomly selected unoccupied grid points. We maintain a finer grid which notes occupied sites by individual lipid atoms. The required number of water molecules were placed with random orientations at randomly chosen unoccupied sites of the fine grid.
The configurations were energy minimized and evolved with NPT MD steps using a Nose-Hoover thermostat and a Parrinello-Rahman barostat for at 340 K. Standard periodic boundary conditions in a cubic simulation box and isotropic pressure coupling were used in all cases except for set Bc.
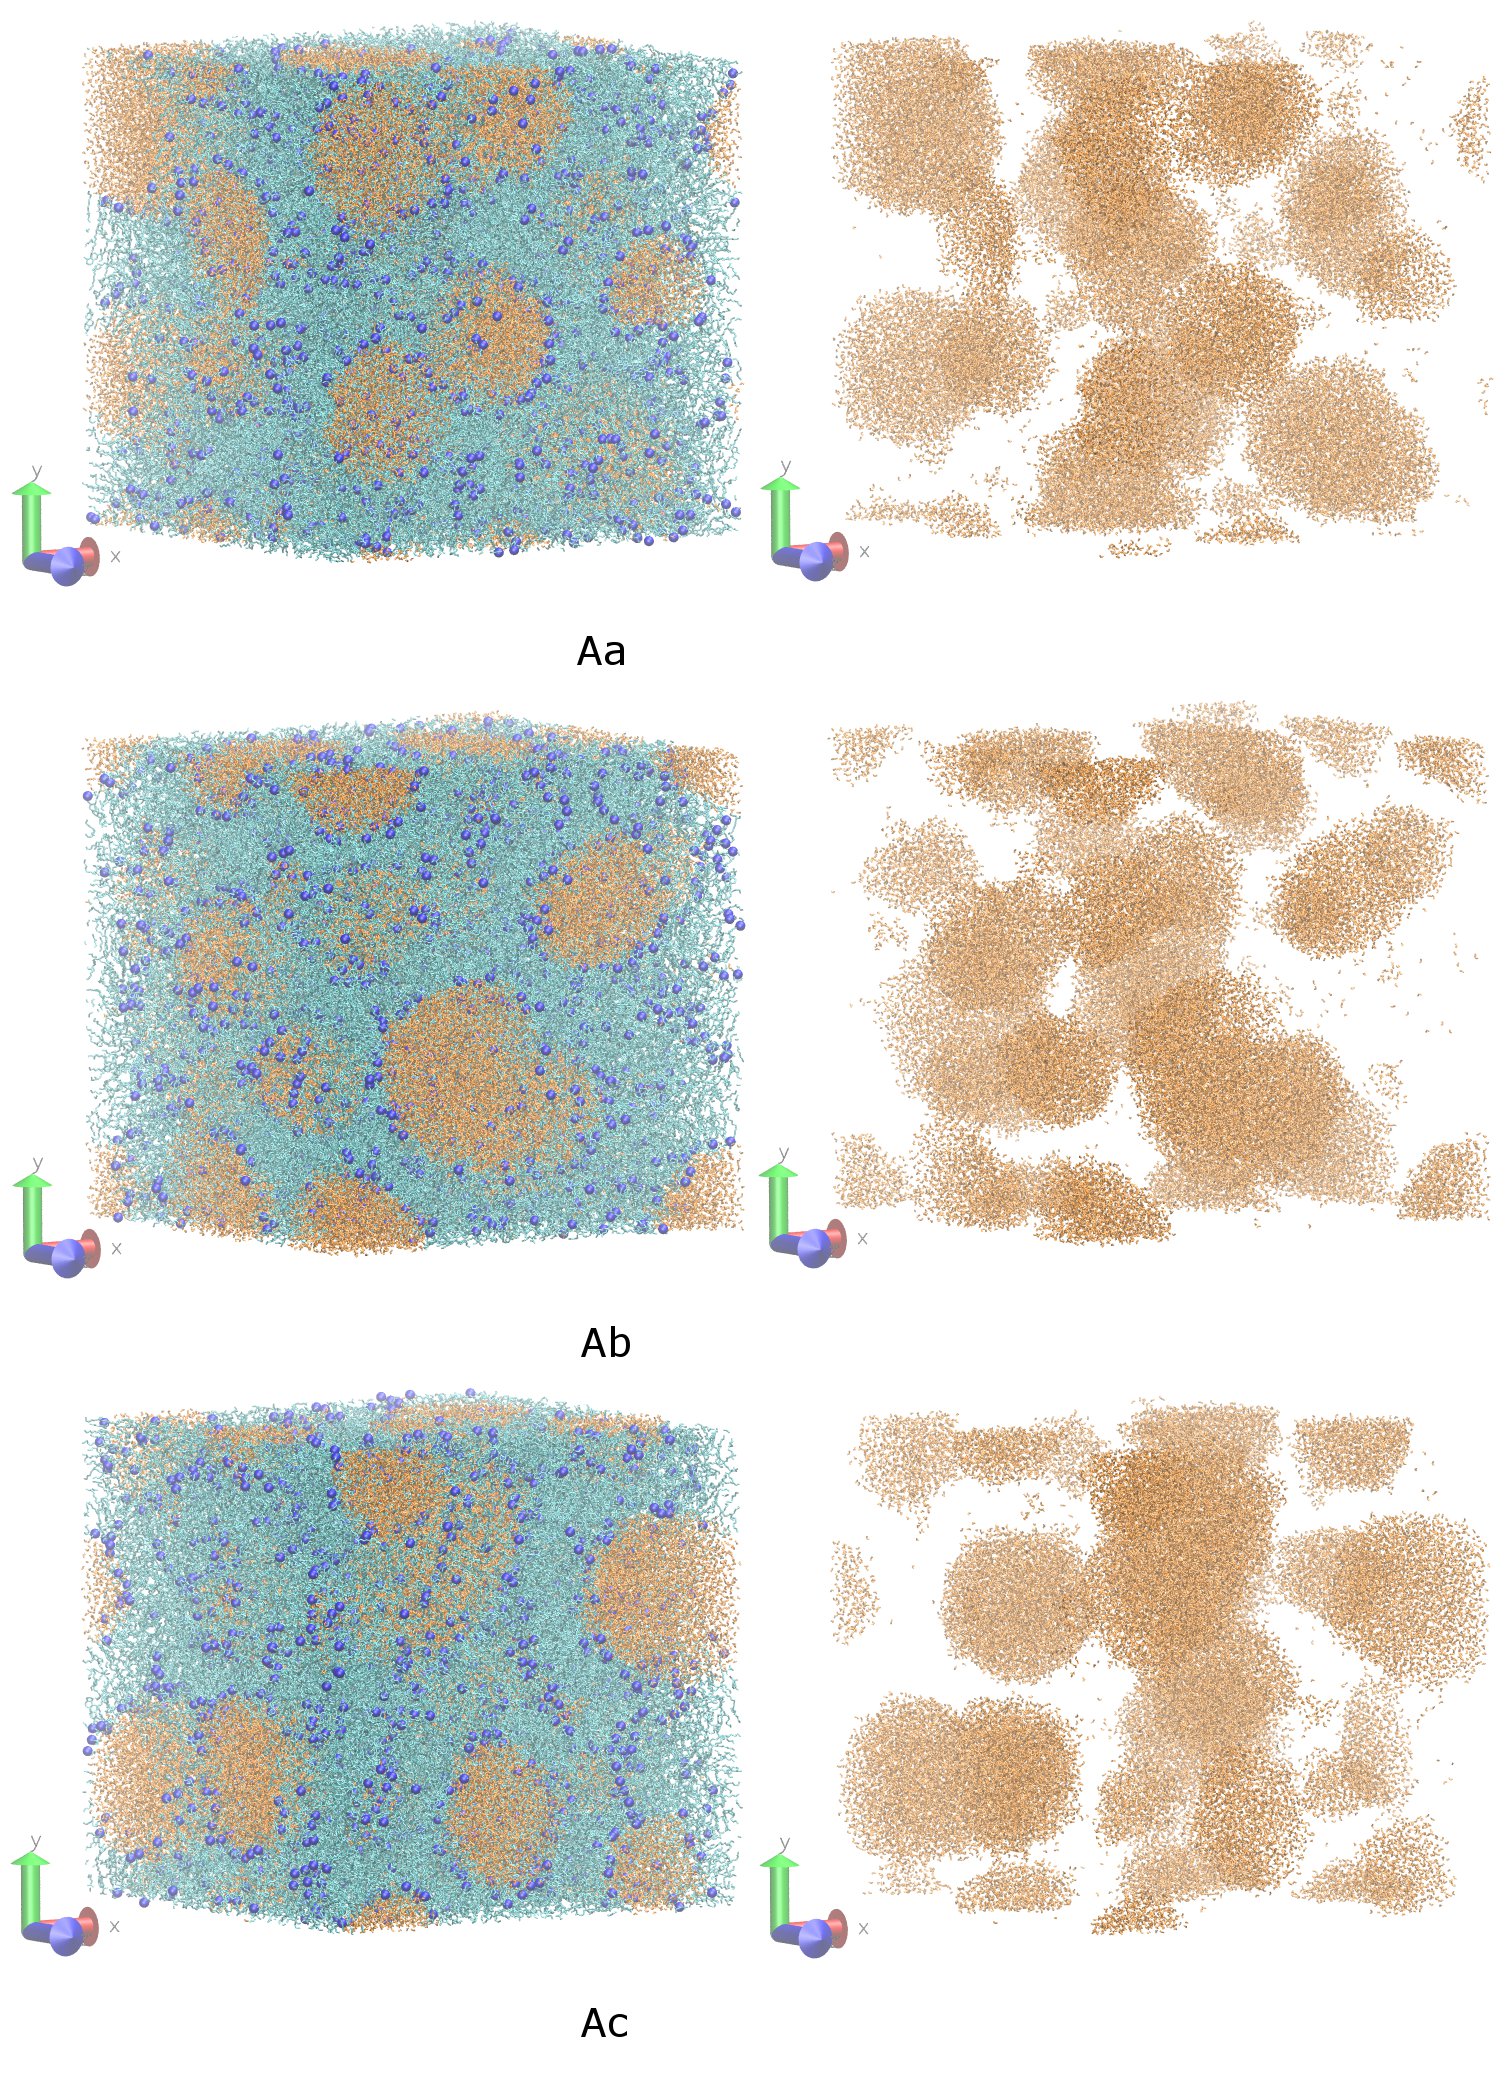
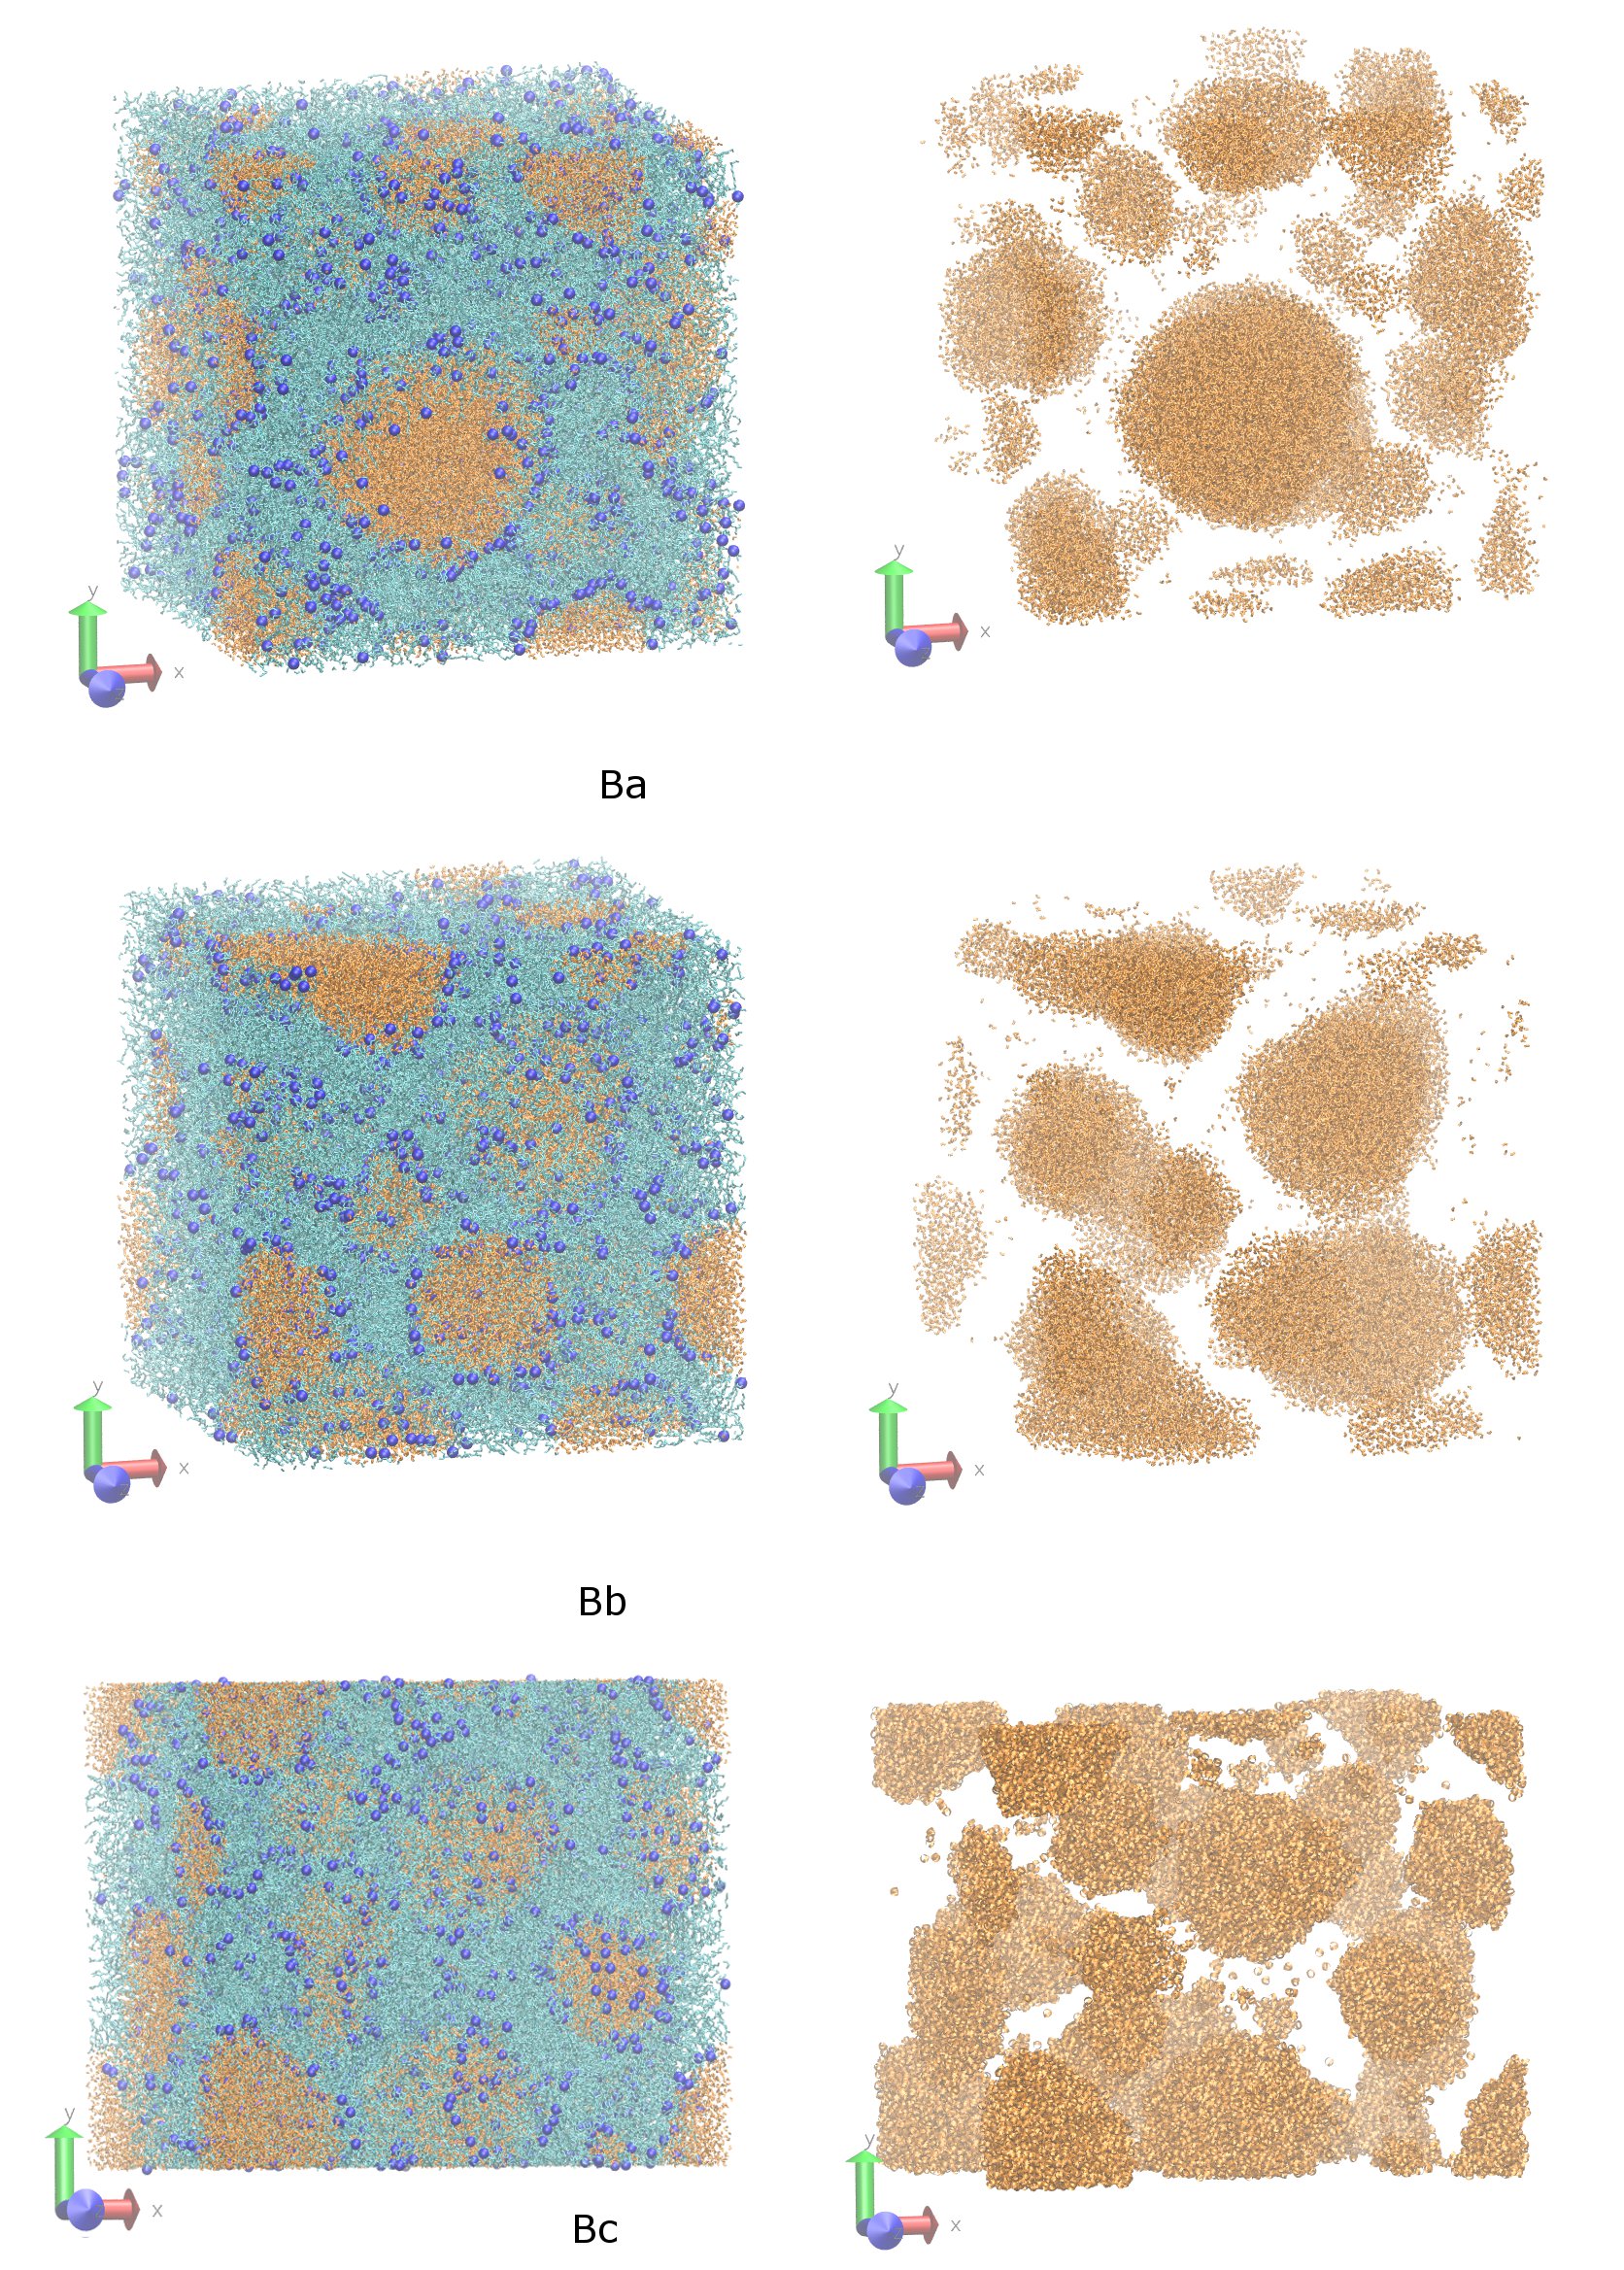
For one of the 2:2:1 composition system (set Bc), we selected a rectangular box with dimensions nearly four times larger than the direction (, ). Once the initial ‘gas’-phase system reached atmospheric pressure, an anisotropic barostat with a large (1000 bar) pressure applied along the directions and atmospheric pressure applied in the direction was used to achieve a nearly cubic box. The resulting deformation aligns the long molecules preferentially along the direction. After this, the pressure couplings were set to atmospheric pressure in all three directions and the system was evolved for at 340 K. The initial alignment did not affect the transition to the final inverse micellar arrangement with on average isotropic lipid orientations. We evolved this set Bc for a further 50 ns at an elevated temperature of 350 K and then finally for another 100 ns at 300 K. The inverse micellar arrangement was found to be robust under change in temperature. The final configurations of the different sets are presented in Fig. S4 and Fig. S5.
S2.2 Surface-templated lipid system
In the final inverse micellar configuration of set Bc we selected a zone, within which the water molecules were frozen along the -direction. We repeatedly carried out short () NVT simulations and identified any new water molecules drifting in the selected zone. These water molecules in turn were added to the frozen list. Locally this creates enough perturbation to move the lipid molecules out of this zone. Only a few lipid tails stay stuck in the frozen water layer. They were pulled out of the water layer by moving them at a constant speed (0.01 nm/ps) away from the water layer. The configuration created by this process is shown in Fig. S6 a. The inverse micellar structure away from the frozen water layer remain unchanged during further evolution (50 ns, Fig. S6 b).
The frozen water layer allows us to introduce a wall along the -direction mimicking a continuous distribution of water molecules. The walls interact with the atoms as an integrated Lennard-Jones (9-3) potential with interaction parameters chosen to be that of atom type OW (oxygen of water) at density 33.44 atoms/nm3. After 50 ns of NPT simulation, no qualitative change in the lipid arrangement was observed (Fig. S6 b).
In SC, the lipids between highly hygroscopic corneocytes are essentially free of water [16]. To simulate at conditions similar to that between corneocytes, we dry the lipid structure by slowly removing the inner water molecules (10 randomly water molecules were removed every 100 ps of NPT simulation), and evolve the system for another 50 ns with a continuous water wall. The anisotropy introduced by the walls along the -direction changes the box dimension significantly (Fig. 4a). But no signature of layering was observed. Specifically, the hydrocarbon tails were found to be equally likely to be parallel to the wall as perpendicular to the wall for lipids close to the boundaries.
In the SC, a layer of ceramide molecules are covalently bonded to the proteins in corneocyte. Thus the CLE surface presents itself as a well aligned layer of ceramide head groups to the stratum corneum lipids. In our next step we try to mimic this surface.
First we replace the continuous wall with a layer of SPC water molecules (24000 molecules) and use 100 ns of NPT simulation. Discrete water molecules provide transient hydrogen bonds that align the lipids closest to the boundary, and the lipid tails align predominantly along the -direction (Fig. S7). From a separate simulation of a hydrated bilayer comprising CER NS 24:0, a single molecule with a hairpin conformation was isolated. The head group (atoms between C16 till O26) was duplicated (as atoms C41 till O51). The new copy of the head group was mirrored first about -axis and then about the nitrogen atom. Finally the new group was given a rigid translation by identifying the terminal CH3 group of the fatty acid chain of original molecule as C41 of the duplicated head group. We term this artificial lipid molecule CRW. Because of the symmetry of this molecule, it has zero curvature and a flat layer structure will be its preferred arrangement. All interaction parameters of the new second head group are identical to the first head group. The molecule was placed in vacuum and energy minimized.
The existing lipid box in which we wanted to include the CRW wall had box dimensions of 13.37 nm 12.10 nm. Guided by the area/lipid of CER 2 bilayers [11], we placed 408 CRW molecules in a roughly triangular lattice with the dimensions of the box identical to the SC lipid system. We place two continuous water walls along the -direction at separation of 3.8 nm. The molecules were energy minimized, and then equilibrated over 0.5 ns with NVT MD simulations at 340K.
This equilibrated CLW layer was included in place of the water wall in the SC lipid box The configuration was energy minimized and evolved for further 1 s at 340 K with NPT simulation. The final configuration of this system is shown in the main body of the paper (Fig. 4c). Close to the two walls, the figure shows aligned bilayers. Further away from the walls, patches of bilayer can be seen that are not oriented with the wall. The long timescale of realignment of the interior bilayer patches may explain the long delay between the lipid release from SG and recovery of the permeability barrier.
S2.3 Signature of inverse micellar phase in hydrated bilayer
CER NS tails are identical to sphingomyelin (SM) except for the absence of the phosphocholine head group. The absence of the phosphocholine headgroup leads to an area/lipid for the CER NS molecules in a bilayer arrangement [11] that is only around 70% of that for SM in a hydrated bilayer [17]. Since SM forms a stable bilayer, from geometric consideration alone [18], one would expect CER to form an inverted phase. In fact, in all but one of the several crystal structures CER adopts a splayed chain arrangement [19] to release the packing frustration of accommodating a small head and comparatively bulky tails.
While a small bilayer with full hydration is indefinitely stable in simulations, the local stress tensor across the bilayer contains information about the spontaneous curvature preferred by the molecules. The integral of the first moment of the difference in the lateral () and the normal pressure () profile is related to the spontaneous curvature and the bending elastic constant for (half of) the bilayer through [20]
| (S1) |
Here, and the integral is assumed to be over a single monolayer. In the literature, this expression is often written in terms of tension, which is the negative of the lateral pressure. Also, different prefactors are used for different definitions of the bending modulus.
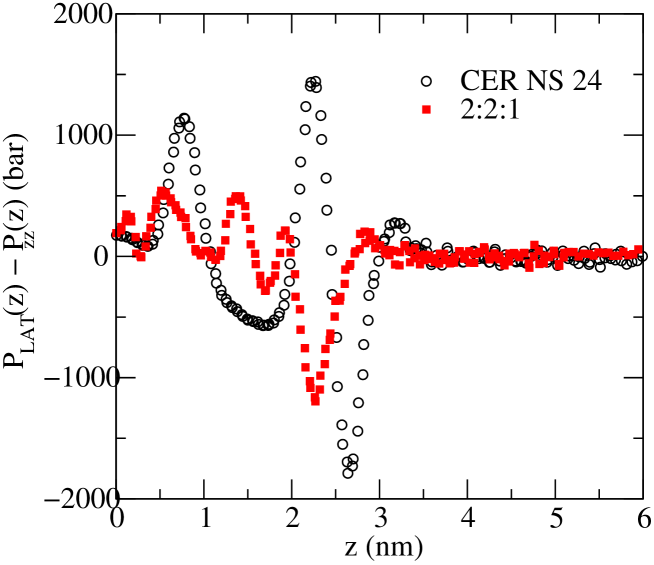
Calculation of the local microscopic pressure tensor is costly and we have not attempted such calculations for these simulations. However, we have re-analyzed the result of a CER NS 24 hydrated bilayer and a 2:2:1 hydrated bilayer comprising CER NS 24, FFA 24 and CHOL from [11]. In Fig S8 we show the lateral pressure profiles at 340K after smoothing the data by combining results from both the monolayers because of the up-down symmetry, and a further three point smoothing.
Using the bending modulus values from [11] ( for the CER NS bilayer and for the 2:2:1 bilayer), numerical integration of eq. S1 then gives for (half of) the CER NS bilayer and for (half of) the mixed lipid bilayer. The sign of the curvature points towards equilibrium inverse phases and the magnitude is similar to the length-scale of the observed checkerboard pattern in cryo-EM [2].
S2.4 Pre-formed multilayers
Separate leaflets with the same number of lipid molecules in each leaflet were prepared by randomly placing the lipid molecules with the CER tails in hairpin arrangements and with the head groups at the same . Four such leaflets were energy minimized and joined to form a double bilayer structure with sufficient separation between the leaflets to accommodate the longest lipid species without overlap with the adjacent leaflet. Continuous water wall was placed along the -directions. The structure was repeatedly compressed in direction by 1%, the leaflets were moved closer to each other by 0.001 nm, and energy minimized. This ensures that the lipids remain in multilayer arrangement, while locally deforming to allow a liquid-like dense configuration. Once the internal pressure reached one atmosphere, a layer of water (20000 molecules, ) was placed in place of the wall, and for 1 ns only the water molecules were evolved with NVT simulation while keeping the lipid molecules frozen. Finally the constraints were removed and NPT steps were used to further evolve the system for 260 ns. We also simulated multilayers with identical preparation steps except with a thicker water layer (25000 molecules). Multilayers remain stable for the entire simulation duration (260 ns) in such cases.
S2.5 Preparation of the simulation snapshots
The figures showing simulation snapshots were prepared with the package Visual Molecular Dynamics (VMD, www.ks.uiuc.edu/Research/vmd), rendered with Persistence of Vision Raytracer (POV-Ray, www.povray.org) and annotated with GNU image Manipulation Program (GIMP, www.gimp.org).
References
[1] Ruth K. Freinkel and David T. Woodley, eds. The biology of the skin. (Parthenon Publishing, London, 2001).
[2] A. Al-Amoudi, J. Dubochet, and L. Norlén, J. Invest. Derm., 124, 764 (2005).
[3] S. Paliwal, G.K. Menon, and S. Mitragotri, J. Invest. Derm., 126, 1095 (2006).
[4] D.C. Swartzendruber, P.W. Wertz, K.C. Madison, and D.T. Downing, J. Invest. Derm., 88, 709 (1987).
[5] J. Ishikawa, H. Narita, N. Kondo, M. Hotta, Y. Takagi, Y. Masukawa, T. Kitahara, Y. Takema, S. Koyano, S. Yamazaki, and A. Hatamochi, J. Invest. Derm., 130, 2511 (2010).
[6] Y. Masukawa, H. Narita, H. Sato, A. Naoe, N. Kondo, Y. Sugai, T. Oba, R. Homma, J. Ishikawa, Y. Takagi, and T. Kitahara, J. Lipid. Res., 50, 1708 (2009).
[7] D. van der Spoel, E. Lindahl, B. Hess, G. Groenhof, A. E. Mark, and H. J. C. Berendsen. Gromacs: Fast, flexible and free. J. Comp. Chem., 26, 1701 (2005).
[8] D. van der Spoel, E. Lindahl, B. Hess, A. R. van Buuren, E. Apol, P. J. Meulenhoff, D.P. Tieleman, A. L. T. M. Sijbers, K. A. Feenstra, R. van Drunen, and H. J. C. Berendsen, Gromacs User Manual version 3.3. www.gromacs.org (2005).
[9] S.W. Chiu, M. Clark, V. Balaji, S. Subramaniam, H.L. Scott, and E. Jackobsson, Biophys. J., 69, 1230 (1995).
[10] O. Berger, O. Edholm, and F. Jähnig, Biophys. J., 72, 2002 (1997).
[11] C. Das, M. Noro, and P. D. Olmsted, Biophys. J., 97, 1941 (2009).
[13] C. Das, P. D. Olmsted, and M. G. Noro, SoftMatter, 5, 4549 (2009).
[14] A. Weerheim and M. Ponec, Arch. Derm. Res., 293, 191, (2001).
[15] H. Farwanah, J. Wohlrab, R. H. H. Neubert, and K. Raith, Anal. Bioanal. Chem., 383, 632 (2005).
[16] J. A. Bouwstra, A. de Graaff, G. S. Gooris, J. Nijsse, J. W. Wiechers, and A. C. van Aelst, J. Invest. Derm., 120, 750 (2003).
[17] E. Mombelli, R. Morris, W. Taylor, and F. Fraternali, Biophys. J., 84, 1507 (2003).
[18] J. N. Israelachvili, Intermolecular and surface forces. (Academic Press, London, 1991).
[19] J. Shah, J. M. Atienza, R. I. Duclos Jr., A. V. Rawlings, Z. Dong, and G. G. Shipley, J. Lipid Res., 36, 1936 (1995).
[20] J. M. Seddon, Biochim. Biophys. Acta, 1031, 1 (1990).