Typical atmospheric aerosol behavior at the Cherenkov Telescope Array candidate sites in Argentina
Abstract
Aerosols from natural and antropogenic sources are one of the atmospheric components that have the largest spacial-temporal variability, depending on the type (land or ocean) surface, human activity and climatic conditions (mainly temperature and wind). Since Cherenkov photons generated by the incidence of a primary ultraenergetic cosmic gamma photon have a spectral intensity distribution concentrated in the UV and visible ranges [Hillas AM. Space Science Reviews, 75, 17-30, 1996], it is important to know the aerosol concentration and its contribution to atmospheric radiative transfer. We present results of this concentration measured in typical rather calm (not windy) days at San Antonio de los Cobres (SAC) and El Leoncito/CASLEO proposed Argentinean Andes range sites for the placement of the Cherenkov Telescope Array (CTA). In both places, the aerosol concentration has a peak in the 2.5-5.0m range of the mean aerosol diameter and a very low mean total concentration of 0.097g/m3 (0.365g/m3) for SAC(CASLEO). The data were collected the days 15/Dec/2012 (27-28/Dec/2012) for the first (second) place with a GRIMM aerosol spectrometer, who determines the aerosol concentration at a given diameter (0.22-32 m range) with a laser technique. We also present AOD values for each CTA proposed place, derived with the improved Deep Blue algorithm, from data measured by SEAWiFS instrument on board of SeaStar/NASA satellite. They have very low mean values, determined for the 1998-2010 period, AOD550nm,SAC = 0.026 0.011 and AOD550nm,CASLEO = 0.030 0.014. Also, we introduce the spectral (380 nm) solar irradiance as a test in these sites of the tropospheric UV atmospheric transmittance.
1 Introduction
Cosmic gamma photons and showers of secondary particles can be detected through its interaction with atmospheric gases and aerosols. Among them, particulate matter originated from natural and antropogenic sources are one of the components that have the largest spacial-temporal variability, depending on the type (land or ocean) surface, human activity and climatic conditions (mainly temperature and wind). In particular, Cherenkov photons generated by the incidence of a primary ultraenergetic cosmic gamma photon, have a spectral intensity distribution concentrated in the UV and visible ranges (see Hillas [1]).
In relation to the search for a convenient place for the previous CTA location (see for example HESS Collaboration [2]), Esposito et al. [3], analyzed the aerosol characteristics at the Khomas highlands in Namibia. In a similar search, in what follows we introduce in item 2 the proposed Argentinean sites and in items 3.1 and 3.2, the corresponding behavior of the aerosol concentration (from ground measurements), aerosol optical depth (from satellite data) and 380 nm solar spectral irradiance (also from satellite data).
The next-generation high-energy gamma ray observatory, the CTA Consortium (www.cta-observatory.org/) will be a wide collaboration from Africa, Asia, Europe, North and South America. CTA now goes through its preparatory phase for candidate sites both for the Northern and Southern hemispheres. These studies, among others, involve atmospheric quality, according to precise specifications for the telescopes belonging to CTA [4], [5], [6]. Current systems of Cherenkov telescopes use at most four telescopes, providing best stereo imaging of particle cascades over a very limited area, with most cascades viewed by only two or three telescopes. An array of tens of telescopes will allow the detection of gamma-ray induced cascades over a large area on the ground, increasing the number of detected gamma rays, while at the same time providing a much larger number of views of each cascade. This will result in the improvement of angular resolution and in a better suppression of cosmic-ray background events. The Cherenkov Telescope Array Consortium contemplates the design, construction and operation of two observatories for the detection of gamma-rays produced by extraterrestrial sources. The observatories will be deployed in both hemispheres for a full sky coverage. Each observatory will consist of an array of telescopes, with enough sensitivity to detect the atmospheric Cherenkov radiation produced by the gamma-rays, improving the capacity of the actual facilities. In the present design, the Southern hemisphere array of CTA will consist of three types of telescopes with different mirror sizes, 24, 10-12 and 4-6 meters, in order to cover the full energy range. This enhanced capacity includes: a) Higher sensitivity for source detection, b) Higher detection rate of transient events, c) Improved angular resolution and d) Full sky coverage. The CTA array will be distributed over a surface of around 10 km2 for the southern array, located at sites with excellent optical and atmospheric conditions and at an altitude between 1800 m and 3800 m asl.
2 Description of the proposed Argentinean sites
Argentina has many potential candidate sites satisfying the basic requirements for installation of CTA. Mostly in the Northwest of the country, in the provinces where the Andes mountains are placed (San Juan, La Rioja, Catamarca,Salta and Jujuy) it is possible to find adequate flat areas of height above 1800 meters, with clear skies and suitable meteorological and geographical conditions. After a pre-selection of a dozen promising sites, the search was successively refined by analysis of cartography, available climate data, local surveys and interviews with experts in the search for astronomical sites (see Allekotte et al.[7]). In particular, about the dust and sand, the requirements are: ”The natural cleanliness class of the site at 3 m above ground should be better than ISO-Class 8 (according to ISO14644-1) for 90% of the time (survival condition)”. Its value of 290 000 part/m3 is order of magnitudes higher than we obtained for SAC (CASLEO): 610 (9750) part/m3, in calm (not windy) typical days with the GRIMM instrument.
Two sites that have very good visibility (and consequently very low aerosol content) are: San Antonio de los Cobres (Province of Salta) and Pampa de El Leoncito/CASLEO (Province of San Juan). They have been preselected by the Argentinean institutional members of CTA and attention has been put to characterize and develop them further, being the present work a partial approach to this characterization, concentrated in the aerosol behavior.
One of the proposed sites is very near San Antonio de los Cobres (SAC) (24o02’42.7” S, 66o14’05.8” W) in the high altitude desertic place of Puna of Atacama, in the Salta Province at 3600 m a.s.l., in a rather plane region. The other proposed site is in the Pampa (plane) of El Leoncito (LEO) (31o04’48” S, 69o16’12” W), near the CASLEO (Complejo Astron´omico El Leoncito), at San Juan Province. This site is placed at 2600 m a.s.l., at the middle of the region which is limited at the right by the Precordillera and at the left by the Andes mountains.
3 Results
3.1 Ground measurements of aerosol concentration
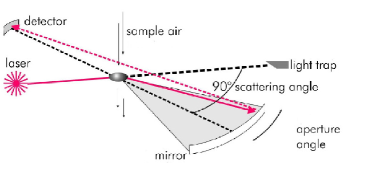
We used in the present work a GRIMM aerosol spectrometer (also called Optical particle counter), model 1.109, of the Institute of Physics Rosario (CONICET – National University of Rosario), Argentina, that measures the particle concentration in particles/m3 or in g/m3. It has the possibility to measure in detail the concentration at mean diameter intervals between 0.22 m and 32 m and at fixed (predetermined) time intervals (for example, each 1, 5,…, minutes). Figure 1 describes its operation, that it is based in the measurement technique of scattering of 655 nm laser light, produced by the particles that are present in the air sample. This sample is introduced into the equipment by the action of a pump with controlled flux of 1.2 liters/min. The scattered radiation is collected by a parabolic mirror and directed through the detector. The signal is detected by a multi-channel classifier (of 31 channels) and correlated with the size distribution. This signal can then be transformed into aerosol number concentration or particulate matter concentration.
The GRIMM aerosol spectrometer has been used in many applications, one of the most important one was done in 2010,
during the eruption of the Eyjafjallajökull Island volcano, that affected significantly the air traffic in Europe
(see for example the work of Weber et al. [8]). In what follows, we present results obtained with this
instrument in both Argentinean proposed sites.
3.1.1 San Antonio de los Cobres data
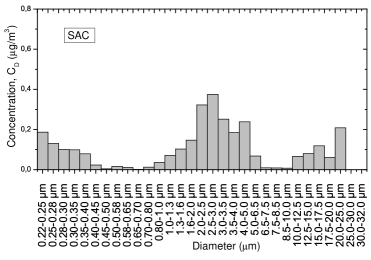
At the SAC location, the aerosol concentration data were collected during the morning of the day 15th December 2012, with rather calm (not windy) conditions, being the mean wind velocity measured at this location with a Davis meteorological station about (11 7) Km/h. The aerosol concentration shows a peak in the 2.5-3.0 m range of the mean aerosol diameter and a very low mean total concentration CD = (0.097 + 0.1, -0.097) g/m3 of the aerosol diameter distribution (see Figure 2).
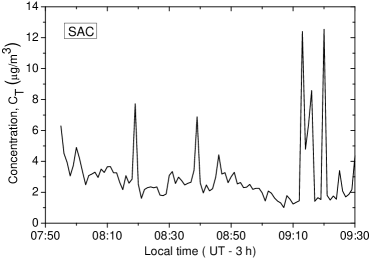
We represented in Figure 3 the same quantity but as a function of time, showing a mean value CT = (3.0 1.9) g/m3, (where CT = CD x 31, the number of channels).
3.1.2 El Leoncito/CASLEO data
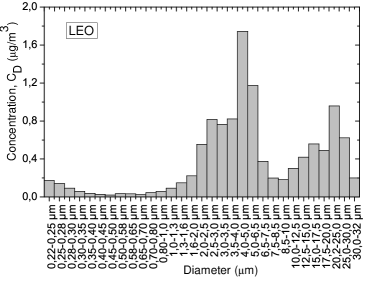
A similar analysis for the aerosol concentration was made with the GRIMM instrument at El Leoncito/CASLEO, where the
particulate matter was collected between 2 pm of the day 27th up to 2 pm of the day 28th December 2012
(Figure 4 ). The mean wind velocity measured at this location with a Davis meteorological station
was about (10.8 6) Km/h. The data show a peak in the 4.0-6.5 m range of the mean aerosol diameter
and a low mean total concentration CD = (0.37 0.8) g/m3.
We represented the time dependence of this total concentration in Figure 5, having a mean value CT = (11.5 11.4) g/m3.

3.2 Satellite data of aerosol optical depth and 380 nm spectral irradiance
The SeaWiFS (Sea-viewing Wide Field-of-view Sensor) instrument is on board of the SeaStar NASA spececraft, placed at a 705 km circular, noon, sun-synchronous orbit. The satellite orbits the Earth fourteen times a day, every 99 minutes. It was designed mainly for the study of fitoplankton in the ocean, but it has the possibility to derive aerosol optical depth data not only from the ocean but also from the land [9]. Recently, it was introduced the improved Deep Blue algorithm (Level 3) that gives more reliable data than the previous one [10].
3.2.1 San Antonio de los Cobres and El Leoncito/CASLEO data
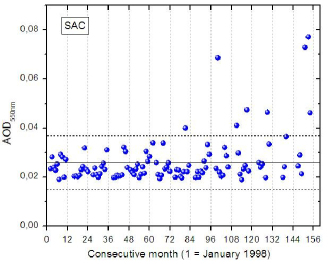
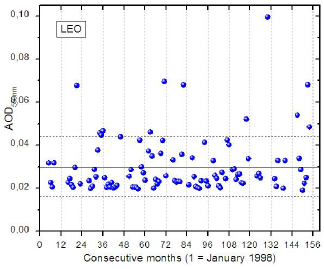
The attenuation of Cherenkov photons by aerosols can be described by the aerosol optical depth (AOD) for a given wavelength. Consequently, we present AOD values for each CTA Argentinean sites: SAC and El Leoncito/CASLEO. They are derived from data measured by the SEAWiFS instrument. The corresponding mean values for the 1998-2010 period are very low: AOD550nm,SW,SAC = 0.026 0.011 and AOD550nm,SW,CASLEO = 0.030 0.014. In Figure 6 and Figure 7 we present the mean monthly time series for the 1998-2010 period, measured by the same instrument at SAC and El Leoncito/CASLEO sites.
3.2.2 380 nm spectral solar irradiance
Atmospheric particulate matter attenuates significantly the solar irradiance, mainly in the UV (290-400 nm) and
visible (400-750 nm) ranges. Consequently, as a test in the Argentinean CTA sites of the tropospheric (0-about
15 km height) UV atmospheric transmittance,
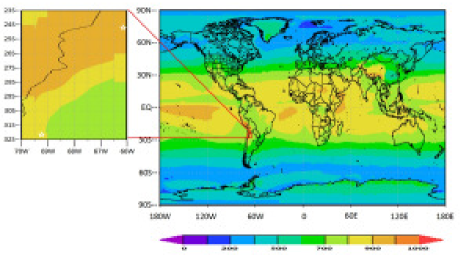
we introduce in Figure 8 the mean spectral (380 nm) solar
irradiance measured by OMI-KNMI (The Netherlands) instrument
on board of AURA/NASA satellite, for the 2005-2011
period. The corresponding value for SAC site is (925 25) mW/(m2nm), and for El Leoncito/CASLEO site is
(850 50) mW/(m2nm). It can be seen at the global false
color image (Figure 8, right), that the mean narrow band
(380 nm) solar radiation at SAC and El Leoncito-CASLEO
places is within the highest of the world. This shows a small
influence of aerosol (almost the unique large Mie scattering attenuator
in this wavelength range), and confirms the low AOD
values displayed in the previous section.
4 Conclusions
The present ground (GRIMM aerosol spectrometer) results obtained for clear days are promising. Also from the satellite data, we can conclude that, at least from the point of view of the aerosol content of the atmosphere at both argentinean proposed sites, San Antonio de los Cobres (Salta province) and El Leoncito/CASLEO (San Juan province), the sky is very clear and well suited for the placement of the Cherenkov Telescope Array, since the days where typical not windy ones and the values very low, as indicated in item 3.1. In particular, about the requirements for dust and sand, its value of 290 000 part/m3 is order of magnitudes higher than we obtained for SAC (CASLEO): 610 (9750) part/m3, in calm (not windy) days with the GRIMM instrument.
These two sites have very good visibility (and consequently very low aerosol content).
5 Acknowledgements
We like to acknowledge to: the CTA Argentina-Brazil collaboration, CONICET, MYNCYT, National University of Rosario,
National Technological University, and SEAWiFS/NASA Science Team. Also to Christina Hsu and Andrew Sayer of
the Goddard Space Flight Center/NASA for fruitful discussions on aerosol optical depth data. We gratefully acknowledge
support from the agencies and organizations listed in this page:
http://www.cta-observatory.org/?q=node/22.
References
-
[1]
Hillas, A M. Differences between gamma ray and hadronic showers. Space Science Reviews, 75, 17-30, 1996.
-
[2]
High Energy Stereoscopic System Observatory (HESS), http://www.mpi-hd.mpg.de/hfm/HESS/.
-
[3]
Esposito F , Mari S, Pavese G and Serio, C. Diurnal and nocturnal measurements of aerosol optical depth at a desert site in Namibia. Aerosol Science and Technology, 37 (4), 392-400, 2003.
-
[4]
CTA Consortium, 2013 LST Requeriments , MAN-PO/120806, , Internal Doc.
-
[5]
CTA Consortium, 2013 MST Requeriments , MAN-PO/120807, Internal Doc.
-
[6]
CTA Consortium, 2013 SST Requeriments , MAN-PO/120808, Internal Doc.
- [7] Allekotte, I. et al. for the CTA Consortium, Sites in Argentina for the Cherenkov Telescope Array Project, Proceedings of the ICRC 2013.
-
[8]
Weber K, A. Vogel, C. Fischer, G. van Haren, T. Pohl. Airborne measurements of the Eyjafjallajökull volcanic ash plume over North-Western Germany with a light aircraft and an optical particle counter –first results. Proccedings Lidar Technologies, Techniques, and Measurements for Atmospheric Remote Sensing. 20-23 September 2010, Toulouse, France. Online Publication Date: 26 October 2010 edited by Upendra N. Singh, Gelsomina Pappalardo, Proc. of SPIE Vol. 7832, 78320P, 2010.
-
[9]
An Overview of SeaWiFS and the SeaStar Spacecraft,NASA, http://oceancolor.gsfc.nasa.gov/SeaWiFS/.
-
[10]
Giovanni - Interactive Visualization and Analysis,NASA, http://disc.sci.gsfc.nasa.gov/giovanni.
All the web pages were retrieved during may of 2013.