Femtosecond study of the effects of ions on the reorientation dynamics of water
Abstract
We study the effects of ions on the reorientation dynamics of liquid water with polarization-resolved femtosecond mid-infared spectroscopy. We probe the anisotropy of the excitation of the O–D stretch vibration of HDO molecules in solutions of NaCl, NaI and N(alkyl)4Br (tetra-alkylammoniumbromide) salts in 8% HDO:H2O. We find that the reorientation O–D groups of HDO molecules hydrating the Cl- and I- anions occurs on two different time scales with time constants of 20.3 ps and 92 ps. The fast component is due to a wobbling motion of the O–D group that keeps the hydrogen bond with the halogenic anion intact. For solutions of N(alkyl)4Br salts we observe a very strong slowing down of the reorientation of water that is associated with the hydration of the hydrophobic alkyl groups of the N(alkyl)4+ ions.
Introduction
Water plays an essential role in the determination of the spatial structure of (bio)molecules and (bio)molecular ions. Examples of this role of water are the hydrophobic collapse in the folding of proteins and the self-organized formation of cell membranes lee04 . However, the interactions between water and a solute not only determine the properties of the solute, these interactions also change the structure and dynamics of water itself.
Water molecules close to a solute or interface tend to show slower orientational dynamics than in bulk liquid water. For hydrophylic solutes and surfaces the slowing down can be explained from the specific interactions between the water molecules and the solute/surface. These interactions can take the form of a hydrogen-bond or can be purely electrostatic. The electric fields exerted by ionic charges lead to a strong ordering of the surrounding water. In earlier times it was thought that the effects of ions on water structure were quite long range and would extend well beyond the first hydration layer cox34 . Some ions were thus referred to as structure makers, others as structure breakers. However, recent experimental and theoretical work showed that for most ions the effect on the structure and dynamics of water is limited to only one or two hydration layers omta03 ; smith07 ; mancinelli07 ; schmidt09 ; lin09 . Only for specific combinations of ions, like Mg2+ and SO42-, it was found that the water dynamics can be impeded over relatively long ranges tielrooij10 .
Hydrophobic surfaces also influence the structure and dynamics of water due to the fact that hydrophobic molecular groups take up space in the hydrogen-bond network of the water liquid. This occupation of space has profound effects on the free energy of the solute and its hydration shell. These effects depend on the size of the hydrophobe chandler05 . Small hydrophobes (1 nm) can be accommodated in the hydrogen-bond network of water without significantly breaking of hydrogen bonds, similar as one may create a hole in loosely woven fabric by distorting the pattern of the threads without needing to break them muller90 . The water molecules form tangential hydrogen bonds to each other along the hydrophobic surface, and the water density near this surface is larger than in the bulk chandler05 . For large hydrophobic structures (1 nm), the water hydrogen-bond network is truncated near the hydrophobic surface. In this case, the water density is lower near the surface than in the bulk. If two hydrophobes merge, the solvation free energy is reduced, which forms the driving force of the hydrophobic collapse. The occupation of space in the hydrogen-bond network of water also explains the slowing down of the dynamics of nearby water molecule. The reorientation of a water molecule in bulk water involves the collective repositioning of several water molecules, and these collective dynamics are hindered by the presence of the hydrophobe rezusjpca08 ; petersen09 ; laage09 .
In this paper we study the effects of different ions on the orientational mobility of water molecules. We probe these dynamics with polarization-resolved femtosecond mid-infrared spectroscopy. We study the combined effects of electrostatic and hydrophobic interactions on the dynamics of water by measuring the dynamics of water in the hydration shells of different N(alkyl)4+ (tetraalkylammonium) ions.
Experiment
We study the dynamics of water molecules in salt solutions by monitoring the reorientation of HDO molecules in isotopically diluted water (4% D2O in H2O = 8% HDO:H2O). These orientational dynamics are measured by probing the anisotropy dynamics of excited O–D vibrations with polarization-resolved femtosecond mid-infrared (fs-IR) pump-probe spectroscopy. This technique requires intense femtosecond light pulses at a wavelength of 4 m (2500 cm-1). These pulses are obtained via parametric amplification processes that are pumped by the pulses of a regeneratively amplified Ti:sapphire laser system (Spectraphysics Hurricane).
The Ti:sapphire laser system generates pulses at a wavelength of 800 nm with a pulse energy of 900 J at a repetition rate of 1 kHz. The output of the laser is split into two parts. The first part is used to pump a white-light seeded Optical Parametric Amplifier (OPA) based on a -bariumborate (BBO) crystal (Spectra Physics). The BBO crystal is angle tuned to generate light at 1.3 (signal) and 2 m (idler). The idler is frequency doubled in a second BBO crystal to a wavelength of 1 m. This 1 m pulse is used as a seed in a parametric amplification process in a potassium niobate crystal (KNB) crystal that is pumped with the remaining part of the 800 nm beam. In this latter process pulses are generated with a central wavelength of 4 m, a pulse energy of 5 J, and a pulse duration of 120 femtoseconds.
The 4 m pulses are sent onto a wedged CaF2 plate. The transmitted part (90 %) serves as the pump in the polarization-resolved pump-probe experiment. The reflection from the front side is sent into a variable delay stage with a resolution of 3 fs. This fraction forms the probe. With the delay stage we vary the time delay between pump and probe. The reflection from the back side of the wedged CaF2 plate serves as a reference. The pump is transmitted through a /2 plate to rotate its polarization at 45 degrees with respect to the probe. The pump, probe and reference are all focussed in the sample using a gold-coated parabolic mirror, but only the pump and the probe are in spatial overlap. After the sample, the probe and the reference are dispersed with an Oriel monochromator and detected with the two lines of an Infrared Associates 232 MCT (mercury-cadmium-telluride) detector array. The measurement of the reference thus allows for a frequency-resolved correction for shot-to-shot fluctuations of the probe-pulse energy.
The pump promotes population from the equilibrium ground-state to the first excited state . This excitation leads to a bleaching signal and stimulated emission at frequencies matching the transition, and to an induced absorption at frequencies matching the transition. The pump pulse will preferentially excite O–D groups of which the transition dipole moment is oriented parallel to the polarization of the pump pulse. Hence, the excitation will be anisotropic. After the sample, the polarization components of the probe parallel and perpendicular to the polarization of the pump are selected with a polarizer mounted on a rotation stage. Thereby we obtain the pump-induced transient absorption changes for both polarization directions: and . These absorption changes are used to determine the anisotropy of the O–D excitation:
| (1) |
with the anisotropy of the excitation that depends on the probe frequency and the delay time between pump and probe. The denominator of the above expression represents the so-called isotropic signal and serves to divide out the decay of and due to the vibrational relaxation of the O–D excitation. As a result, only reflects the orientational dynamics of excited O–D vibrations. In the case of isotopically diluted samples, the dynamics of only represents the molecular reorientation of the O–D groups of the HDO molecules.
We use the above described technique to study the anisotropy dynamics of HDO molecules in solutions of NaCl, NaI and different N(alkyl)4Br salts in 8% HDO:H2O. All salts were of 99.5% purity and were purchased from Sigma Aldrich. D2O was also purchased from Sigma Aldrich and has a purity of 99.99%. The sample cell consisted of two 4 mm calcium fluoride windows which were pressed against each other with a teflon spacer in between. To keep the infrared transmission around 10% we used spacers of 25 m for the samples with low salt concentrations and 50 m for the samples with high salt concentrations. All concentrations in this paper are denoted in moles of solute per kilogram of solvent (molality).
Results and Discussion
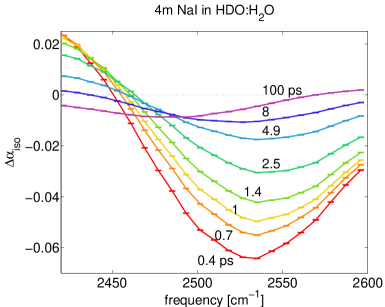
Figure 1 shows transient absorption spectra of the O–D stretch vibration of HDO molecules at different delay times measured for a solution of 4 m NaI in 8% HDO:H2O. These transient spectra are difference spectra between the absorption spectrum measured at a particular delay time after the excitation, and the original ground state absorption spectrum (no excitation pulse). At early delays the transient spectra are characterized by a negative (bleach) contribution at high frequencies (2450 cm-1) representing the bleached absorption and stimulated emission of the 1 transition, and a positive signal at lower frequencies (2450 cm-1), representing the induced 1 absorption. The bleaching signal and the induced absorption both decay with a time constant of 2 ps.
After 10 ps the transient spectrum does not change any further with increasing delay time. After this time the excited O–D vibrations have completely relaxed and the transient spectrum represents the spectral response resulting from the heating of the sample by a few Kelvin. An increase in temperature induces a decrease in the cross-section and a small blueshift of the O–D stretch vibrations. The difference spectrum of the absorption spectrum at long delay times and the original absorption spectrum thus shows a persistent bleaching in the main part of the O–D stretch absorption spectrum and a small induced absorption in the blue wing of this spectrum.
We find that the vibrational relaxation of the O–D vibrations does not immediately lead to a rise in temperature. A similar delayed rise of the thermal response was observed in a study of the vibrational dynamics of neat 8% HDO:H2O rezus05 . This delayed thermal response can be due to the transient population of a particular non-thermal state in the vibrational relaxation of the O–D stretch vibration. Such a non-thermal state may involve the H–O–D bending mode and/or the librational modes. However, the intermediate state was observed to have no spectral signature rezus05 , which means that its absorption spectrum is identical to that of the O–D stretch vibration before the excitation by the pump. Therefore, the delayed rise of the thermal response is likely not due to the transient excitation of a specific mode like the H–O–D bending vibration, because such an excitation would lead to an anharmonic frequency shift of the absorption spectrum of the O–D stretch vibration. Instead, the delayed rise of the thermal spectrum is likely due to the relatively slow adaptation of the coordinates of low-energy degrees of freedom (hydrogen-bond bend and stretch) to the higher energy content that results from the relaxation of the O–D stretch vibration. The relaxation of the O–D stretch vibration leads to a rapid increase of the energy content of the lower-energy degrees of freedom, and these coordinates need some time to evolve to the new equilibrium positions corresponding to this higher energy content.
In previous work it was found that the vibrational relaxation dynamics of salt solutions containing Cl-, Br-, or I- ions consists of two distinct components kropman01b ; park07 . One component is formed by O–D groups that are hydrogen bonded to the oxygen atom of another water molecule. This component comprises both the bulk water molecules and the water molecules in the hydration shells of the cations. These O–DO groups absorb at about the same frequency as the O–D groups in neat HDO:H2O and have a vibrational lifetime of 1.80.2 ps. The other component is formed by O–D groups that are hydrogen bonded to the halogenic anion A-(=Cl-, Br- or I-). The absorption spectrum of these O–DA- oscillators is blueshifted with respect to the absorption spectrum of the O–DO component. This blueshift results from the fact that the surface charge density decreases with increasing anion size, which leads to a weakening of the O–DA- hydrogen bond bergstroem91 . The excited O–DA- vibrations have a vibrational lifetime of 3-6 ps kropman01b ; park07 , substantially longer than the excited O–DO oscillators.
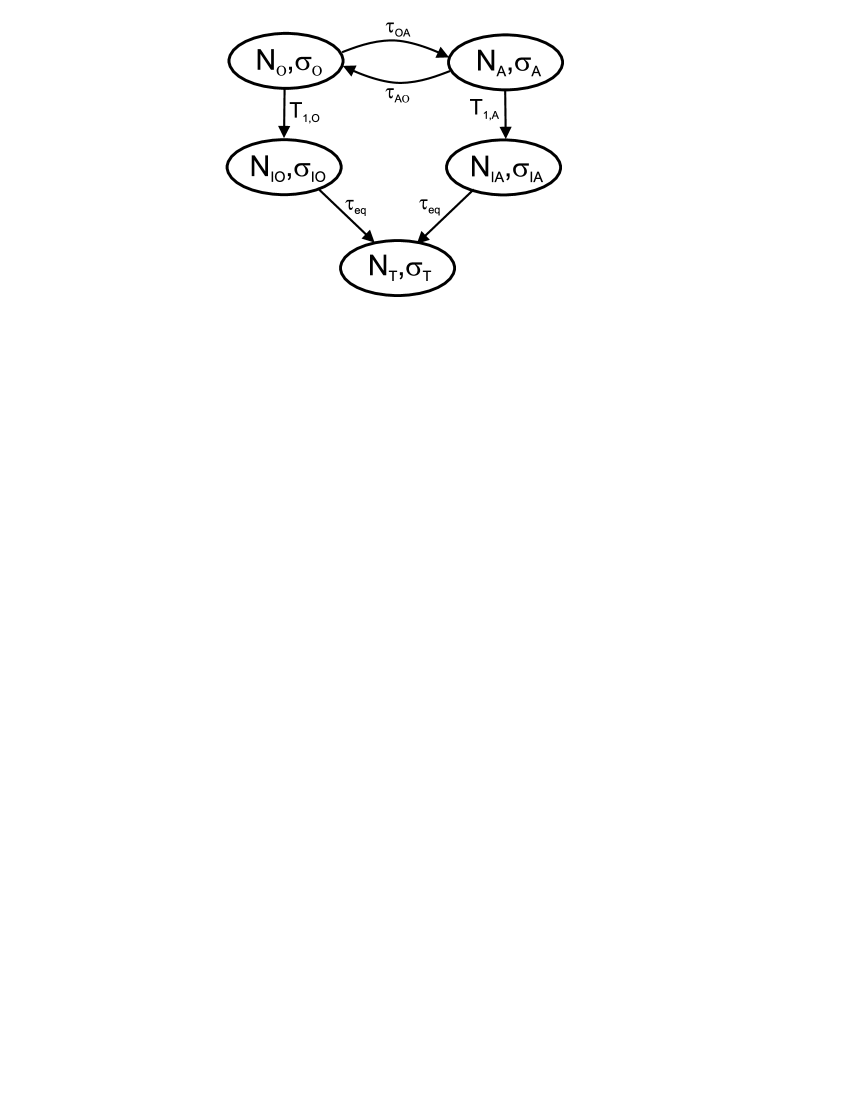
We describe the vibrational relaxation with a model in which there are two different excited states, corresponding to the states of the O–DO and O–DA- oscillators. These excited states relax with vibrational relaxation time constants and to their associated intermediate states. These intermediate states then relax to the final heated ground state with a time constant . Each of the states has a specific associated difference spectrum with respect to the ground state. The shapes of the difference spectra are fitted to the measured transient spectra at all different delay times. The fitted difference spectra do not change in shape as a function of delay time, they only change in amplitude following the relaxation dynamics of the kinetic model that is schematically depicted in Fig. 2.
In the kinetic modeling we included the effects of exchange between the anion hydration shell and the bulk. Recently this exchange was studied for aqueous solutions of NaBF4 moilanen09b and NaClO4 ji10 ; gaffney11 . The time constant of the switching from the hydration shell of the anion to the bulk was found to be 7 ps for BF4- and 9 ps for ClO4-. Unfortunately, we cannot measure this time constant for Cl- and I-, because the O–DA- and the O–DO absorption bands are too strongly overlapping for these salt solutions. For BF4- and ClO4- the O–DA- and the O–DO absorption bands are quite well separated, thus allowing the measurement of the exchange rate between these components. In view of the fact that the hydrogen bonds between water and the halogenic anions are stronger than those between water and BF4-/ClO4-, we expect the switching time for rotation out of the hydration shell of Cl- and I- to the bulk to be at least as large as observed for BF4- and ClO4-, i.e. 9 ps. In the modeling we use a value of of 9 ps. The value of of the reverse process was chosen such that the number density of O–DA- oscillators is conserved. Hence, , meaning that will decrease with increasing salt concentration.
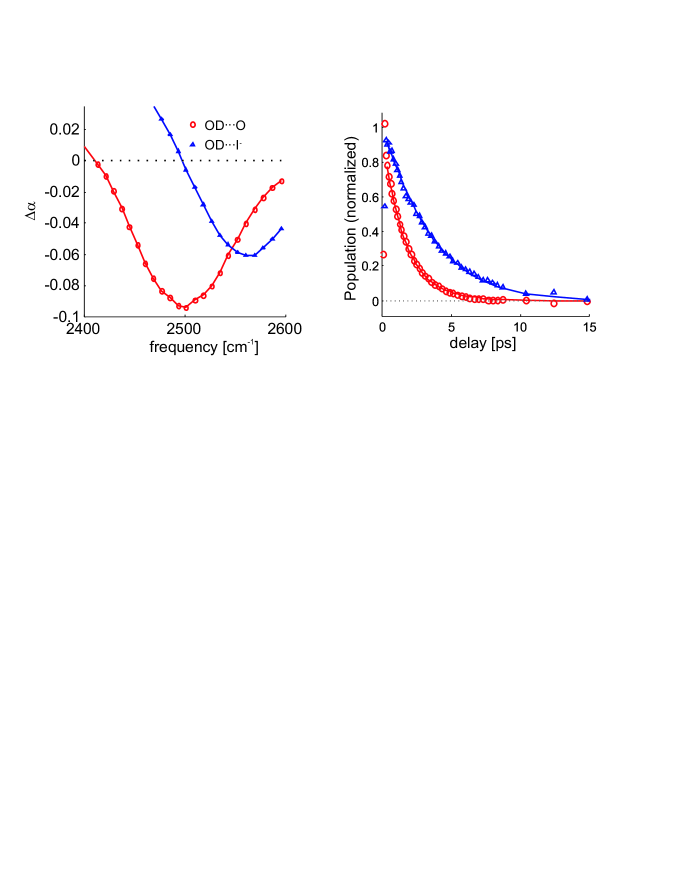
Fig. 3 presents the results of a fit of the above described kinetic model to the data shown in Fig. 1. The left panel of Fig. 3 shows the difference spectra associated with the excited O–DO vibration and the excited O–DI- vibration, resulting from the fit. For the two excited states the difference spectra consist of a bleaching of the fundamental 01 absorption and an induced 12 excited-state absorption. The right panel of figure 3 presents the associated population dynamics. It is clearly seen that the excited O–DO and O–DI- states show very different vibrational relaxation time constants of 1.80.2 and 4.6 ps, respectively. The equilibration time constant is 10.2 ps.
To obtain the anisotropy dynamics of the excited O–D stretch vibrations we need to subtract the delay-time dependent contribution of the heated ground state from the measured transient spectra. The spectral response associated with the final heated ground state is observed to be isotropic, meaning that we have to subtract the same amplitude for this spectrum from the measured and . The resulting and are then used to construct the delay-time dependent anisotropy of the O–D stretch vibrations using equation (1). In Fig. 4 we show the thus obtained anisotropy dynamics measured for solutions of different concentrations of NaCl and NaI. For both types of salt solutions it is observed that the anisotropy dynamics become slower with increasing salt concentration. For the NaCl solutions this effect is more pronounced than for the NaI solutions.
The decomposition of the measured transient spectra in O–DO and O–DA- components also enables the determination of the anisotropy dynamics for each of these components separately. To this purpose, we construct the difference spectrum between and . It can easily be shown that is proportional to the weighted sum of the anisotropy values of the different spectral components, the weighing factor of each component given by the product of the spectral amplitude at frequency and the population of the component at delay time :
| (2) |
The spectra and the populations are obtained from the fit of the isotropic data. Using these spectra and populations we can determine the time-dependent anisotropy of each of the contributing spectral components. This approach assumes that the anisotropy dynamics is the same at all frequencies within the spectrum of each component. In this analysis we only need to consider the O–DO and O–DA- spectral components, because the intermediate state has no associated difference spectrum (), and the final heated ground state has zero anisotropy ().
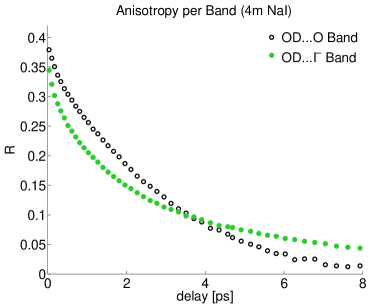
In Fig. 5 the resulting of the O–DO component and of the O–DA- component are shown for a 4 m NaI solution. The dynamics of can be fitted well with a single exponential function with a time constant of 2.5 ps, which means that the anisotropy dynamics of the O–DO oscillators is very similar to the dynamics observed for neat HDO:H2O rezus05 . The dynamics of is seen to deviate strongly from a single exponential function. The dynamics of follow a bi-exponential function with time constants of 20.3 and 92 ps.
In Fig. 6 we compare the curves of solutions of 4 m NaI and 4 m NaCl. It is seen that the dynamics are quite similar, both anisotropy decay curves can be fitted well with a bi-exponential function with time constants of 2 and 9 ps. However, the amplitude of the fast component is larger for the 4 m NaCl solution than for the 4 m NaI solution.
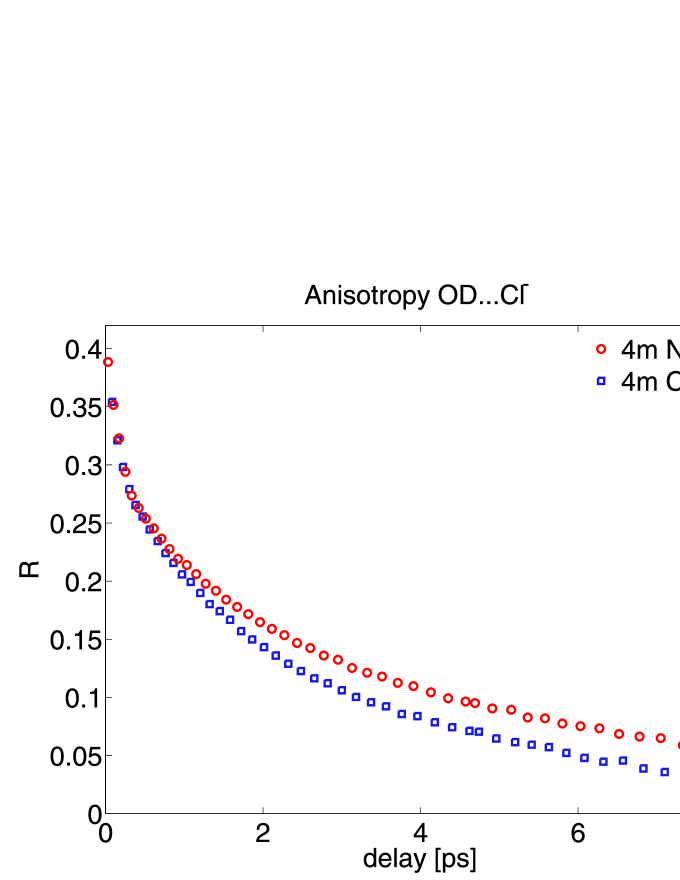
The decay of the anisotropy of the O–DA- oscillators is not due to the rotation of O–D oscillators out of the hydration shell. These oscillators exchange their O–DA- hydrogen bond for an O–DO hydrogen bond and thus no longer contribute to the O–DA- spectral component. Therefore, the rotation out of the hydration shell will only lead to a decay of the amplitude of the O–DA- spectral component, but not of the anisotropy of this component. However, there is an equal number of O–D groups that were excited as O–DO oscillators and have changed their orientation to become O–DA- oscillators. These oscillators will contribute to the measured anisotropy of the O–DA- spectral component. In fact it can be expected that these oscillators will decrease the anisotropy of the O–DA- spectral component because the angle of rotation in the exchange between the hydration shell and the bulk is 55 degrees laagescience06 ; laage07 ; laage08 . The time constants of the exchange are of the order of 10 ps, and thus the switching from the bulk to the hydration shell cannot form the origin of the fast decay of the anisotropy of the O–DCl- and O–DI- spectral components. This switching will however contribute to the slow component of the anisotropy decay. Other effects that can be responsible for the slow decay are the diffusion of the O–D group over the surface of the ion, and the reorientation of the complete hydration shell of the halogenic anion.
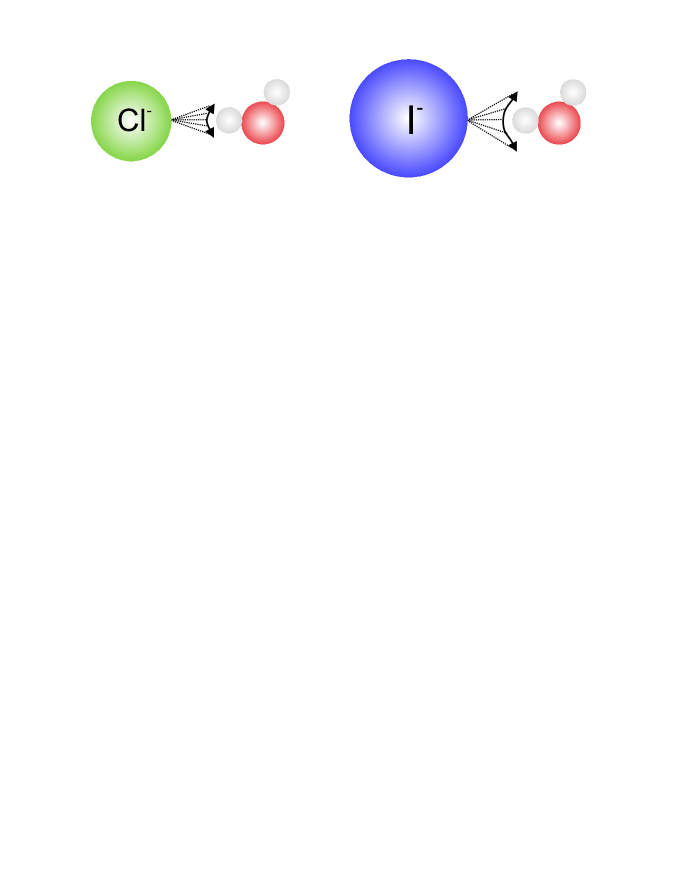
The fast component of the anisotropy decays shown in Fig. 6 is likely due to a wobbling motion of the O–D group that keeps the O–DA- hydrogen bond with the anion intact. The wobbling motion will lead to a partial decay of the anisotropy, and the amplitude of this partial decay is determined by the angular cone of the wobbling motion. The I- ion is much larger than the Cl- ion and thus allows for a larger angular spread of the O–D group while keeping the hydrogen bond intact. The effect of the ion size on the angular cone of the wobbling motion is illustrated in Fig. 7. The wobbling motion will be induced by the translational and orientational motions of the H2O molecules that surround the hydration shell. Therefore, the time constant of the wobbling motion can be expected to be similar to that of the anisotropy decay of the O–DO component. It may be even somewhat faster, as the wobbling of the O–D group in the anion hydration shell does not require the completed reorientation of an O–D group outside the hydration shell. The time constant of the fast decay of the anisotropy of 20.3 ps agrees with this picture.
We thus find that the reorientation of the water molecules in the hydration shells of Cl- and I- possess a significant wobbling component with a time constant that is quite similar to that of the reorientation in bulk liquid water, even at very high concentrations of 4 m. This means that these weakly hydrating anions do not show a strong effect on the dynamics of water. At first sight, the cations show even less effect, the dynamics of the O–DO component includes the water molecules that hydrate the cations, but even for solutions containing high concentrations of K+ and Na+, the dynamics of the O–DO component are very similar to the dynamics observed for neat HDO:H2O. This observation suggests that K+ and Na+ hardly modify the reorientation dynamics of the water molecules in their hydration shells. However, at this point it should be noted that in the present experiments we only study the orientational motions of the hydroxyl groups of the water molecules. Cations do show a strong effect on the reorientation of the dipole moments of the water molecules, as has been observed with dielectric relaxation studies buchner99 ; turton08 . In these studies it was found that cations like Li+, Na+ and Mg2+ fix the orientation of the dipole moment of a number of water molecules in their first hydration shell. The present work demonstrates that the hydroxyl groups of these water molecules remain quite mobile, meaning that these groups must reorient in a propeller-like motion around the dipole that is fixed by the electric field of the cation tielrooij11 .
In previous studies we found that hydrophobic molecular groups strongly affect the reorientation dynamics of water rezus07 ; rezus08 ; tielrooij10b . The addition of amphiphilic molecules to water like trimethylaminoxide (TMAO) and tetramethylurea (TMU) was observed to lead to a strong slowing down of the reorientation dynamics of a number of water molecules. These molecules could be dissolved in water up to high concentrations due to the presence of a polar group in the molecule. At low concentrations, the fraction of slow water scales with the concentration and with the size of the hydrophobic part of the solute. At high concentrations, saturation effects occur which can be very pronounced in case the solutes cluster, as is for instance the case for TMU.
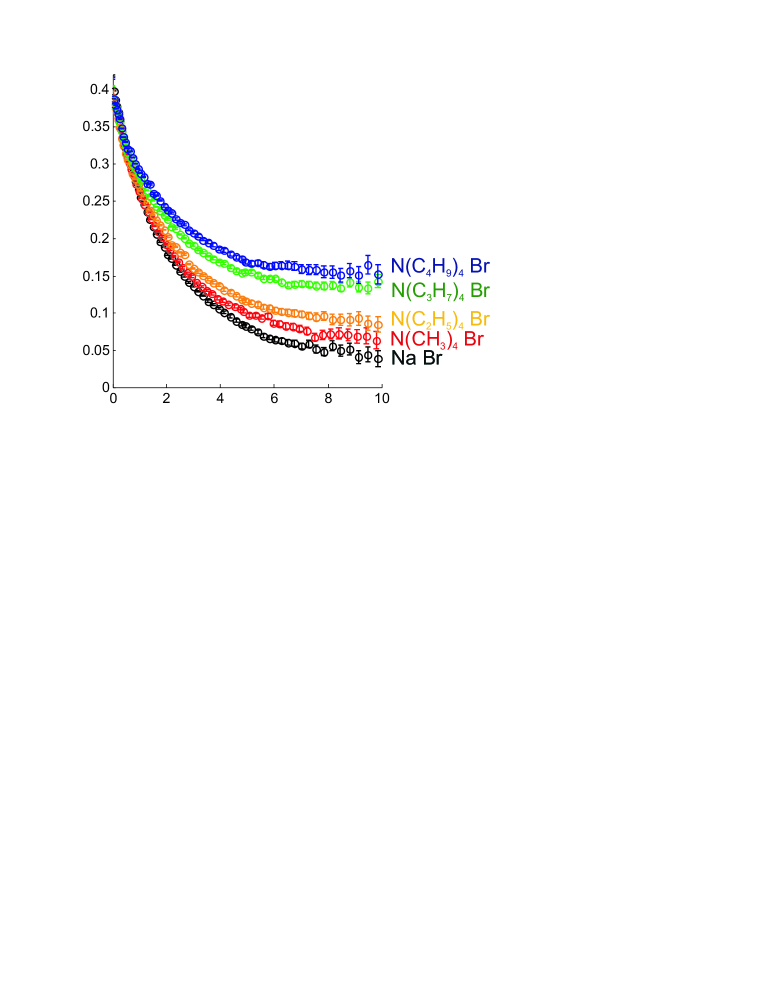
We investigate whether ions containing hydrophobic molecular groups can have similar strong effects on the orientation dynamics of water. In Fig. 8 we show the anisotropy of the O–D stretch vibration of HDO molecules for 1 m solutions of different N(alkyl)4Br (tetra-alkylammoniumbromide) salts in 8% HDO:H2O. These anisotropy curves are obtained in a similar way as the curves of Fig. 4, meaning that the anisotropy is constructed after the measured and have been corrected for the contribution of the ingrowing final heated ground state. For comparison also the anisotropy curve of a 1 m solution of NaBr is shown. The anisotropy curves shown in Fig. 8 include both the anisotropy dynamics of the O–D groups that hydrate the anion, forming O–DBr- hydrogen bonds, and the anisotropy dynamics of the O–D groups that are hydrogen bonded to the oxygen atom of another water molecule, thus forming O–DO hydrogen bonds.
The anisotropy dynamics observed for a 1 m solution of NaBr are very similar to the anisotropy dynamics of neat HDO:H2O, thus confirming that Na+ and a weakly hydrating anion like Br- do not have a strong effect on the reorientation dynamics of the hydroxyl groups of water. In contrast, the N(alkyl)4Br salts do show a strong effect on the reorientation dynamics. Fig. 8 shows that for these solutions there is a fraction of water showing very slow dynamics with a time constant 10 ps. As the Br- ion is not very effective in slowing down the water reorientation, the slow water molecules are most likely hydrating the N(alkyl)4+ cations. The fraction of slow water clearly increases with increasing size of the alkyl groups of the N(alkyl)4+ ion. Based on these observations we conclude that the slow water molecules are hydrating these alkyl groups. Hence, the effects observed of these hydrophobic groups on the dynamics of water are quite similar to the effects we observed before for uncharged amphiphilic solutes like TMAO and TMU rezus07 ; rezus08 ; tielrooij10b . The presence of a positive charge on the N(alkyl)4+ ion apparently does not change the effects of hydrophobic hydration on the dynamics of water.
Unfortunately, we could not analyze the dynamics of the O–DO and the O–DBr- oscillators separately as we did for the NaCl and NaI solutions, because such an analysis requires the anisotropy dynamics to be uniform within each of the components. For N(alkyl)4Br solutions the anisotropy of the O–DO and O–DBr- components appears to be quite strongly frequency dependent. This frequency dependence is likely due to the fact that the solutions containing N(alkyl)4+ ion are strongly heterogeneous and show relatively slow spectral diffusion dynamics, as indicated by their high viscosity. As a result, the water molecules remain in different environments for a long time and their different orientation dynamics do not average out, as was the case for the much less viscous NaCl and NaI solutions.
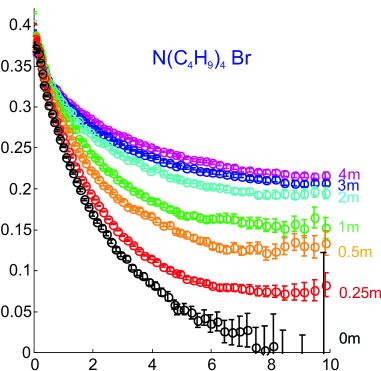
Fig. 9 shows the anisotropy dynamics of the O–D stretch vibration of HDO molecules measured for solutions of N(C4H9)4Br in 8% HDO:H2O of different concentration. It is clearly seen that the fraction of slow water strongly increases with the salt concentration. However, there is a strong saturation effect: the fraction of slow water strongly increases in the concentration interval between 0 and 1 m and only shows a minor further increase in the interval from 2 to 4 m. This saturation of the fraction of slow water points at a clustering of the N(C4H9)4+ ions. As the butyl tails of the ions cluster, less of their surface will be exposed to water, and this will reduce the amount of water being affected in its reorientation dynamics. Apparently, the hydrophobic driving force for clustering of the butyl groups of the N(C4H9)4+ ions is stronger than the coulombic repulsion of the positive charges of these ions.
Conclusions
We studied the effects of ions on the reorientation dynamics of water using polarization-resolved femtosecond mid-infrared pump-probe spectroscopy. In these experiments we probe the anisotropy dynamics of the O–D stretch vibration of HDO molecules of solutions of salts dissolved in 8% HDO:H2O. For solutions of NaCl and NaI we observe a moderate slowing down of the anisotropy dynamics and thus of the reorientation of the water molecules. We were able to distinguish the reorientation dynamics of the O–D groups forming hydrogen bonds to other water molecules from the dynamics of the O–D groups that form a hydrogen bond to the halogenic anion.
The fraction of water molecules forming a hydrogen bond to another water molecule includes the water molecules in the first hydration shells of the Na+ cations. For these water molecules we observe surprisingly little effect of the interactions with the ions on the reorientation dynamics. Even at high salt concentrations, the O–D groups in the hydration shell of Na+ show reorientation dynamics that are quite similar to the dynamics observed for neat liquid water, i.e. the orientational correlation function shows a single exponential decay with a time constant of 2.5 ps. However, previous dielectric relaxation studies showed that Na+ does slow down the reorientation of the dipole moments of the water molecules in the first hydration shell buchner99 ; turton08 . Hence, the hydroxyl groups of these water molecules likely reorient in a propeller-like motion around the water dipoles that are fixed by the electric field of Na+.
The anisotropy of the O–D groups that are hydrogen bonded to Cl- or I- decays on two different time scales. The first time scale of 2 ps is associated with a wobbling motion of the O–D group that keeps the hydrogen bond to the Cl- or I- anion intact. This wobbling motion leads to a partial decay of the anisotropy. The amplitude of this fast component is larger for I- than for Cl-, which can be explained from the fact that the larger I- ion allows for a larger wobbling angle while keeping the hydrogen bond intact, as illustrated in Fig. 7. The second time scale of 9 ps of the anisotropy decay can result from the diffusion motion of the intact O–D group over the surface of the ion, from the reorientation of the complete ion hydration shell, and from the switching of O–D groups into the hydration shell of the anion. In previous studies only the 9 ps component was observed, and from this observation it was concluded that the solvation shell is rather rigid. In this study we could for the first time separate the dynamics of the water molecules in the hydration shell of chloride and iodide from that of the other water molecules at all delay times. We thus find that the dynamics of the water molecules in the hydration shell of chloride and iodide are dominated by a large-amplitude wobbling motion. This is an important result as it demonstrates the deformable character of these hydration shells.
We observe a very strong slowing down of the water reorientation dynamics for solutions of N(alkyl)4Br (tetra-alkylammoniumbromide) salts. For these solutions we observe a fraction of slow water with a reorientation time constant 10 ps. This fraction increases with the concentration of dissolved salt and with the size of the alkyl groups of the N(alkyl)4+ ions. These slow water molecules are thus likely hydrating the hydrophobic parts of the N(alkyl)4+ ions. Hydrophobic molecular groups thus have a very strong effect on the dynamics of water, even when these hydrophobic groups are embedded in an ion. We thus find that the effects of hydrophobic molecular groups on the dynamics of water are much stronger than the electrostatic effects of ions. This is an important result as the influence of hydrophobic and charged groups on water plays a crucial role in the self-organizing dynamics of biomolecular systems like proteins and membranes. For solutions of N(C4H9)4Br (tetra-butylammoniumbromide) we observe a strong saturation effect of the fraction of slow water with concentration, which indicates that these ions cluster, in spite of the coulombic repulsion of the positive charges of the N(C4H9)4+ ions.
Acknowledgements.
This work is part of the research program of the “Stichting voor Fundamenteel Onderzoek der Materie (FOM)”, which is financially supported by the “Nederlandse organisatie voor Wetenschappelijk Onderzoek (NWO)”.References
- (1) A.G. Lee, Biochimica Biophysica Acta 1666 (2004) 62.
- (2) W.M. Cox, J.H. Wolfenden, Proceedings of the Royal Society London, Series A 145 (1934) 486.
- (3) A.W. Omta, M.F. Kropman, S. Woutersen, H.J. Bakker, Science 301 (2003) 347-349.
- (4) J. Smith, R. Saykally, P. Geissler, Journal of the American Chemical Society 129 (2007) 13847.
- (5) R. Mancinelli, A. Botti, F. Bruni, M.A. Ricci,A. Soper, Journal of Physical Chemistry B 111 (2007) 13570.
- (6) D.A. Schmidt, O. Birer, S. Funkner, B.P. Born, R. Gnanasekaran, G.W. Schwaab, D.M. Leitner, M. Havenith, Journal of the American Chemical Society 131 (2009) 18512.
- (7) Y. Lin, B. Auer, J. Skinner, Journal of Chemical Physics 131 (2009) 144511.
- (8) K.-J. Tielrooij, N. Garcia-Araez, M. Bonn, H.J. Bakker, Science 328 (2010) 1006.
- (9) D. Chandler, Nature 437 (2005) 640.
- (10) N. Muller, Accounts of Chemical Research 23 (1990) 23.
- (11) Y.L.A. Rezus, H.J. Bakker, Journal of Physical Chemistry A 112 (2008) 2355.
- (12) C. Petersen, H.J. Bakker, Journal of Chemical Physics 130 (2009) 214511.
- (13) D. Laage, G. Stirnemann, J.T. Hynes, Journal of Physical Chemistry B 113 (2009) 2428.
- (14) M.F. Kropman, H.J. Bakker, Journal of Chemical Physics 115 (2001) 8942.
- (15) S. Park, M.D. Fayer, Proceedings of the National Academy of Science USA 104 (2007) 16731.
- (16) P.A. Bergstrom, J. Lindgren, O. Kristiansson, Journal of Physical Chemistry 95 (1991) 8575.
- (17) Y.L.A. Rezus, H.J. Bakker, Journal of Chemical Physics 123 (2005) 114502.
- (18) D.E. Moilanen, D. Wong, D.E. Rosenfeld, E.E. Fenn, M.D. Fayer, Proceedings of the National Academy of Science USA 106 (2009) 375.
- (19) M. Ji, M. Odelius, K. Gaffney, Science 328 (2010) 1003.
- (20) K.J. Gaffney, M. Ji, M. Odelius, S. Park, Z. Sun, Chemical Physics Letters 504 (2011) 1.
- (21) D. Laage, J.T. Hynes, Science 311 (2006) 832.
- (22) D. Laage, J.T. Hynes, Proceedings of the National Academy of Science USA 104 (2007) 11167.
- (23) D. Laage, J.T. Hynes, Journal of Physical Chemistry B 112 (2008) 7697.
- (24) R. Buchner, S. Capewell, G. Hefter, P. May, Journal of Physical Chemistry B 103 (1999) 1185.
- (25) D.A. Turton, J. Hunger, G. Hefter, R. Buchner, K. Wynne, Journal of Chemical Physics 128 (2008) 161102.
- (26) K.-J. Tielrooij, S.T. van der Post, J. Hunger, M. Bonn, H.J. Bakker, Journal of Physical Chemistry B 115 (2011) 12638.
- (27) Y.L.A. Rezus, H.J. Bakker, Physical Review Letters 99 (2007) 99 148301.
- (28) Y.L.A. Rezus, H.J. Bakker, Journal of Physical Chemistry A 112 (2008) 2355.
- (29) K.-J. Tielrooij, J. Hunger, R. Buchner, M. Bonn, H.J. Bakker, Journal of the American Chemical Society 132 (2010) 15671.