Two-dimensional visualization of cluster beams by microchannel plates
Abstract
An advanced technique for a two-dimensional real time visualization of cluster beams in vacuum as well as of the overlap volume of cluster beams with particle accelerator beams is presented. The detection system consists of an array of microchannel plates (MCP) in combination with a phosphor screen which is read out by a CCD camera. This setup together with the ionization of a cluster beam by an electron or ion beam allows for spatial resolved investigations of the cluster beam position, size, and intensity. Moreover, since electrically uncharged clusters remain undetected, the operation in an internal beam experiment opens the way to monitor the overlap region and thus the position and size of an accelerator beam crossing an originally electrically neutral cluster jet. The observed intensity distribution of the recorded image is directly proportional to the convolution of the spatial ion beam and cluster beam intensities and is by this a direct measure of the two-dimensional luminosity distribution. This information can directly be used for the reconstruction of vertex positions as well as for an input for numerical simulations of the reaction zone. The spatial resolution of the images are dominated by the granularity of the complete MCP device and was found to be in the order of .
keywords:
cluster beam , internal target , cluster , microchannel plate , beam visualization1 Introduction
Cluster beams can be produced and prepared from originally solid, liquid or gaseous materials and are widely used in modern physics experiments. Prominent examples for this are cluster jet beams as internal targets for storage ring experiments [1, 2, 3, 4] or interaction studies of high-intense laser beams with streams of clusters [5]. Of special interest are cluster beams produced via expansion of cooled gases or liquids in Laval nozzles by either condensation of the gas or by breaking up the liquid into a spray of droplets. Depending on the production parameters these clusters typically consist of molecules [6, 7]. Target streams for experiments can be provided with freely adjustable target thickness over several orders of magnitude up to about in a distance of more than behind the nozzle [4]. Due to the high mass of the individual clusters compared to the residual gas background they can travel over several meters through an ultra high vacuum chamber with a constant angular divergence defined by the orifices used for the cluster beam preparation. This fact is of high interest if the experimental setup, e.g. of a cluster target at an accelerator facility, requires large distances between the cluster generator and both the scattering chamber and the cluster beam dump. Especially in this case with large distances a careful cluster target beam alignment is mandatory and suitable devices for this are of interest.
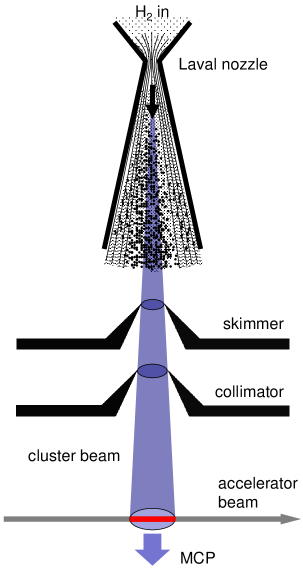
A further important quantity in scattering experiments using cluster beams as targets, e.g. for accelerated ion beams, is the spatial distribution of the interaction region as well as its variation with time. Here a precise knowledge of this information might be needed, e.g. for the reconstruction of the tracks of the ejectiles produced in the interaction volume or for realistic Monte-Carlo computer simulations for the reactions of interest. One possibility to gain such information about the vertex volume might be the investigation of fluorescence light produced by excitation of atoms/molecules of the target beams by the passing ions. However, this method commonly requires an optical access to the interaction point which might be difficult or even not be possible for modern compact -detectors such as the planned ANDA detector at FAIR in Darmstadt [8]. Alternatively the required vertex information might be reconstructed by separate investigations on the accelerator beam profile, e.g. using a fluorescence light measurements [9, 10] of (residual) gas close to the interaction region, in combination with a measurement on the cluster target beam profile. In order to quantify the geometrical size and/or the intensity of a cluster beam at the interaction point of an experiment, different approaches can be followed. One commonly applied technique for cluster beams from originally gaseous materials is the use of thin scanning rods in one of the differentially pumped vacuum stages. The principle of this method is shown in Fig. 1.
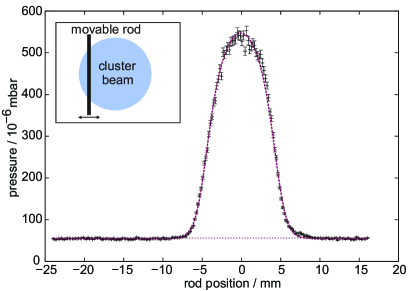
A movable rod scans the cluster beam in the vacuum chamber and as soon as the rod interacts with the cluster stream the clusters of the overlap region are stopped and converted into an additional gas background. The resulting gas load to the vacuum chamber can easily be measured by vacuum gauges and is directly proportional to the cluster beam density. Furthermore, with the known rod dimensions and the recorded pressure rise as a function of the rod position, information about the cluster beam diameter and the local target thickness can be extracted [4]. With this method only one-dimensional scans are possible which result in data averaged over the rod axis. In addition, depending on the used vacuum gauge and its possible read out speed, one single cluster profile measurement might take, e.g. one minute, if a sufficient spatial resolution is required. To overcome the previously described limitations, a method based on a microchannel plate device (MCP) has been implemented. It allows for a precise cluster target beam position measurement and adjustment, to measure in real time two-dimensional cluster beam intensity distributions as well as to monitor the spatial distribution of the vertex point if the cluster target is used in combination with an accelerator beam.
The principle of operation and the properties of this device are demonstrated here by data obtained with hydrogen cluster beams. While electrically neutral clusters shot directly onto a MCP device remain undetected, ionized clusters, e.g. produced by electron impact, can be registered by this system. Therefore, the complete cluster beam cross section can be investigated. If the MCP signal is read out by a phosphor screen and a CCD camera, the time needed to measure one cluster beam image is typically only limited by the required exposure time of the CCD camera in order to collect a sufficient amount of photons. However, this time might be reduced, e.g. to a few seconds, if the electron current for cluster ionization is adjusted correspondingly. The presented system is routinely in operation as diagnostic system at a hydrogen cluster beam installation at the University of Münster. Furthermore, with this device it was possible to visualize and monitor the interaction region of a hydrogen cluster target beam and a proton beam in a storage ring experiment. In this case the ionization of the originally electrically neutral cluster beam resulted from the energy loss processes of the ion beam in the cluster beam.
2 Experimental setup
A hydrogen cluster beam is produced via adiabatic expansion of pre-cooled and compressed hydrogen in a Laval nozzle. Details about the cluster jet generator, the experimental setup as well as the operational parameters are presented in Ref. [4]. Shortly behind the cluster generator the cluster beam is ionized by an electron gun which can be operated in a continuous mode or, if a timing information is needed, in a pulsed mode. At the crossing point of cluster and electron beams, i.e. behind the nozzle, the diameter of the electron beam amounts to approximately and is larger than the cluster beam, i.e. 4 mm, at that position. By this a complete coverage of the hydrogen beam is guaranteed. The current of the electron beam is adjusted to the experimental needs, e.g. to the required intensity of ionized clusters, and is typically in the order of a few microampere. At the interaction point clusters with both negative and positive charges are produced from which in the following only the positively charged ones are further considered. After a drift path of approximately , measured from the position of the electron beam, the ionized beam is shot onto the MCP based detection system. A schematic view of this device as well as the electrical circuit is shown in Fig. 2.
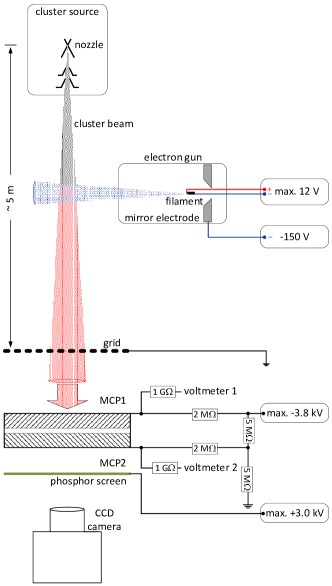
The cluster beam, indicated by a vertical cone, passes an electrically grounded grid with a spacing of and hits a microchannel plate in Chevron assembly. While depending on the operational parameters of the cluster jet generator the individual clusters have originally velocities in the order of [4, 11, 12] before entering the detector, the positively electrically charged clusters are accelerated after passing the grid due to the potential of up to at the entrance surface of the MCP. By this the kinetic energy of the clusters is high enough to produce primary electrons which can be multiplied within the MCP device. The cluster beam itself is stopped at the surface of the MCP, converted into residual gas and is pumped away by a turbomolecular pump. Directly behind the MCP a phosphor screen at a potential of is placed which is hit by the electrons from the MCP. The resulting image can be observed by a CCD camera behind an UHV window outside of the vacuum.
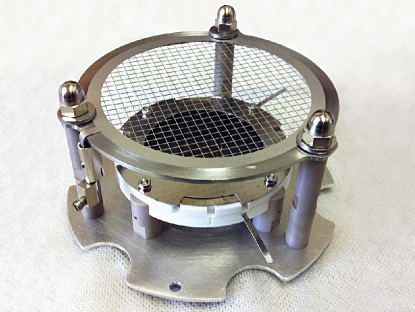
In Fig. 3 a photography of the MCP device with the entrance grid is shown. The MCP (dark area below the grid) with a gain of has an active diameter of and a pore diameter of . The adapted phosphor screen is of the type P43 which produces photons of green color. The entrance grid was produced by a commercial etching procedure with a bar width of .
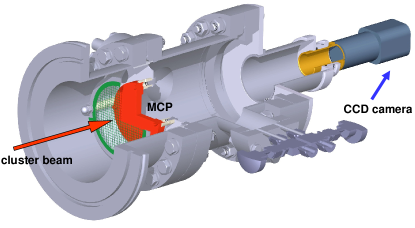
In Fig. 4 a schematic view of the complete setup is displayed, showing the final vacuum stage with the MCP detection system as well as the CCD camera.
3 Visualization of cluster beams
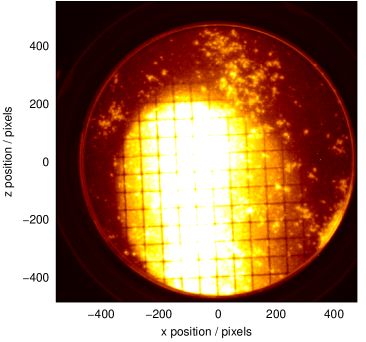
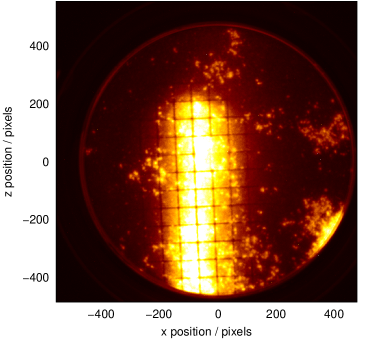
To investigate the possibility to measure two-dimensional cluster beam density profiles, cluster beams with different geometries have been prepared by using special shaped collimators, placed behind the nozzle [13]. In Fig. 5 (top) microscopic views of two different collimators are shown which have been fabricated by laser cutting of stainless steel cones. The constant angular divergences of the cluster beams passing these orifices are determined by the size of the collimator openings as well as the distance between the nozzle and the collimator. This in turn determines the sizes of the cluster beams at the following vacuum chambers as well as at the position of the MCP assembly.
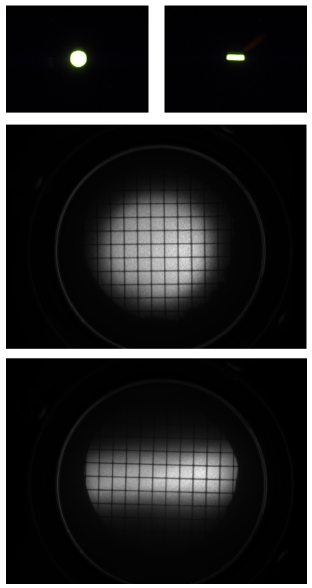
The resulting images recorded by the MCP system are presented by the lower pictures of Fig. 5 [14]. The clearly visible grid spacing allows for a direct measurement of the cluster beam size at that distance from the nozzle, i.e. after approximately . While the round shaped cluster beam, prepared by a collimator with a diameter of , is fully visible by the MCP system, the rectangular shaped beam is not fully detected in one direction due to the use of a collimator with a width of . By this a part of the large cluster beam is cut away by an orifice inside of the beam dump stage which is located directly in front of the MCP system. The shape of this internal orifice is clearly visible. Thus this kind of detector allows also for an online monitoring of the target beam adjustment and interferences, e.g. with vacuum components. The observed boundary smearing of the cluster beam is in full agreement with earlier findings using the scanning method with moveable rods (see Fig. 1).
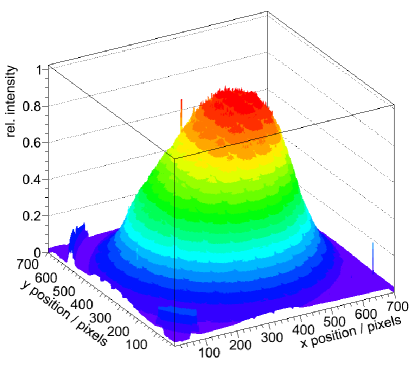
For a more quantitative analysis of the recorded figures the two-dimensional intensity distributions have been analyzed. Fig. 6 shows exemplary the result for the circular cluster beam shown in Fig. 5. Here the - and -axes correspond to the directions perpendicular to the spread direction of the cluster beam. By using a homogeneously distributed electron beam for the cluster ionization, the intensity distribution observed with the MCP device is a direct measure for the local cluster beam intensity. A closer investigation of the intensity distribution exposes a slight asymmetry which might be caused by the not yet perfectly adjusted relative position of the two collimators in the cluster source. Therefore, the MCP device presented here is highly suited for online collimator adjustment purposes during the preparation of cluster beams, e.g. for hadron physics experiments.
To gain further information about the quality of the spatial resolution of the MCP system, one of the scanning rods of the monitor system with a diameter of located at the scattering chamber, i.e. behind the nozzle, was placed at a fixed position within the passing cluster beam. Fig. 7 (top) shows the extracted MCP image obtained at a distance of behind the nozzle. In addition to the already described cluster beam image a sharp-edged shadow of the rod is clearly visible. To extract information about the spatial resolution of the MCP device, a projection of this two-dimensional intensity image was determined and is displayed in Fig. 7 (bottom).
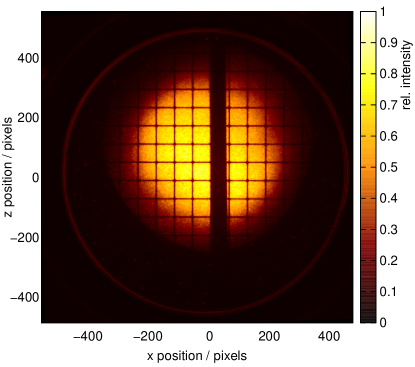
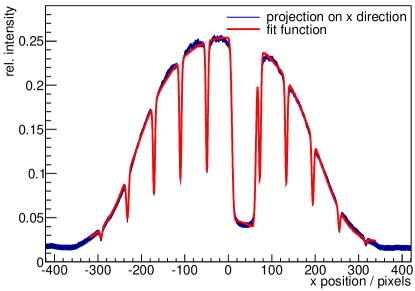
The recorded data points are given by the blue line and the shape of the envelope is in good agreement with the expected shape of a profile of a circular cluster beam known from the scanning rod method (see Fig. 1). The narrow intensity drops are a result of the regular grid structure and by this an absolute spatial calibration of the MCP monitor was possible.
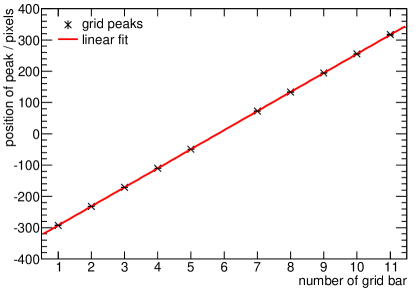
In Fig. 8 the measured position in units of the CCD camera pixels of the intensity drops is shown. As expected the data can be described well by a first order polynomial function and expose by this no signal for a non-linearity. With the pixel information of the CCD camera and the known grid bar distance of (center-to-center) the calibration factor was determined to be . Moreover, since the shape of the narrow intensity drops is given by a convolution of the known grid bar width of and the intrinsic resolution of the MCP detector itself, the latter information can be extracted from a fit to the displayed data. An excellent description of the intensity drops was achieved by a pure Gaussian distribution with a width of (RMS), representing an upper limit for the intrinsic resolution of the MCP detector. Furthermore, the broad minimum visible in Fig. 7 (bottom) is a result of the scanning rod placed inside of the cluster beam. While the total width allows for a reconstruction of the rod size, an even more interesting information is given by the shape of the steep intensity drops from the rod itself. Again a good description of the data was possible by a convolution of a rectangular rod geometry and a Gaussian detection resolution . Here it must be noted that the latter resolution combines contributions from the already determined intrinsic resolution of the MCP detector, i.e. , and additional effects such as possible stray fields influencing the trajectories of the ionized cluster beam or minor divergences of the cluster beam itself. The best description of the data is shown by the red line and considers a detection resolution of (RMS) in addition to the known numbers for , , . Thus, the resolution for the detection of structures in the cluster beam or of a possible displacement at the position of the scattering chamber, i.e. behind the nozzle, can be estimated to be better than
| (1) |
Therefore, the MCP monitor device presented here is highly suited for the observation and the quantitative investigations of cluster beams used as target beams, e.g. in hadron physics experiments at storage rings or at high power laser facilities.
4 Visualization of the beam-target vertex region in accelerator experiments
The capability of the previously described MCP monitor device to detect spatially-resolved ionized clusters opens further possibilities for its use in combination with cluster beams as targets, e.g. in storage ring experiments. One valuable real time information which can be extracted quantitatively is the size of the vertex region, i.e. the interaction volume of the accelerated ion beam with the cluster beam. A sketch of the operation principle is given in Fig. 9.
A cluster beam, produced in a Laval nozzle and prepared by a set of one skimmer and one collimator, enters the scattering chamber of the particle accelerator and is hit by the ion beam. Due to energy loss processes, e.g. based on Coulomb effects, a certain fraction of the cluster beam of the overlap volume is ionized by the ion beam while the part of the cluster beam not hit by the ions remains in an electrically neutral state. The partially ionized cluster beam enters behind the scattering chamber the beam dump stage where the previously described MCP monitor can be placed. Since only clusters from the interaction volume are ionized, solely clusters from this region are expected to give a contribution to the resulting image.
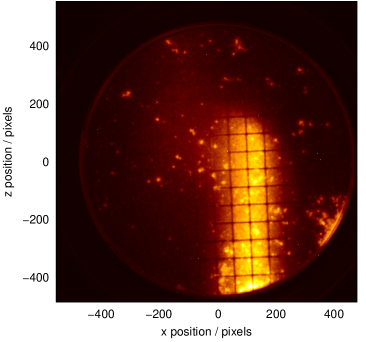
A feasibility study of this method has been performed [15] during a few hours of an out of turn beam time at the ANKE experimental facility [16] which is installed at an internal target position of the cooler synchrotron COSY [17] at the Forschungszentrum Jülich. At ANKE a cluster jet target is installed which provides hydrogen cluster target thicknesses of up to in a distance of behind the nozzle in combination with a target diameter of approximately . For the studies presented here the final turbomolecular pump of the beam dump stage was replaced by the described MCP monitoring device and a thin cluster jet beam was produced with . The COSY accelerator was operated in a mode where low energetic protons, injected with a momentum of , where stored and accelerated up to a beam momentum of . After a cycle length of the proton beam was dumped and new cycles with the same time structure and with newly injected protons followed. In Fig. 10 (top) an image recorded with the MCP device is shown which was obtained during the acceleration of the COSY beam. The exposure time of the CCD camera was set to . A bright area is visible which corresponds to clusters ionized by the accelerator beam. The vertical axis (”z-position”) corresponds to the ion beam direction while the horizontal axis (”x-position”) corresponds to the one transverse to the beam direction. Note that the COSY beam has a comparably broad diameter during the acceleration due to the low proton momentum shortly after the injection. In the second figure (Fig. 10, center) an image is shown which was recorded when the final COSY momentum was reached, i.e. . Due to the adiabatic cooling of the accelerator beam the transverse diameter of the ion beam shrunk which can be seen directly. In a next step one steering magnet in front of the ANKE scattering chamber was switched on in order to allow for a shift of the COSY beam transverse to its flight direction. The resulting image is shown in Fig. 10 (bottom) where a clear displacement is visible. The lower intensity is only an artifact due to a lower proton beam intensity during this measurement. Therefore, this series of measurements proofs that a direct observation of the interaction vertex is possible by such a MCP device.
For a more quantitative investigation a series of 145 images recorded at has been analyzed and combined in one averaged image. The resulting image and a projection on the transverse axis is shown in Fig. 11. Note that for the measurements presented here a grid was used where four joining grid bars in the center of this electrode where removed (see Fig. 11). However, this fact is of no relevance for the further discussion.
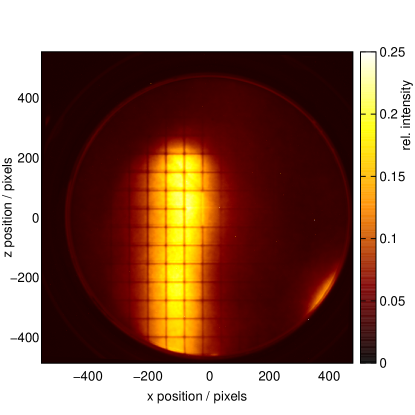
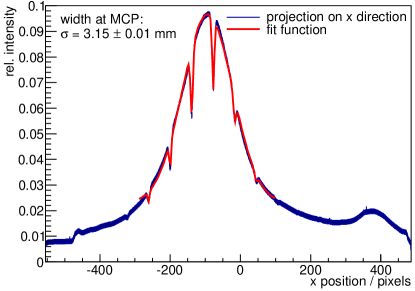
Due to time limitations of the measurement the MCP device could not be aligned perfectly relative to the cluster beam axis, which resulted in the fact that the signal is not in the center of the MCP screen. Nevertheless, solid quantitative information about the vertex region can be gained with good accuracy. The obtained data (blue line) can be described well by the assumption of a Gaussian intensity distribution with a width of (RMS). Here again the well understood small intensity drops are caused by the grid structure, which can be treated as described above. Since the cluster beam has a constant angular divergence given by the size of the collimator of the cluster source and its distance from the nozzle, the width of the COSY beam can be reconstructed by simple geometrical considerations. With the knowledge of the distance between the nozzle and the vertex point in the scattering chamber of and the distance between the nozzle and the MCP of , the width of the COSY beam in the scattering chamber can be written as:
| (2) |
Thus the width of the COSY beam at the vertex point could be estimated to be approximately (RMS) which is in good agreement with the expected accelerator beam size [18]. Due to the not ideal experimental conditions no uncertainties are given here. However, based on the achieved results a precision for the determination of the vertex size is conservatively expected to be in the order of (RMS).
5 Extended applications
In addition to the use of the MCP device presented here as a monitor for the time resolved, two-dimensional investigation of both the cluster beam thickness and the vertex size distributions, further applications are possible. If an adjustable positive retardation potential is applied to the entrance grid instead of the grounding, this device works as an energy filter for the impinging ionized clusters with positive charge. Depending on the stagnation parameters of the fluid before entering the Laval nozzle, the produced hydrogen clusters typically have a mean speed of . The width of the velocity distribution also depends on the stagnation parameters and was observed to be in the range of = 0.5% to 8%. For details see Ref. [4, 11, 12]. By investigating the intensity variation recorded by the CCD camera as a function of the retardation potential , information about the masses of the ionized clusters can be gained. In detail clusters of charge with a mass below
| (3) |
can be reflected. This opens the possibility to investigate the mass distribution of cluster target beams, e.g. as function of the stagnation parameters or of the nozzle geometry, in parallel to the operation as target in experiments. Assuming, for example, a retardation voltage of and a cluster velocity of , clusters masses of up to can be investigated. Moreover, by comparing the obtained distributions with and without an accelerator beam passing the cluster beam, information about a possible fragmentation of clusters caused by the ion beam can be gained. First pilot studies on cluster mass measurements with this device and using the described cluster target have been performed successfully and are followed by extensive systematic investigations [19].
6 Summary
In summary we have presented an advanced technique which enables, for the first time, the two-dimensional real time visualization of cluster target beams as well as of vertex regions at internal beam experiments at particle accelerators. The system is based on a microchannel plate array in combination with a phosphor screen which is read out by a CCD camera. Full, time resolved, two-dimensional information about the cluster beam thickness distribution are accessible if a dedicated electron gun is switched on. A spatial resolution in the order of has been reached which allows for quantitative investigations on the size, shape and thickness distribution of the cluster beams itself. In addition it has been demonstrated that this device allows for a detailed two-dimensional investigation of the vertex region at storage ring experiments using internal cluster jet targets. Here the ionization of the clusters proceeds solely by the passing ion beam if the previously used electron beam is switched off. With this device a resolution of approximately was achieved. The method presented here can principally also be used for further applications, e.g. for laser-cluster interactions, where electrically charged clusters are produced, or for the cluster mass investigation.
Acknowledgements
The authors would like to thank the COSY crew for the outstanding support and for the possibility to perform the presented test measurements. We acknowledge the excellent work done by our mechanical and electronic workshop. The research project was supported by BMBF (06MS253I, 06MS9149I/05P09MMFP8, 06MS7190I/05P12PMFP5), GSI F&E program (MSKHOU1012), EU/FP6 HADRONPHYSICS (506078), EU/FP7 HADRONPHYSICS2 (227431) and EU/FP7 HADRONPHYSICS3 (283286).
References
References
- [1] C. Ekström, Nucl. Instr. and Meth. A 362 (1995) 1–15.
- [2] H. Dombrowski, et al., Nucl. Instr. and Meth. A 386 (2-3) (1997) 228–234.
- [3] D. Allspach, et al., Nucl. Instr. and Meth. A 410 (2) (1998) 195–205.
- [4] A. Täschner, et al., Nucl. Instr. and Meth. A 660 (2011) 22–30.
- [5] Z. Li, et al., Chinese Phys. 15 (2006) 697.
- [6] E. Knuth, F. Schunemann, J. P. Toennies, J. Chem. Phys. 102 (15) (1995) 6258–6271.
- [7] S. General, Diploma thesis, Westfälische Wilhelms-Universität Münster, Germany (2008).
- [8] PANDA Collaboration, Technical Progress Report - Strong Interaction Studies with Antiprotons, FAIR (February 2005).
- [9] K. Satou, N. Hayashi, Proc. of EPAC 2006, Edinburgh, (2006) TUPCH065.
- [10] T. Tsang, et al., Rev. Sci. Instrum. 79(10) (2008) 105103.
- [11] E. Köhler, Diploma thesis, Westfälische Wilhelms-Universität Münster, Germany (2010).
- [12] A. Täschner, Doctoral thesis, Westfälische Wilhelms-Universität Münster, Germany (2012).
- [13] A.-K. Hergemöller, Master thesis, Westfälische Wilhelms-Universität Münster, Germany (2013).
- [14] E. Köhler, et al., GSI-SR2012-PHN-HSD-EXP-12, GSI Scientific Report 2012, GSI Report 2013-1, GSI (2013).
- [15] E. Köhler, et al., GSI-SR2012-PHN-HSD-EXP-13, GSI Scientific Report 2012, GSI Report 2013-1, GSI (2013).
- [16] S. Barsov, et al., Nucl. Instr. and Meth. A 462 (2001) 364–381.
- [17] R. Maier, et al., Nucl. Instr. and Meth. A 390 (1997) 1–8.
- [18] D. Prasuhn, private communication (2012).
- [19] E. Köhler, Doctoral thesis, Westfälische Wilhelms-Universität Münster, Germany (in preparation).