XMM-Newton and Swift spectroscopy of the newly discovered very-faint X-ray transient IGR J17494–3030
Abstract
A growing group of low-mass X-ray binaries are found to be accreting at very-faint X-ray luminosities of erg s-1 (2–10 keV). Once such system is the new X-ray transient IGR J17494–3030. We present Swift and XMM-Newton observations obtained during its 2012 discovery outburst. The Swift observations trace the peak of the outburst, which reached a luminosity of (D/8 kpc)2 erg s-1 (2–10 keV). The XMM-Newton data were obtained when the outburst had decayed to an intensity of (D/8 kpc)2 erg s-1. The spectrum can be described by a power-law with an index of and requires an additional soft component with a blackbody temperature of 0.37 keV (contributing 20% to the total unabsorbed flux in the 0.5–10 keV band). Given the similarities with high-quality spectra of very-faint neutron star low-mass X-ray binaries, we suggest that the compact primary in IGR J17494–3030 is a neutron star. Interestingly, the source intensity decreased rapidly during the 12 hr XMM-Newton observation, which was accompanied by a decrease in inferred temperature. We interpret the soft spectral component as arising from the neutron star surface due to low-level accretion, and propose that the observed decline in intensity was the result of a decrease in the mass-accretion rate onto the neutron star.
keywords:
accretion, accretion discs - stars: individuals (IGR J17494–3030)1 Introduction
Low mass X-ray binaries (LMXBs) are composed of a black hole or a neutron star that accretes material from a (sub) solar companion star that overflows its Roche lobe. A large fraction of LMXBs remain in a dim quiescence state, during which no or very little accretion occurs and the X-ray luminosity () is . However, once in a while, the sources experience outburst events in which their accretion rate increases drastically and consequently their X-ray brightness as well. LMXBs can be classified depending on the maximum 2–10 keV luminosity () that they reach. Those systems that can obtain of are called (very–)bright systems. The faint ones can reach , and the sources that display of only are called very faint X-ray binaries (VFXBs; Wijnands et al., 2006). Despite significant progress over the last few years in our understanding of the behavior of those VFXBs (Muno et al., 2005; Campana, 2009; Degenaar & Wijnands, 2009, 2010; Armas Padilla et al., 2011; Armas Padilla et al., 2013a; Armas Padilla et al., 2013b), much remains unclear about them (e.g., the mechanism behind their low luminosities is not understood).
One recently discovered VFXB is IGR J17494–3030. The source was first detected during the Galactic centre INTEGRAL observation performed on March 17–19, 2012 (Boissay et al., 2012). Multiple Swift X-ray telescope (XRT) observations were obtained (Bozzo et al., 2012) but 27 days after the source was first detected, it could not be detected anymore using Chandra (Chakrabarty et al., 2013). Inspecting the near–infrared (NIR) images acquired on July 2010 as part of the NIR VVV survey (Minniti et al., 2010), five sources could be identified within the Swift/XRT error circle. Those sources are potential candidates for the quiescent NIR counterpart of IGR J17494–3030 although it cannot be excluded that none of those sources is associated with the source. In this Letter we present the analysis of four Swift observations and our XMM-Newton observation of IGR J17494–3030 obtained during the outburst decay phase.
2 Observations and reduction
| Satellite/Instrument | Mode | Observation ID | Date | Exposure time | Count rate | Net count ratea |
|---|---|---|---|---|---|---|
| (yyyy-mm-dd) | (ks) | (counts s-1) | (counts s-1) | |||
| Swift/XRT | PC | 00032318001 | 2012-03-20 | 1.0 | 0.93 | 0.35 |
| Swift/XRT | WT | 00032318002 | 2012-03-23 | 1.0 | 1.89 | 1.63 |
| Swift/XRT | PC | 00032318003 | 2012-03-26 | 0.6 | 0.80 | 0.39 |
| Swift/XRT | PC | 00032318004 | 2012-03-30 | 1.1 | 0.28 | 0.28 |
| XMM-Newton/EPIC | 0694040201 | 2012-03-31 | 43.9 | |||
| (MOS1) | Imaging | 0.44 | 0.38 | |||
| (MOS2) | Imaging | 0.44 | 0.38 | |||
| (PN) | Timing | 1.34 | 0.98 |
-
a
Count rate after background correction, using the annulus regions to mitigate the pile-up in Swift obs 00032318001 and 00032318003, and after excluding a short episode of background flaring observed during the XMM-Newton observation.
2.1 XMM-Newton data
IGR J17494–3030 was observed with XMM-Newton (Jansen et al., 2001) on 2012 March 31 for ks (see Tab. 1). The European Photon Imaging Camera (EPIC) on board of XMM-Newton consists of two MOS cameras (Turner et al., 2001) and one PN camera (Strüder et al., 2001). They were operated in imaging (full frame window) and timing mode, respectively. We reduced the data and obtained scientific products using the Science Analysis Software (SAS, v. 13.0).
We filtered out an episode of background flaring by only selecting data for which the high-energy count rate was 0.25 counts s-1 ( keV) for the MOS cameras and 0.2 counts s-1 (10–12 keV) for the PN. The total resulting live time is ksec for the MOS cameras and ksec for the PN detector. For the MOS cameras, we extracted the source event file using a circular region centred on the source position and with a radius of ; the background was extracted using a circular region with a radius of centred on a source-free region. The MOS source count rate (Tab. 1) is below the 0.7 pile-up threshold111See Table 3 in Section 3.2.2 of the XMM-Newton Handbook: http://heasarc.gsfc.nasa.gov/docs/xmm/uhb/epicmode.html. After correcting the PN data for the transfer inefficiency that affects data obtained using the timing modes222See the calibration technical note XMM-SOC-CALTN-0083, we extracted the source and background events by selecting the data with RAWX columns [32:42] and [5:12], respectively. The PN source count rate (Tab. 1) is much lower that the pile–up limit of 800 for the PN timing mode1. We generated the spectra and the light curves as well as the response files applying the standard analysis threads. We grouped the spectra to contain a minimum of 25 photons per bin and rebinned the data to not to oversample the intrinsic energy resolution by a factor larger than 3.
2.2 Swift data
A total of 4 observations were obtained of IGR J17494–3030 with the XRT (Burrows et al. 2005) on board Swift (Gehrels et al., 2004). Three observations were performed in photon counting (PC) mode and one in windowed timing (WT) mode (Table 1). We processed the data making use of the HEASoft v.6.12 software. The data reduction was carried out running the xrtpipeline task. For every observation, spectra, lightcurves and images were obtained using Xselect. For the WT data we used a circular region radius of centred on the source position to extract the source events, and a similar region far enough from the source to extract the background events. For the PC data, we used a circular region of centred on the source position to extract the source events, and three circular regions of similar size for the background data. Observations 00032318001 and 00032318003 are affected by pile–up. To mitigate the pile–up effects, we excluded the inner (observation 00032318001) and (00032318003) from the central part of the source regions. We created exposure maps and ancillary response files following the standard Swift analysis threads and we acquired the last version of the response matrix files from the HEASARC calibration data base (v.14). We grouped the spectra to have at least 20 counts per bin.
3 Analysis and Results
3.1 Spectral Analysis
| Instrument/ | (dof) | |||||||
|---|---|---|---|---|---|---|---|---|
| Obs ID | ( ) | (keV) | (%) | ( ) | ( ) | |||
| Swift/XRT | phabs*(powerlaw) | |||||||
| 00032318001 | 1.8 (fix) | – | – | 0.99 (15) | ||||
| 00032318002 | 1.8 (fix) | – | – | 0.98 (79) | ||||
| 00032318003 | 1.8 (fix) | – | – | 0.53 (9) | ||||
| 00032318004 | 1.8 (fix) | – | – | 0.92 (13) | ||||
| XMM/EPIC | phabs*(powerlaw+bbodyrad) | |||||||
| 0694040201 | 17.3 | 0.94 (419) | ||||||
| phabs*(powerlaw+nsatmos) | ||||||||
| 22.9 | 0.94 (420) | |||||||
-
Note. – Quoted errors represent 90% confidence levels. The fifth column reflects the fractional contribution of the thermal component to the total unabsorbed 0.5–10 keV flux. and represent the absorbed and unabsorbed fluxes (0.5–10 keV), respectively. The luminosity (0.5–10 keV) was calculated adopting a distance of 8 kpc. The for the NSATMOS model is for an observer in infinity.
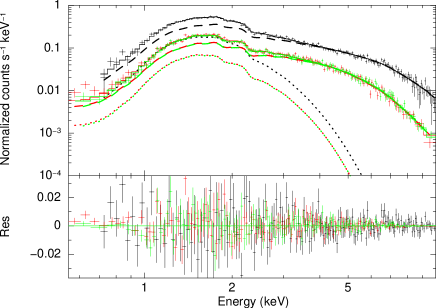
We used XSpec (v.12.8; Arnaud, 1996) to fit the spectra. We incorporated in our models the photoelectric absorption component (phabs) to account for the interstellar absorption. We simultaneously fitted the spectra obtained with the different XMM-Newton/EPIC detectors; the two MOS spectra were fitted in the energy range 0.5-10 keV and the PN spectrum in the 0.7–10 keV range. We tied all the parameters between the three detectors and introduced a constant factor (constant) to account for cross calibration uncertainties between the instruments. It was fixed to one for the PN spectrum and allowed to vary freely for the MOS ones. A single power–law (powerlaw) model returns an hydrogen column density (NH) of and a power–law photon index () of 2.14. However, with a reduced () of 1.28 for 421 degrees of freedom (dof) the fit is not acceptable. Adding a soft blackbody component (bbodyrad) to the power-law model improves the fit. The resulting spectra with the best fit model are shown in Figure 1.
This two components model adequately fits the spectra (=0.94 for 419 dof), yielding NH=, =1.76 and kT=0.37 keV (blackbody temperature). The inferred 0.5–10 keV unabsorbed flux is , of which 17% is due to the thermal component. The full results of the fits are summarized in Table 2, in which the parameter errors are given with 90% of confidence level and the flux errors were calculated as described by Wijnands et al. (2004). Although the source distance is unknown, the fact that the source position is close to the Galactic center (l=359.086, b=–01.511), we assume a distance of 8 kpc for IGR J17494–3030 which is consistent with the relatively high NH we obtained in the spectral fits.
The spectra were equally well fitted using neutron star atmosphere models for the soft component. We used the NSATMOS model (Heinke et al., 2007). In this we assume that the accretor in the system is a neutron star but we note that the nature of the primary is still unknown. We fixed the mass of the putative neutron star to and the radius to 10 km. We used a distance D of 8 kpc and we set the normalisation to 1 (i.e., the whole surface is assumed to emit radiation), which leaves the neutron star temperature as the only parameter free for the NSATMOS model. The obtained temperature (for an observer at infinity) is keV and the soft component contributes 22% to the total 0.5-10 keV unabsorbed flux. The other fit parameters are, within the errors, consistent with the values obtained when using the bbodyrad model (see Table 2).
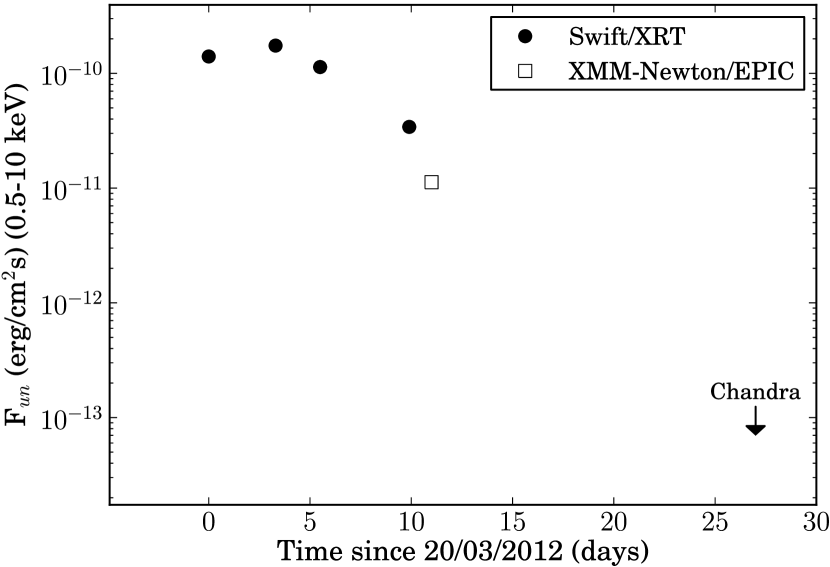
All Swift spectra are well described with a single absorbed power–law model (see Table 2). We fixed NH to the value obtained from the XMM-Newton fit (). The photon index value is, within the errors, consistent in all observations. The peak unabsorbed flux is (as observed during the second Swift observation) which corresponds to a of (0.5–10 keV). The lowest detected flux was observed during the XMM-Newton observation. The unabsorbed flux decreased approximately one order of magnitude in 8 days (see also Fig. 2), which gives a luminosity seen during the XMM-Newton observation of . We calculated the 0.5–10 keV unabsorbed flux upper limit from the Chandra count rate upper limit reported in Chakrabarty et al. (2013) using WebPIMMS. We assumed an absorbed power–law model with NH= and =2.14 (the values obtained from the XMM-Newton spectra). The calculated 0.5–10 keV unabsorbed flux is which results in a luminosity of (see Fig. 2).
3.2 Light curve Analysis
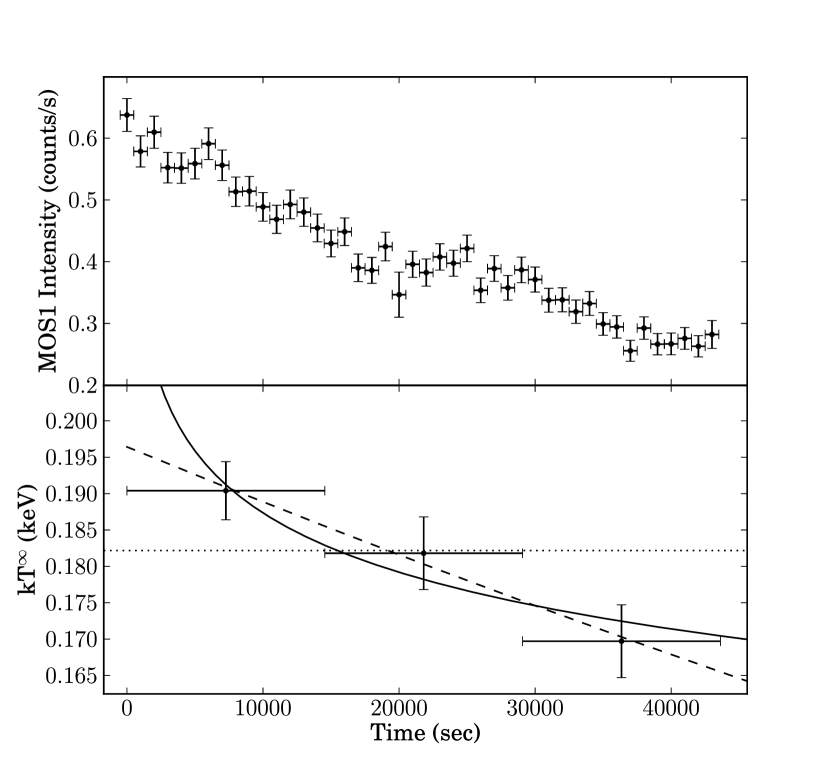
The count rate curve obtained during the XMM-Newton shows that the source intensity decreased during the observation, from to within 12 hours (see Fig. 2). In order to study the spectral evolution during the observation, we divided the observation in three segments of ksec each and individually fitted each spectrum (both the PN and MOS spectra simultaneously). We used the absorbed NSATMOS + POWERLAW model with the NH fixed to the value obtained from the fit using the data obtained from the whole observation (see Sec. 3.1). While the power-law index is constant within the errors (), the temperature decreases from keV to keV (Fig. 3; the errors are for 1). We can fit this decrease adequately with an exponential decay function with an e-folding time of 3.0 days or with a power-law decay function with an index of –0.060.02 (see Fig. 3)333As reference time we used the start of the XMM-Newton observation, but we found that the e-folding time or index is not very sensitive to the exact value of the reference time.. We also tried a constant value, but that did not provide an adequate fit (with a of 10.5 and a dof of 2, resulting in a p-value of 0.005). Both the flux observed from the soft component as well as the power-law component decrease during the observation. The thermal contribution to the 0.5-10 keV remained approximately constant during the decay.
4 Discussion
We present the spectral analysis of the Swift and XMM-Newton observations of IGR J17494–3030 during its 2012 outburst. If we assume a distance of 8 kpc, the inferred peak luminosity is in the energy range 0.5–10 keV. However, the luminosity in the 2–10 keV energy range is only , making this source a very-faint X-ray transient (Wijnands et al., 2006).
The intensity, amplitude, duration and X-ray spectral properties of the outburst of IGR J17494–3030 strongly suggest that this new X-ray transient is an LMXB. While the Swift spectra are well described by a simple absorbed powerlaw model with a photon index of 2, the XMM-Newton spectra need an additional thermal component to be adequately modelled. This thermal component could possibly arise from an accretion disc (a disc blackbody model can adequately fit the data), in which case we cannot determine whether the accreting object is a neutron star or a black hole. However, accretion discs at these low luminosities are typically expected to be at lower temperatures than what we observe, which suggests that the thermal component may have a different origin. In fact, the presence of the soft component (and its associated temperature) in the X-ray spectrum of IGR J17494–3030 is reminiscent of what is seen in neutron star X-ray binaries at similar luminosities (e.g., Fridriksson et al., 2010; Armas Padilla et al., 2013b; Degenaar et al., 2013). In those systems the thermal component it thought to originate from the surface of the neutron star. Given the strong similarities, we tentatively identify the accretor in IGR J17494–3030 as a neutron star.
If the soft component is indeed originating from the neutron star surface, then it is likely due to low level accretion onto the surface. Such low level accretion will indeed produce a soft spectrum (Zampieri et al., 1995) and in principle one should use the so-called zamp model (Soria et al., 2011) to fit the soft component in the X-ray spectra. However, that model is not publicly available so the next best things are the neutron star atmosphere models. Although those models assume that the emission is from a cooling neutron star and therefore incorporate different microphysics compare to the zamp model, typically the results are very similar between the models (i.e., the inferred surface temperature; Soria et al. 2011). Therefore, we will discuss the results obtained using neutron star atmosphere models which also allows for direct comparison with previous work in which only neutron star atmosphere models were used.
During the XMM-Newton observation we see a steady decrease of the source intensity. Together with the intensity, the temperature of the soft component is decreasing as well. Although such a temperature decrease with decreasing intensity would be expected irrespectively if the soft component is due to a cooling accreting disc or due to decreasing accretion onto the neutron star surface, it is very similar to what recently has been found for the bright neutron-star X-ray transient XTE J1709–267 by Degenaar et al. (2013). Those authors found that a similar (albeit at slightly lower luminosities and lower inferred surface temperatures) decay during the end stages of the 2012 outburst of XTE J1709–267. They favored an interpretation that the observed temperature decrease was due to the cooling of the neutron star crust which was heated by the accretion during the outburst.
However, the outburst of IGR J17494–3030 was much shorter (3-4 weeks versus 10 weeks) and much less luminous (peaking at erg s-1 versus erg s-1; 2–10 keV) than that of XTE J1709–267. Within our understanding of crustal heating and cooling models, IGR J17494–3030 should have been heated to a much lesser extent (if at all). It would not be expected to display similarly strong signs of crustal cooling as XTE J1709–267. Therefore, this likely is not the correct interpretation of the observed rapid intensity decay during the XMM-Newton observation for IGR J17494–3030. Since the behaviour of this source is so similar as what has been observed for XTE J1709–267, likely also in that source we did not observe the crust cooling.
Degenaar et al. (2013) alternatively suggested that the temperature decrease observed for XTE J1709–267 was not due to a cooling crust but maybe the thermal component was due to low-level accretion on the neutron star surface and the accretion rate decreased causing the surface temperature to decrease as well. This scenario could more naturally account for the similarities in the decay seen for the two sources, despite their different outburst properties. Therefore, we favor a low-level accretion scenario to explain the thermal component in both sources. If this is indeed the correct interpretation for the decay seen in both sources, then there is no need for an additional heat source in the neutron star crust, as was proposed by Degenaar et al. (2013).
Moreover, investigating the literature for more detections of soft thermal components at such low accretion luminosities of accreting neutron star systems (or candidate neutron star systems), we find several additional sources which are consistent with the hypothesis that the soft thermal component in the luminosity range of to erg s-1 is due to low level accretion onto the neutron star surface. For example, for the suspected neutron star very-faint X-ray transient XTE J1719–291 and for two confirmed persistent neutron star VFXBs (1RXH J173523.7–354013, 1RXS J171824.2–402934) we found in previous work that their spectra also required a thermal component in addition to the power-law component (Armas Padilla et al., 2011; Armas Padilla et al., 2013b). We refitted their spectra with the NSATMOS model (we previously used blackbody models) and obtained temperatures of keV, keV and keV, respectively, with associated luminosities of 3.3, , and erg s-1. In addition, Fridriksson et al. (2010) reported on a brief accretion flare during the quiescent state of the neutron-star X-ray transient XTE J1701–462 during which the temperature was 0.1590.02 keV for a luminosity of erg s-1.
Uncertainties in the distances affect the inferred temperatures, but there appears to be a tendency that for higher luminosities, the temperature is higher, as one would expect for the low-level accretion scenario. This provides strong evidence that in all these sources the thermal component indeed arises from the neutron star surface as a result of low-level accretion and that the inferred temperature is determined by the instantaneous mass accretion rate.
The decrease of surface temperature while the luminosity (and thus the inferred accretion rate onto the neutron star surface) decreases can only continue (in the transient sources) as long as the temperature due to the low-level accretion is higher than the interior (crust) temperature of the neutron star. If the accretion rate drops below a certain value, then the light curve evolution will not be governed anymore by the decay in accretion rate but instead it will be determined by how fast the crust cools down (even small outbursts will have a slightly heated crust) and eventually by the core cooling rate. Therefore, in the light curve we would expect a break at a certain luminosity from a rapid decay of the luminosity to a much slower decay rate. Such a break has been observed in several systems (e.g., XTE J1701–462 by Fridriksson et al. 2010; MAXI J0556–332 by Homan et al. 2013, in prep; Aql X-1; Campana et al. 1998; Campana et al. 2013, in prep) and indeed has been interpreted as the onset of the crust cooling (e.g., Fridriksson et al., 2010).
Acknowledgments
We acknowledge the XMM-Newton team for make this observation possible. RW and MAP are supported by an ERC starting grant awarded to RW. ND is supported by a NASA Hubble Postdoctoral Fellowship grant (number HST-HF-51287.01-A) from the Space Telescope Science Institute.
References
- Armas Padilla et al. (2011) Armas Padilla M., Degenaar N., Patruno a., Russell D. M., Linares M., Maccarone T. J., Homan J., Wijnands R., 2011, MNRAS, 417, 659
- Armas Padilla et al. (2013a) Armas Padilla M., Degenaar N., Russell D. M. M., Wijnands R., 2013a, MNRAS, 428, 3083
- Armas Padilla et al. (2013b) Armas Padilla M., Degenaar N., Wijnands R., 2013b, MNRAS, 1789
- Arnaud (1996) Arnaud K. A., 1996, in Jacoby G. H., Barnes J., eds, ASP Conf. Ser. Vol. 101 of Astron. Soc. Pac., San Francisco, XSPEC: The First Ten Years. p. 17
- Boissay et al. (2012) Boissay R., Chenevez J., Bozzo E., Ferrigno C., Grinberg V., Wilms J., Caballero 2012, ATel, 3984, 1
- Bozzo et al. (2012) Bozzo E., et al. 2012, ATel, 3989, 1
- Burrows et al. (2005) Burrows D. N., et al. 2005, Space Sci. Rev., 120, 165
- Campana (2009) Campana S., 2009, ApJ, 699, 1144
- Campana et al. (1998) Campana S., Stella L., Mereghetti S., Colpi M., Tavani M., Ricci D., Dal Fiume D., Belloni T., 1998, ApJ, 499, L65
- Chakrabarty et al. (2013) Chakrabarty D., Jonker P. G., Markwardt C. B., 2013, ATel, 4886, 1
- Degenaar & Wijnands (2009) Degenaar N., Wijnands R., 2009, A&A, 495, 547
- Degenaar & Wijnands (2010) Degenaar N., Wijnands R., 2010, A&A, 524, A69
- Degenaar et al. (2013) Degenaar N., Wijnands R., Miller J. M., 2013, ApJ, 767, L31
- Fridriksson et al. (2010) Fridriksson J. K., et al. 2010, ApJ, 714, 270
- Gehrels et al. (2004) Gehrels N., et al. 2004, ApJ, 611, 1005
- Heinke et al. (2007) Heinke C. O., Jonker P. G., Wijnands R., Taam R. E., 2007, ApJ, 660, 1424
- Jansen et al. (2001) Jansen F., et al. 2001, A&A, 365, L1
- Minniti et al. (2010) Minniti D., Lucas P. W., Emerson J. P., Saito R. K., Hempel M., Pietrukowicz P., Ahumada A. V., Alonso M. V., Alonso-Garcia 2010, New A, 15, 433
- Muno et al. (2005) Muno M. P., Pfahl E., Baganoff F. K., Brandt W. N., Ghez A., Lu J., Morris M. R., 2005, ApJ, 622, L113
- Soria et al. (2011) Soria R., Zampieri L., Zane S., Wu K., 2011, MNRAS, 410, 1886
- Strüder et al. (2001) Strüder L., Briel U., Dennerl K., Hartmann R., Kendziorra E., Meidinger N., Pfeffermann E., Reppin C., al. E., 2001, A&A, 365, L18
- Turner et al. (2001) Turner M. J. L., Abbey A., Arnaud M., Balasini M., Barbera M., Belsole E., Bennie P. J., Bernard J. P., al. E., 2001, A&A, 365, L27
- Wijnands et al. (2006) Wijnands R., et al. 2006, A&A, 449, 1117
- Wijnands et al. (2004) Wijnands R., Homan J., Miller J. M., Lewin W. H. G., 2004, ApJL, 606, L61
- Zampieri et al. (1995) Zampieri L., Turolla R., Zane S., Treves A., 1995, ApJ, 439, 849