11email: v.bujarrabal@oan.es 22institutetext: Institut de Radioastronomie Millimétrique, 300 rue de la Piscine, 38406, Saint Martin d’Hères, France 33institutetext: Observatorio Astronómico Nacional (OAN-IGN), C/ Alfonso XII, 3, E-28014 Madrid, Spain 44institutetext: Instituut voor Sterrenkunde, K.U.Leuven, Celestijnenlaan 200B, 3001 Leuven, Belgium 55institutetext: Centro de Astrobiología (CSIC-INTA), ESAC Campus, E-28691 Villanueva de la Cañada, Madrid, Spain 66institutetext: Centro de Astrobiología (CSIC-INTA), Ctra. M-108, km. 4, E-28850 Torrejón de Ardoz, Madrid, Spain 77institutetext: UJF-Grenoble1/CNRS-INSU, Inst. de Planétologie et d’Astrophysique de Grenoble (IPAG) UMR 5274, Grenoble, F-38041, France
ALMA observations of the Red Rectangle, a preliminary analysis
Abstract
Aims. We aim to study equatorial disks in rotation and axial outflows in post-AGB objects, as to disclose the formation and shaping mechanisms in planetary nebulae. So far, both disks and outflows had not been observed simultaneously.
Methods. We have obtained high-quality ALMA observations of 12CO and 13CO =32 and 12CO =65 line emission in the Red Rectangle, the only post-AGB/protoplanetary object in which a disk in rotation has been mapped up to date.
Results. These observations provide an unprecedented description of the complex structure of this source. Together with an equatorial disk in rotation, we find a low-velocity outflow that occupies more or less the region placed between the disk and the optical X-shaped nebula. From our observations and preliminary modeling of the data, we confirm the previously known properties of the disk and obtain a first description of the structure, dynamics, and physical conditions of the outflow.
Key Words.:
stars: AGB and post-AGB – circumstellar matter – radio-lines: stars – planetary nebulae: individual: Red Rectangle1 Introduction
Many protoplanetary nebulae (PPNe) show very massive ( 0.1 ) and fast (30–200 km s-1) bipolar outflows, which are thought to be crucial in the formation of planetary nebulae; see e.g. Bujarrabal et al. (2001), Balick & Frank (2004). These outflows carry too much linear momentum to be powered by momentum transfer from stellar photons, and the presence of disks rotating around the central stars and reaccretion from them are often postulated to explain the nebular dynamics (e.g. Soker 2001, Frank & Blackman 2004). However, only one of these putative disks has been well identified up to date, by means of interferometric mm-wave maps of 12CO =10 and =21 emission in the Red Rectangle (Bujarrabal et al. 2005). The Red Rectangle is a well studied PPN and, curiously, one of the post-AGB objects that do not show massive and very fast outflows. It consists of the equatorial rotating disk plus a spectacular axisymmetric nebula seen in the visible, surrounding a double stellar system (Men’shchikov et al. 2002, Cohen et al. 2004). It also shows some properties, as a NIR excess indicative of hot dust kept close to the stellar system, that suggest the presence of a very compact disk (e.g. Van Winckel 2003).
Recent single-dish observations of 12CO and 13CO mm-wave emission in a sample of similar post-AGB stars (close binary stars with low-mass nebulae and indications of compact disks) systematically yielded characteristic line profiles, with a prominent single or double peak and moderate-velocity wings, which are strikingly similar to those of the Red Rectangle (Bujarrabal et al. 2013, Paper II). Profiles of this kind are also found in disks around young stars (notably T Tauri variables), and have been proven, both from theoretical and observational grounds, to be very reliable indicators of rotating disks.
Remarkably, gas in slow expansion was also detected in some of these post-AGB objects. CO maps of 89 Her show an extended component expanding at about 5 km s-1, whose emission dominates the line wings (Bujarrabal et al. 2007); this source also shows a barely-resolved central condensation that is probably in rotation. From careful modeling of Herschel observations of high- CO lines in the Red Rectangle, Bujarrabal & Alcolea (2013, Paper I) deduced that a (probably bipolar) component in expansion should significantly contribute to the high- line wings in this source. But the spatial resolution of those observations was poor and the existence of such a component remained very uncertain. Indications of molecule-rich outflows were also found for other similar sources, in which the disk-like CO profiles show relatively strong line wings (Paper II).
All these nebulae, including the Red Rectangle, show low values of the total mass (10-2 ) and expansion velocity (5–10 km s-1), contrary to the case of the massive PPNe mentioned before, and may represent a different post-AGB evolutionary regime. The Red Rectangle is the prototype of this important class of objects and the best target to study the simultaneous appearance of rotating disks and bipolar outflows, a basic input for understanding the formation and shaping of planetary nebulae.
2 Observations
We present ALMA observations of the Red Rectangle, using receiver bands 7, to map the 12CO and 13CO =32 transitions, and 9, to map the CO =65 transition111ALMA is a partnership of ESO (representing its member states), NSF (USA) and NINS (Japan), together with NRC (Canada) and NSC and ASIAA (Taiwan), in cooperation with the Republic of Chile. The Joint ALMA Observatory is operated by ESO, AUI/NRAO and NAOJ. We made use of the ALMA dataset ADS/JAO.ALMA#2011.0.00223.S. . The backends were set to achieve a spectral resolution of 0.21 km s-1. Band 7 observations were performed in October 2012 and those of band 9 in November; the data were delivered in December 2012. During the observations, the array consisted of 21 to 24 antennas distributed in a configuration that extended up to 380 m. RF and flux calibrators were observed in each run, and two phase calibrators were observed alternatively with the source. The delivered calibrated data were significantly improved with a better-adapted calibration strategy. See more details in Appendix A.
The image deconvolution was made by using robust weighting (with a threshold of 1) for band 7 and natural weighting for band 9. The resulting brightness rms is 5 mJy/beam in the CO =32 channel maps, for a spectral resolution of 0.42 km s-1 and a synthetic beam with a HPBW of 0.′′480.′′44. The rms becomes 7 mJy/beam in the channel maps with the brightest emission. For 12CO =65 maps the rms is 30 mJy/beam with a synthetic beam of 0.′′310.′′25 and 0.42 km s-1 resolution. For the continuum maps, a brightness rms of 3 mJy/beam is obtained in band 7 and of 8 mJy/beam in band 9. The continuum emission extends in total 3′′ in the direction of the equatorial disk. The integrated continuum flux varies, because of the source spectral index, in the ranges 0.59-0.66 and 3.2-3.6 Jy, respectively for bands 7 and 9. Calibration was made with the CASA software package, while for the imaging and data analysis we used GILDAS. An optical image was obtained from the HST archive and used for comparison with the CO data, see details in App. A.
3 Results, simple modeling of our ALMA maps
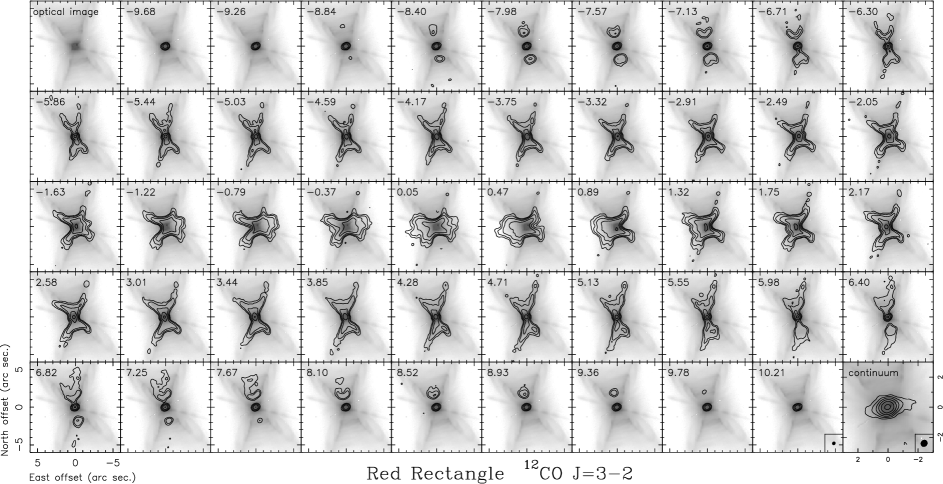
Our maps (Figs. 1, 2, and 3) show the complex structure of the Red Rectangle. The already known rotating disk in the nebula equator (previously mapped in 12CO =10 and =21 with lower quality by Bujarrabal et al. 2005) is accurately described in our maps. Together with this disk, an X-shaped structure delineating the lobes of the optical nebula (mostly its inner part) are mapped in molecular emission for the first time. This component must be in expansion, because their emission is detected at too high velocities and large distances to the center. (The gravitational attraction is given by the rotation in the disk, which shows high velocities only very close to the center, as expected for a Keplerian or Keplerian-like law; see Bujarrabal et al. 2005.)
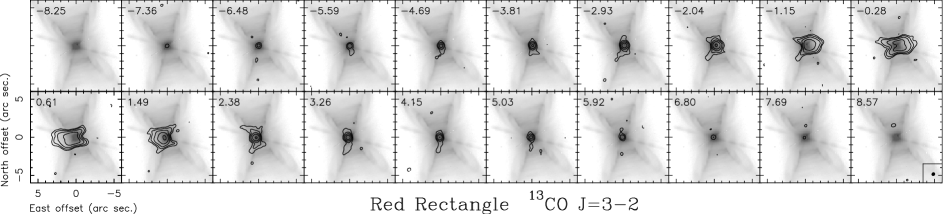
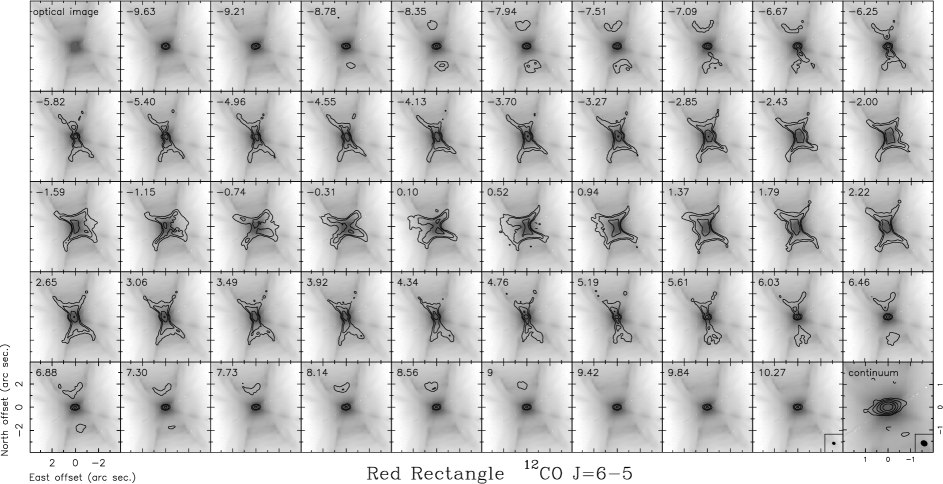
The presence of CO-emitting outflows in the Red Rectangle was suggested in Paper I, from careful modeling of mm-wave and FIR CO lines; but only indirect indications of the outflow were provided and qualitative ideas on its spatial distribution and physical conditions could be deduced. Our results clearly confirm that prediction. The emission from the X-shaped component is indeed dominant in the 12CO =65 line, but is rather weak in the 13CO =32 one.
12CO and 13CO =32 show a similar peak brightness in the disk, with a remarkably high value not much lower than the expected kinetic temperatures ( 100 K, Paper I), showing that, in the central regions, these lines are mostly thermalized and optically thick. The peak brightness of 12CO =65 is also comparable, but its intensity significantly decreases toward the end of the disk, indicating that its excitation is relatively low in the outer disk. The outflowing component is very bright in 12CO =65, notably at distances smaller than 2′′ from the equator. 12CO =32 is about a factor two weaker in these regions, and 13CO =32 is much weaker, almost undetected. This shows that the observed lines are not opaque in the outflow and that its temperature is relatively high ( 100 K).
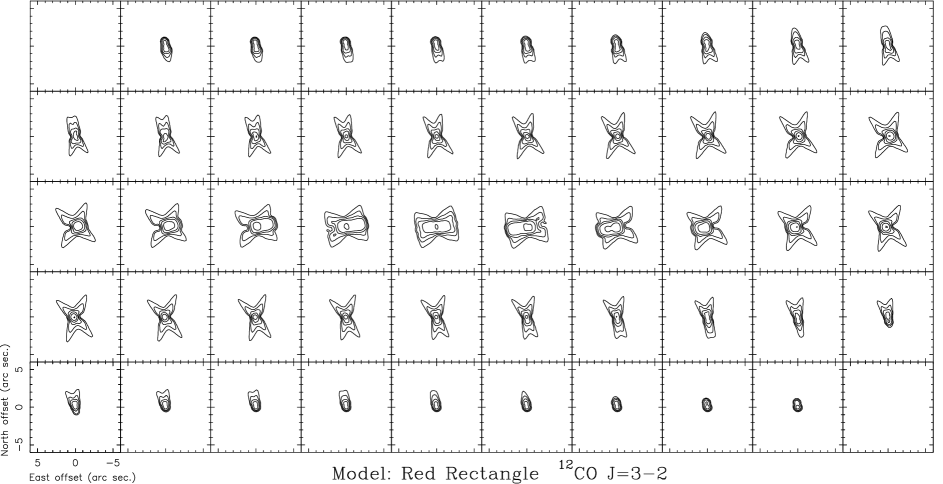
We have performed a simple model fitting of our 12CO =32 maps. We used a code very similar to that described by Bujarrabal et al. (2005). In this code, the excitation is described by an LTE approximation, which is valid for low- high-opacity transitions, that are easily thermalized, but certainly not in general (Paper I). For that reason we applied this treatment only to 12CO =32 and here we just give a brief discussion on the modeling of our ALMA results. A more detailed treatment of the line excitation, including model fitting for all lines, requires complex calculations using an ’exact’ non-local treatment in two dimensions (Paper I) and a very careful and detailed discussion of the results, which is clearly out of the scope of this letter and is delayed to a forthcoming paper.
We adopted the same disk model as that deduced in Paper I (where all parameters are discussed in detail). We only decreased the disk density by factor 2, because the predicted line emission from this component was stronger than observed. We introduced a new component in expansion, which is kept as simple as possible and symmetric with respect to the polar axis and equatorial plane. The results of our modeling, in the form of synthetic maps of 12CO =32 in the same units as the observational data, are shown in Fig. 4. The shape, dynamics, and density in the best-fit model nebula are depicted in Fig. 5; the temperature of the outflow is assumed to be constant and equal to 200 K. In Fig. 5, we represent parameters in a plane perpendicular to the equator, therefore the disk is seen edge on and the rotational velocity, which is the same as in Paper I, cannot be displayed.
As we see, the model prediction is satisfactory. The emission of the disk is well reproduced assuming practically the same structure and conditions as those derived in Bujarrabal et al. (2005) and Paper I. The emission from the expanding gas (at relatively high velocity shifts) is also well explained. It is remarkable that the properties of the outflow are roughly compatible with those tentatively deduced in Paper I to explain the profiles of high- CO lines. However, several caveats must be kept in mind. First of all, the nebula is not exactly symmetric with respect to the equator and the axis. This cannot be reproduced by our model, which tends to give a kind of average. Second, we assumed a disk density somewhat lower than previously thought; this may result from the contribution of the outflow to the total emission and our LTE assumption, which would not account for some underexcitation in this line (since the density is not very high). We recall that a more detailed modeling must include the fitting of our 13CO =32 and 12CO =65 maps and much more complex and difficult calculations, and is deferred to a forthcoming work. Our modeling is preliminary, but we think that it yields the main results that can be extracted from our data and a reasonable description of the nebula.
4 Conclusions
We present high-quality ALMA observations of 12CO and 13CO =32 and 12CO =65 line emission in the Red Rectangle, see Figs. 1, 2, and, 3. In these figures we also show the maps of the submm-wave continuum, as well as an HST image of the nebula for comparison (Sect. 2). We performed a preliminary modeling of the 12CO =32 line (which is the easiest to model, Sect. 3), which yielded satisfactory predictions; our best-fit synthetic maps and deduced nebula properties are shown in Figs. 4 and 5. Our main results can be summarized as follows:
-
1: The Red Rectangle is a complex nebula, showing both a rotating disk and a component in expansion. The coexistence of extended rotating disks and outflows is probably common in post-AGB objects, at least in low-mass nebulae surrounding binary stars (Sect. 1, Paper II).
-
2: The high brightness measured in the central panels suggests opaque lines in the disk. 12CO =65 emission is particularly intense in the outflow, indicating relatively high excitation and low opacities in this component.
-
3: Our interpretation of the data is compatible with the properties of the disk deduced in previous works.
-
4: The gas in expansion basically occupies the region placed within the disk and the double cone delineated by the X-shaped optical images. The optical nebula must then correspond to the inner illuminated region of the expanding lobes, the density within the double cone being much lower. The velocity of the outflow is moderate, 10 km s-1, with a trend to decrease in regions close to the equator. The density of this expanding component increases toward the center, with values between 103 and 105 cm-3; the temperature of the gas is kept constant at 200 K.
Acknowledgements.
This work has been supported by the Spanish MICINN, program CONSOLIDER INGENIO 2010, grant “ASTROMOL” (CSD2009-00038). CSC is partially supported by the Spanish MINECO, grants AYA2009-07304 and AYA2012-32032. We used the SIMBAD and MAST databases.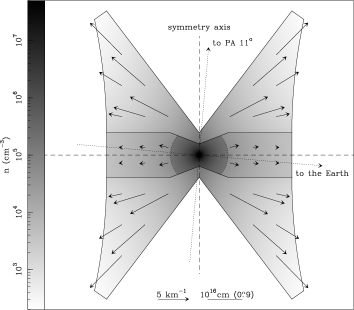
References
- Balick & Frank (2002) Balick, B., & Frank, A. 2002, ARA&A, 40, 439
- Bujarrabal et al. (2001) Bujarrabal, V., Castro-Carrizo, A., Alcolea, J., & Sánchez Contreras, C. 2001, A&A, 377, 868
- Bujarrabal et al. (2005) Bujarrabal, V., Castro-Carrizo, A., Alcolea, J., & Neri, R. 2005, A&A, 441, 1031
- Bujarrabal et al. (2007) Bujarrabal, V., Van Winckel, H., Neri, R., et al. 2007, A&A, 468, L45
- Bujarrabal & Alcolea (2013) Bujarrabal, V., & Alcolea, J., 2013, A&A, 552, A116 (Paper I)
- Bujarrabal et al. (2013) Bujarrabal, V., Alcolea, J., Van Winckel, H., et al. 2013, A&A, in press (Paper II), astroph: http://arxiv.org/abs/1307.1975
- Cohen et al. (2004) Cohen, M., Van Winckel, H., Bond, H. E., & Gull, T. R. 2004, AJ, 127, 2362
- Frank & Blackman (2010) Frank, A., & Blackman, E. G. 2004, ApJ, 614, 737
- Men’shchikov et al. (2002) Men’shchikov, A.B., Schertl, D., Tuthill, P.G., et al. 2002, A&A, 393, 867
- Soker (2001) Soker, N. 2001, ApJ, 558, 157
- van Leeuwen (2007) van Leeuwen, F. 2007, A&A, 474, 653
- Van Winckel (2003) Van Winckel, H. 2003, ARAA, 41, 391
Appendix A Further details on observations and data reduction
Two observing runs were carried out in band 7 in October 21 and 22, 2012, of 80 and 100 min respectively, with which we obtained a total of 71 min of correlations on source. The band 9 observations were performed in November 3 and 4, 2012, in four runs with durations of 133, 127, 64, and 111 min, which allowed accumulating a total of 135 min of correlations on source. For band 7, J0522-364 was observed for the RF calibration. For band 9, J0538-440 or 3 C84 were observed instead. Callisto was always observed for absolute flux calibration, but for one run in band 9 in which data in Ceres was obtained. J0607-085 and J0609-157 were observed every 10 to 20 min for gain calibration.
ALMA staff provided first calibrated data in December 2012, which were considerably improved by us. In particular, we made sure that the absorption CO lines detected at the position of the RF calibrator did not get into source data. The bandpass was calibrated by fitting cubic splines. Also, having identified different RF solutions for the different observed runs, an independent calibration was performed per track. For gain calibration, data from the two observed calibrators were considered. Later, from these first calibrated data, selfcalibration was carried out by using the bright and moderately extended continuum emission of the Red Rectangle. All those processes resulted in a very significant improvement in the quality of final images.
The flux calibration was based on the Butler-JPL-Horizons 2010 model for solar system bodies. A recent upgrade in that model (including e.g. Herschel data) suggests that the intensity here presented could be slightly overestimated, by 10% in band 7, and by 5-10% in band 9.
In band 7, the total observed frequency ranges were 330.354-330.822, 333.152-333.620, 345.106-345.574, and 345.562-346.030 GHz, aiming to map mainly the emission of the 12CO and 13CO =32 transitions. In band 9, we observed the intervals 673.540-674.477, 677.040-677.977, 687.805-688.742 and 691.004-691.941 GHz to image the 12CO =65 line.
A WFPC2/f622w optical image was obtained from the HST archive. The optical and ALMA images were aligned adopting the astrometry provided by the Hubble Legacy Archive, which we have checked is reliable using the 2MASS coordinates of the 11 field stars detected within the WFPC2 field, and correcting for the Red Rectangle’s proper motion (as measured by Hipparcos and listed in the SIMBAD database, =6.462.21 and =22.742.03 mas yr-1, van Leeuwen 2007) for a time difference of 13.3 yr between the HST and ALMA observations. The resulting alignment of the centroids, within 0.′′1, is found to be satisfactory, in view of the uncertainty in the stellar positions and proper movements.