Angle-resolved photoemission spectroscopy study on iron-based superconductors
Abstract
Angle-resolved photoemission spectroscopy (ARPES) has played an important role in determining the band structure and the superconducting gap structure of iron-based superconductors. Here from the ARPES perspective, we briefly review the main results from our group in the recent years on the iron-based superconductors and their parent compounds, and depict our current understanding on the antiferromagnetism and superconductivity in these materials.
I Introduction
Iron-based superconductors belong to a new family of unconventional superconductors with the maximum superconducting transition temperature () up to 56 K in the bulk materials Hosono . It provides a new route to realize and understand the high- superconductivity. So far, many series of iron-based superconductors have been discovered, which could be divided into iron-pnictides and iron-chalcogenides according to the anions Review . The undoped compounds of iron-based superconductors are usually in an antiferromagnetically ordered spin-density-wave (SDW) state. Through chemical substitution or physical pressure, the magnetic order is suppressed and the superconductivity emerges.
After five years’ intensive research, many general consensuses have been reached on various critical issues of the physics of iron-based superconductors. During the process, as a powerful technique to study the electronic structure of solids, angle-resolved photoemission spectroscopy (ARPES) plays an important role. In this paper, we present a brief review of the ARPES studies on the iron-pnictides and iron-chalcogenides superconductors conducted by our group. We will discuss the multi-band and multi-orbital nature of the electronic structure, the mechanism of the structural and magnetic transitions, and the superconducting gap distributions etc. Meanwhile, we will discuss some ongoing issues which are still under debate, such as the superconducting pairing symmetry in KxFe2-ySe2, nodal superconducting gap distribution, and the nematic transition prior to the AFM state.
II Angle-resolved photoemission spectroscopy
II.1 General description
Based on the photoelectric effect, when a beam of monochromatized radiation supplied either by a gas-discharge lamp or a synchrotron beamline is shined on a sample, electrons are emitted and escape to the vacuum in all directions. An energy conservation during this photoemission process can be described by:
where is the kinetic energy of the photoelectron, is the photon energy, is the electron binding energy, and is the work function of the solid. Particularly, for the photoemission from solids with crystalline order, there is a momentum conservation between the in-plane photoelectron momentum and the crystal momentum of electron , which can be described by:
Therefore, in order to obtain the binding energy and crystal momentum of the electron in the solid, we could measure the kinetic energy of the photoelectron and its emission angle by using a hemisphere energy analyzer. The typical energy and angular resolutions are 5 meV and 0.3 degree respectively.
Due to the lack of translational symmetry along the sample surface normal, the out-of-plane momentum (or ) is not conserved during the photoemission process. Such uncertainty in is less relevant in the case of low-dimensional systems, such as the cuprates. However, it is very important to estimate for studying the iron-based superconductors, whose electronic structure often has considerable variation along the direction. Fortunately in ARPES experiments at fixed , the band dispersion along the direction could still be measured by varying the photon energy, since it changes . The could be approximately calculated by using “inner potential” as the following:
In practice, is chosen so that the periodicity of the Brillouin zone in the direction is reproduced correctly in the measured dispersion. Therefore, conducting the photon energy dependent ARPES is an effective way to probe the electronic structure in the three-dimensional (3D) Brillouin zone, which is crucial for the study of iron-based superconductors.
II.2 Polarization dependent ARPES
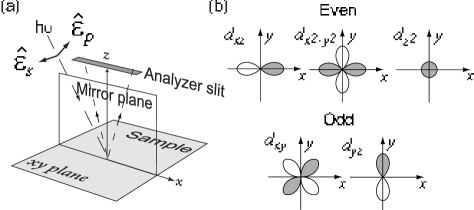
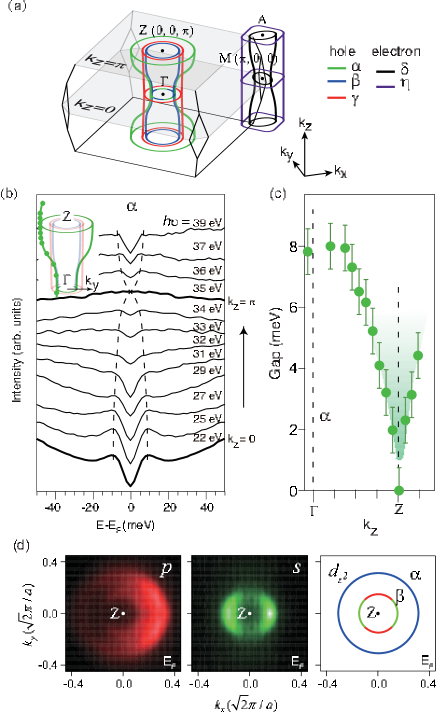
The polarization-sensitivity of orbitals in ARPES is its another advantage in studying the iron-based superconductors ReviewArpes ; YZhangBaCo . The photoemission intensity is proportional to the matrix element of the photoemission process , which can be described by , where is the unit vector of the electric field of the light, and () is the initial-state (final-state) wave function. In order to have nonvanishing photoemission intensity, the whole integrand in the overlap integral must be an even function under reflection with respect to the mirror plane defined by the analyzer slit and the sample surface normal [Fig. 1(a)]. Because odd-parity final states would be zero everywhere on the mirror plane and therefore also at the detector, the final state must be even. In particular, for high kinetic-energy photoelectrons, the final-state wave function can be approximated by an even-parity plane-wave state with in the mirror plane. In turn, this implies that must be even. For the (or ) experimental geometry, where the electric field direction of the incident photons (or ) is parallel (or perpendicular) to the mirror plane [Fig. 1(a)], will be even (or odd). Therefore, only the even (or odd) parity initial states will be detected ReviewArpes .
Considering the spatial symmetry of the orbitals, when the analyzer slit is along the high-symmetry direction of the sample, the photoemission signal of certain orbital would appear or disappear by specifying the polarization directions. For example, with the analyzer slit in the plane [Fig. 1(a)], the even orbitals (, , and ) and the odd orbitals ( and ) could be only observed in the and geometries, respectively [Fig. 1(b)].
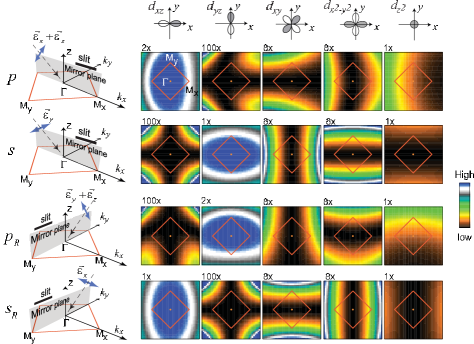
One could further change the mirror plane by rotating the azimuthal angle of the sample. Four experimental geometries could be achieved. The matrix element distributions for the five orbitals were calculated in four geometries. As shown in Fig. 2, the matrix element distributions of the and orbitals exhibit a strong polarization dependence throughout the first Brillouin zone, reflecting the opposite symmetry of these two orbitals. The matrix element distribution of () is suppressed along the direction parallel (perpendicular) to the in-plane component of the polarization. For the orbital which is sensitive to the out-of-plane component of the polarization, its intensity is much stronger in the experimental geometry than in the experimental geometry. Note that, we use the atomic wave function of electrons as the initial wave function for simplicity. More strictly speaking, the Bloch wave function need to be used in the analysis Bruet .
Therefore, by comparing the experimental results with the calculations, we could determine the orbital characters of individual bands and further study the role of the orbital degree of freedom in iron-based superconductors.
III Iron-pnictides
III.1 Parent compounds
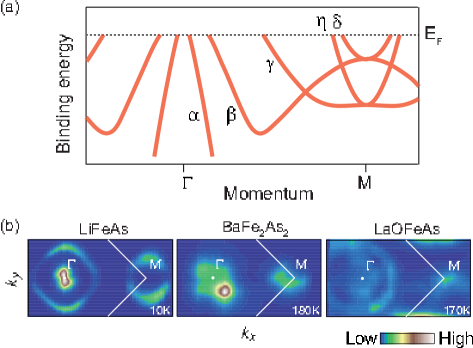
Unlike the cuprates, the parent compounds of iron-pnictides are metals, instead of insulators. Early band calculations showed that the low-lying electronic structure is dominated by the Fe electrons Theory1 ; Theory2 . There are three hole-like bands around and two electron-like bands around M [Fig. 3(a)], exhibiting a semi-metal behavior. Our ARPES measurements on several parent compounds have confirmed this scenario lxyang ; lxyangPRB ; Hecheng . As shown in Fig. 3(b), the photoemission intensity around is contributed by hole pockets, while that around is contributed by electron pockets. Note that, in LiFeAs and BaFe2As2, the sizes of the electron and hole pockets are comparable, while the huge hole pocket in LaOFeAs is due to the charge redistribution on the surface of the 1111 compounds lxyangPRB . Polarization dependent ARPES studies and band calculations further showed that the hole and electron pockets involve all five Fe orbitals YZhangBaCo . Therefore, in contrast to the single band Fermi surface of cuprates, the electronic structure of iron-based superconductors exhibits multi-band and multi-orbital nature.
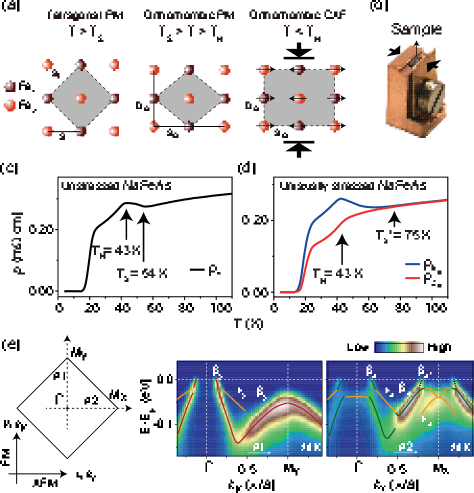
Besides the similar electronic structure, the parent compounds of iron-pnictides share a common SDW or collinear antiferromagnetic (CAF) ground state Neutron1 ; Neutron2 , which is characterized by a ferromagnetic (FM) spin alignment along one direction in the two-dimensional rectangular lattice formed by iron sites, and an antiferromagnetic (AFM) spin alignment along the perpendicular direction [Fig. 4(a)]. Intriguingly, the development of the SDW order is always accompanied by a tetragonal-to-orthorhombic structural phase transition. The transition temperature () at which the lattice distortion takes place either precedes or coincides with the Neel transition temperature () Neutron1 ; Neutron2 .
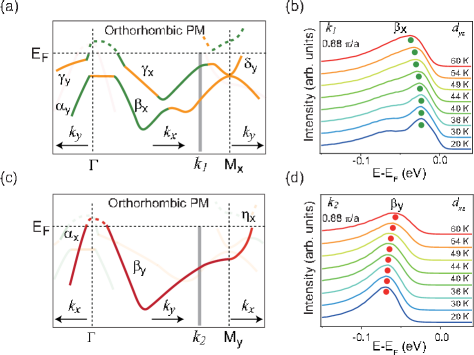
Early ARPES measurements are complicated due to the twinning effect of the sample lxyang ; Hecheng , since the rotational symmetry is broken via the structural and magnetic transitions. Therefore, in order to investigate the low-temperature electronic state, we applied a uniaxial pressure on the sample to overcome the twinning effect [Fig. 4(b)]. After detwinning, the in-plane anisotropy of the resistivity emerges at about 75 K corresponding to the nematic transition temperature [Fig. 4(d)], much higher than and in the unstressed sample [Fig. 4(c)]. Meanwhile, we have successfully observed a nematic electronic structure with rotational symmetry in the SDW state by ARPES NaFeAsPRB . As shown in Fig. 4(e), the band structures along - and - direction are different. Note that, the electronic structure in the SDW state is characterized by a strong band reconstruction rather than a Fermi-surface-nesting gap.
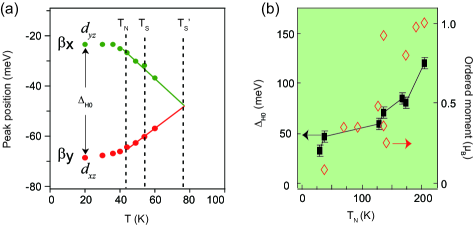
The energy separation of and near the or point could be viewed as a parameter to describe the reconstruction of the electronic structure. Such a separation begins at the nematic transition temperature and almost saturates at [Figs. 5 and 6(a)]. The smooth evolution of the electronic structure reconstruction across into the SDW state [Figs. 5(b) and 5(d)] indicates that both the magnetic and structural transitions share the same driving force NaFeAsPRB . We further summarized the energy separation between and measured in various iron-based compounds [Fig. 6(b)]. Their low-temperature saturated values () roughly show a monotonic correspondence with ’s JJ . Together, the ordered moments measured by neutron scattering for various compounds are plotted against . The similar trends in both quantities suggest that the band sepration is induced by the Hund’s rule coupling between the itinerant electrons and the local moments.
With polarization dependent ARPES, we found that the band reconstruction primarily involves the - and -dominated bands. These bands strongly hybridize with each other, inducing a band splitting, while the -dominated bands only exhibit an energy shift without any reconstruction NaFeAsPRB . As a result, the orbital weight redistribution of and opens a partial gap near the Fermi energy (). On the contrary, the total occupation of is almost invariant NaFeAsPRB . Theoretically, either exchange interactions among spins or ferro-orbital ordering between and orbitals has been suggested to be the cause of the SDW order Theory3 ; Theory4 . Our data suggest that the fluctuations of the spin order at high temperatures and the local Hund’s rule coupling drive the nematic electronic structure in iron-pnictides, while the weak ferro-orbital ordering (or orbital occupation redistribution) between the and orbitals may be just a consequence or a secondary driving force here NaFeAsPRB .
| Compound | (K) | (meV) | () |
| SrFe2As2 | 205 | 120 (Ref. SrK, ) | 1.01(3) (Ref. SrFeAs, ) |
| EuFe2As2 | 190 | - | 0.98(8) (Ref. EuFeAs, ) |
| CaFe2As2 | 173 | 80 | 0.80(5) (Ref. CaFeAs, ) |
| Sr0.9K0.1Fe2As2 | 168 | 85 (Ref. SrK, ) | - |
| NdOFeAs | 141 | - | 0.25(7) (Ref. NdOFeAs, ) |
| LaOFeAs | 137 | - | 0.36 (Ref. PCDai, ) |
| BaFe2As2 | 136 | 70 (Ref. MYi, ) | 0.93(6) (Ref. BaFeAs, ) |
| Sr0.82K0.18Fe2As2 | 129 | 60 (Ref. SrK, ) | - |
| PrOFeAs | 127 | - | 0.48(9) (Ref. PrOFeAs, ) |
| BaFe0.95Co0.05As2 | 93 | - | 0.35 (Ref. BaCo, ) |
| Ba1-xKxFe2As2 | 70 | - | 0.35 (Ref. BaK, ) |
| NaFeAs | 37 | 46 (Ref. NaFeAsPRB, ) | 0.09(4) (Ref. NaFeAs, ) |
| NaFe0.9875Co0.0175As | 30 | 32 (Ref. Ge, ) | - |
III.2 Superconducting iron pnictides
III.2.1 Coexistence of SDW and supercondcutivity
The superconductivity in iron pnictides could be induced, when the SDW order is suppressed by chemical substitution of the parent compounds in various ways Review . For example, the SDW is suppressed in Sr1-xKxFe2As2 by K doping. As shown in Fig. 6(b), both and the band separation , which is an electronic hallmark of the SDW state, decrease with increasing K concentration in underdoped Sr1-xKxFe2As2 SrK . Interestingly, in the superconducting sample Sr0.82K0.18Fe2As2, one could still observe a clearly band separation below 130 K SrK . This shows that the superconductivity and the SDW might coexist in the underdoped regime of the phase diagram. In fact, such a coexistence of superconductivity and SDW has been found to be quite generic in various iron pnictides.
The SDW/superconductivity coexisting phase in the iron pnictides represents a novel ground state, and its properties may shed light on the superconducting mechanism. Theoretically, theories based on pairing symmetry suggest that there must be nodes in the superconducting gap in this regime theoryMazin and the coexisting SDW and superconducting phases cannot be microscopic NeutronSc&Theory . On the other hand, theories based on pairing symmetry suggest nodeless superconducting gap in the presence of weak magnetic order; moreover, the coexistence may cause angular variation of the superconducting gap, and even give rise to nodes in the limit of strong antiferromagnetic ordering theoryMazin ; theoryChubukov .
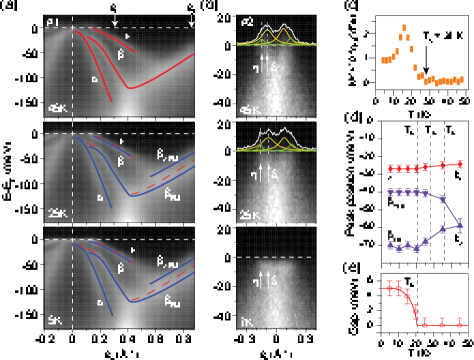
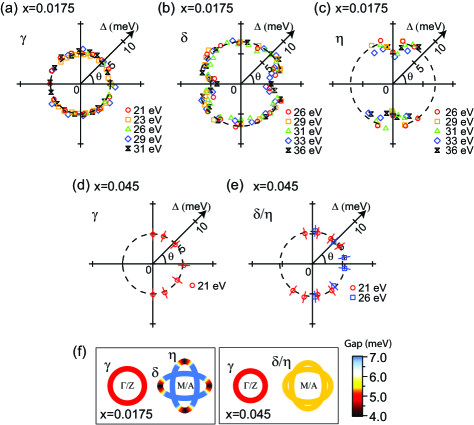
We have conducted ARPES experiments on the 1.75% Co doped NaFeAs, which is in the coexisting regime Ge . The neutron scattering and transport measurements confirmed the coexistence of SDW and superconductivity with = 28 K and = 20.5 K. As shown in Fig. 7, the band structure reconstruction corresponding to the SDW formation and the superconducting gap could be observed on the same , and bands, which is a direct evidence for the intrinsic coexistence of the two orders. Since the reconstruction of electronic structure in the SDW state does not necessarily open an full energy gap at , which leaves room for superconductivity. More intriguingly, the superconducting gap distribution is found nodeless on all Fermi surface sheets: it is isotropic on the hole pocket, but it is highly anisotropic on the electron pockets [Figs. 8(a) 8(c)]. However, for the comparison measurements on an SDW-free NaFe0.955Co0.045As sample ( K), in-plane gap distributions on all Fermi surface sheets show isotropic character [Figs. 8(d) and 8(e)]. Since NaFe0.9825Co0.0175As and NaFe0.955Co0.045As have similar Fermi surfaces, orbital characters and interaction parameters, the highly anisotropic gap distribution on the electron pockets of NaFe0.9825Co0.0175As is most likely a direct consequence of the coexisting SDW. Our data thus could be viewed as a positive support for the pairing symmetry in iron pnictides.
III.2.2 The nodal superconducting gap
Pairing symmetry is a pivotal characteristic for a superconductor. In the conventional BCS superconductors, the formation of Cooper pairs is due to the attractive interaction between electrons mediated by the electron-phonon interaction. Such pairing interaction results in an isotropic -wave pairing symmetry. However, for cuprates, since the Coulomb repulsive interaction between electrons is rather strong, an -wave pairing symmetry is favored energetically. The nodal gap structure measured by ARPES has played a critical role in establishing the -wave pairing picture there.
For iron-based superconductors, the situation is more complicated. There are both nodal and nodeless (gap) iron-based superconductors. The nodeless gap distributions, which could be attributed to -wave or s pairing symmetry, have been directly observed by ARPES and other techniques in Ba1-xKxFe2As2, Ba(Fe1-xCox)2As2, and so on Gap1 ; Gap2 . However, the signatures of nodal superconducting gap have been reported in LaOFeP, LiFeP, KFe2As2, BaFe2(As1-xPx)2, and BaFe2-xRuxAs2 by thermal conductivity, penetration depth, nuclear magnetic resonance, and scanning tunneling microscope (STM) measurements linenode7 ; linenode1 ; linenode2 ; linenode3 ; linenode4 ; linenode5 ; linenode6 .
Many theories have been proposed to understand the nodal behavior in iron pnictides. Particularly, it is predicted that the -based band would move to higher binding energy with increasing P doping in BaFe2(As1-xPx)2, and nodes would appear on the electron pockets when the hole Fermi pocket disappears. Figure 9 shows the experimental doping dependence of the three-dimensional Fermi surfaces in BaFe2(As1-xPx)2. It is found that the -originated hole pocket is always present for all dopings, which thus disproves the theories that explain the nodal gap based on the vanishing hole pocket zirongye .
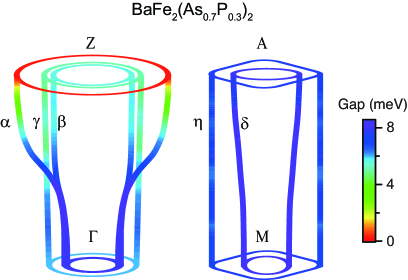
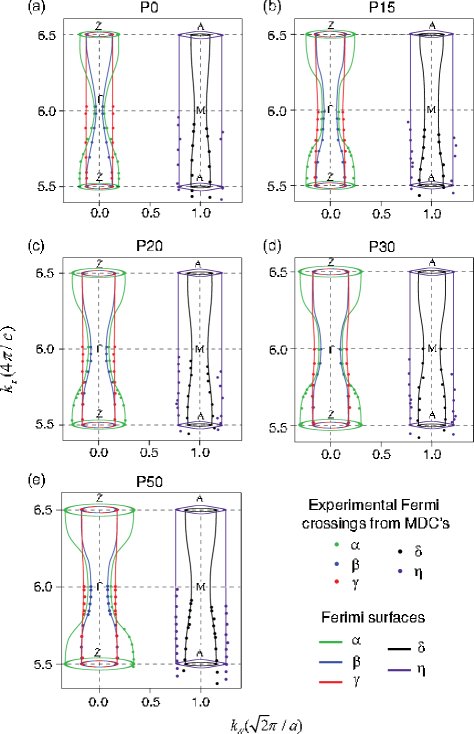
The most straightforward way to understand the nodal behavior or the pairing symmetry is to determine the momentum distribution of the superconducting gap. BaFe2(As0.7P0.3)2 is a typical iron pnictide with nodal superconducting gap. As shown in Fig. 10(a), it has three hole Fermi surface sheets (, and ) surrounding the central - Z axis of the Brillouin zone, and two electron Fermi surface sheets ( and ) around the zone corner. Detailed survey on the electron Fermi surface sheets exhibited a nodeless superconducting gap with little dependence. However, for the hole Fermi surface, the experimental data clearly showed a zero superconducting gap or nodes located around the Z point [Figs. 10(b) and 10(c)] Zhangnode .
The gap distribution of BaFe2(As0.7P0.3)2 is summarized in Fig. 11. Such a horizontal line-node distribution immediately rules out the -wave pairing symmetry, which would have given four vertical line nodes in the diagonal directions ( = , ), as in the cuprates. For the -wave pairing symmetry, the horizontal ring node around Z is not enforced by symmetry, as it is fully symmetric with respect to the point group. Therefore, the nodal ring is an “accidental” one, which is probably induced by the strong three-dimensional nature of the band Kuroki ; HuJP , for example its sizable d orbital character near Z [Fig. 10(d)]. This also explains why the gap is nodal for certain compounds and nodeless for some other compounds.
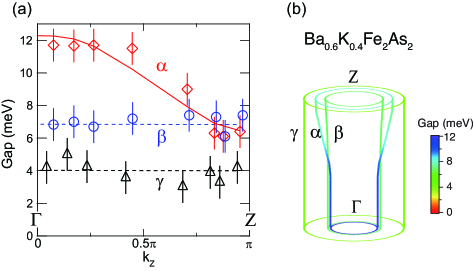
Furthermore, the strong dependence of the superconducting gap was also observed in Ba0.6K0.4Fe2As2 YanBaK . As shown in Fig. 12(a), the superconducting gap on the Fermi surface decreases significantly from to Z, while those on the and Fermi surfaces are relatively unchanged. Meanwhile, the dispersion of the band is much stronger than and [Fig. 12(b)]. The strong out-of-plane and orbital symmetry dependence of the superconducting gap in Ba0.6K0.4Fe2As2 and the horizontal nodal gap structure in BaFe2(As0.7P0.3)2 all indicate that the 3D electronic structure and multi-orbital nature play important roles in inducing the anisotropic or nodal gap structure in iron-based superconductors.
III.2.3 Correlations between the Fermi surface topology and superconductivity in iron pnictides
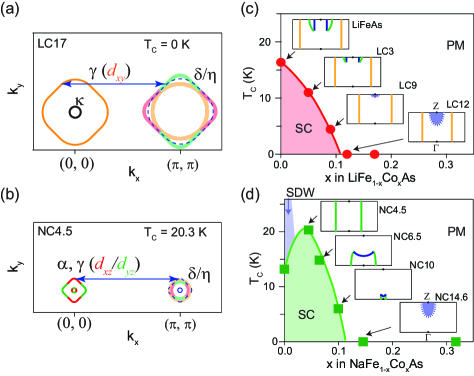
The correlation between the superconductivity in iron pnictides and their Fermi surface topology is elusive and controversial so far. Experimentally, at first, the nesting between any zone center hole Fermi surface and any zone corner electron Fermi surface was suggested to be important for the superconductivity. Later on, it was pointed out in BaFe2-xCoxAs2 and LiFeAs that Fermi surface nesting is unnecessary, while the presence of central hole pockets or Van Hove singularity are more important HDingBaK ; Kaminski ; Borisenko . Theoretically, a majority of studies indicate that the inter-pocket nesting would significantly enhance the superconductivity, while some predicted that the peaks near a Lifshitz transition KurokiT ; Mazin ; shape . In general, it appears that these contradicting correlations between Fermi surface topology and superconductivity are all partially supported by different experiments and theories, and there are always counter examples. This situation can be clarified when one realize that the correlation between Fermi surface topology and superconductivity is orbital-selective zirong . For both LiFe1-xCoxAs and NaFe1-xCoxAs series, it has been shown that the is maximized only by the perfect nesting between /-originated Fermi surfaces [Figs. 13(a) and 13(b)], while the superconductivity diminishes quickly after the central / hole Fermi surfaces disappear with electron doping [Figs. 13 (c) and 13(d)]. The orbital selective nature of these correlations clarify most previous controversies discussed above.
IV Iron-chalcogenides
IV.1 Fe1+yTe1-xSex
The iron-pnictides and iron-chalcogenides have many propertities in common. The FeSe(Te) layer in Fe1+yTe1-xSex is isostructural to the FeAs or FeP layer in iron pnictides. Fe1+ySe shows superconductivity at a as high as 37 K under a 7 GPa hydrostatic pressure, which is comparable to the iron-pnictides. On the other hand, unlike the collinear SDW state in iron-pnictides, the magnetic ground state of Fe1+yTe is a bicollinear commensurate or incommensurate antiferromagnetic state. Moreover, the magnetic moment in Fe1+yTe is about 2 , much lager than the 0.87 in BaFe2As2, or 0.36 in LaOFeAs.
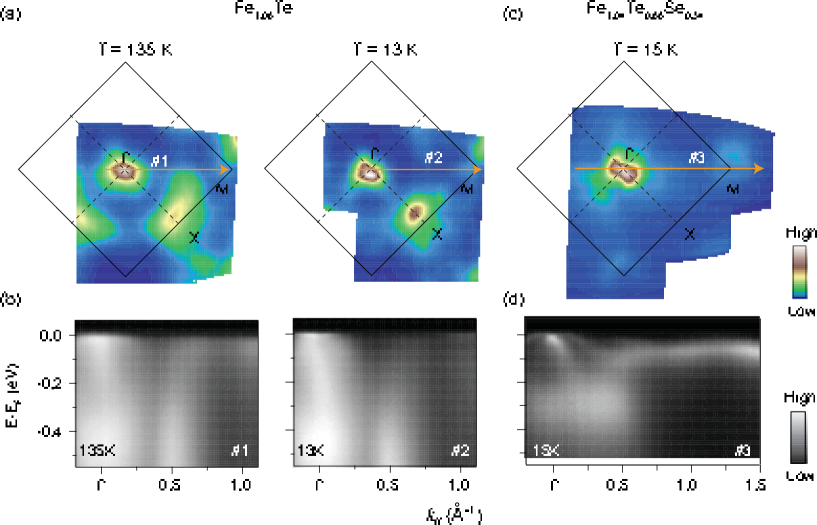
The electronic structure of Fe1.06Te is shown in Figs. 14(a) and 14(b). The band structure is characterized by very broad features. The Fermi surface could not be clearly resolved. However, intensive spectral weight could be observed near the X point. Moreover, the spectral weight is redistributed significantly with decreasing temperature. Sharp coherent peaks could be observed near at 13 K FeTePRB . Considering all these results, we conclude that Fe1.06Te distinguishes itself from iron-pnictides with much stronger local characters. The strong correlation effect and large spectral weight suppression near the could be responsible for the bicollinear magnetic order in Fe1.06Te.
The superconducting Fe1.04Te0.66Se0.34 with a of 15 K exhibits an electronic structure that resembles those of iron-pnictides [Fig. 14(c)] ChenPRB . There are three hole-like bands near the zone center and two electron-like bands near the zone corner. No spectral weight has been observed near the X point. The photoemission spectrum show sharp band dispersions, which is more coherent than that in Fe1.06Te [Fig. 14(d)]. Therefore, the correlation effect is weakened and the Fermi surface topology changes significantly upon the Se doping, which explains the emergence of superconductivity in Fe1+yTe1-xSex, and why it resembles the iron-pnictides.
IV.2 Alkali-metal-intercalated iron selenide
IV.2.1 Basic electronic structures of various phases and phase seperation
The discovery of AxFe2-ySe2 (A = K, Cs, Rb, …) superconductor with of about 31 K opens a new area in iron-based superconductor research kfsPRB . The phase diagram is still under debate. Many phases have been discovered in AxFe2-ySe2, including several insulating phases with different magnetic and vacancy orders, semiconducting phase, and superconducting phase. Therefore, one critical question is which phase is the parent phase for the superconductivity in AxFe2-ySe2 JQLi ; QKXue ; XHChen .
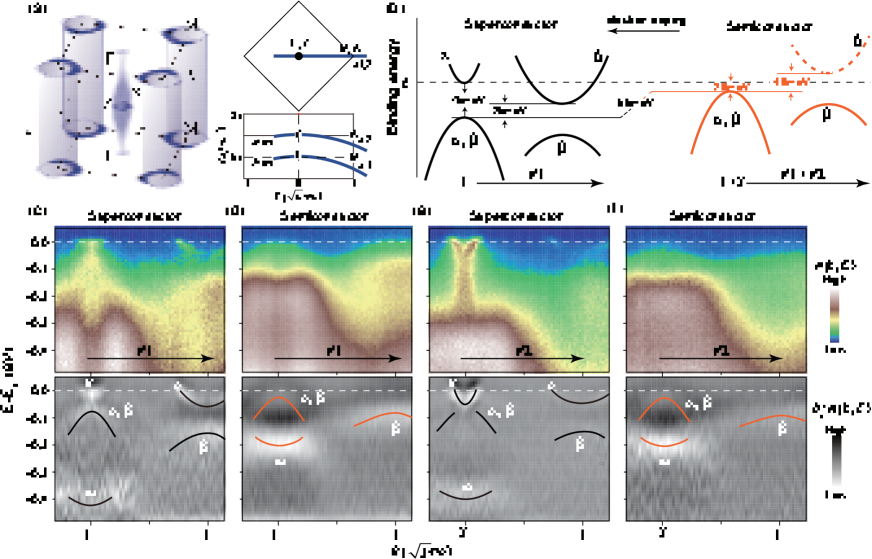
Starting from the superconducting phase, the band structure is shown in Figs. 15(a), (c) and (e). In contrast to all the other iron-based superconductors, the Fermi surface of superconducting KxFe2-ySe2 only consists of electron pockets. There are two large electron pockets /’ which are almost degenerated around each zone corner with little- dispersion and a small electron pocket around the Z point. This rather unique electronic structure in KxFe2-ySe2 further highlights the diversity of the iron-based superconductors.
Compared with the superconducting phase, for semiconducting phase [Figs. 15(d) and 15(f)], the band top of the hole-like and bands shifts up by 55 meV, and thus is about 20 meV below . The electron pockets /’ and disappear near in the semiconducting phase. The electronic structures of the superconducting and semiconducting phases are summarized in Fig. 15(b). Because they have similar electronic structures, the semiconducting phase is perhaps a closer parent compound to the KxFe2-ySe2 superconductor than the insulators are. With electron doping, the semiconductor might evolve into a superconductor. Such an interesting semiconducting phase has largely been neglected in previous theoretical and experimental studies. It could be a possible starting point for modeling the superconductivity in KxFe2-ySe2, which is rather unique compared with other high- superconductors.
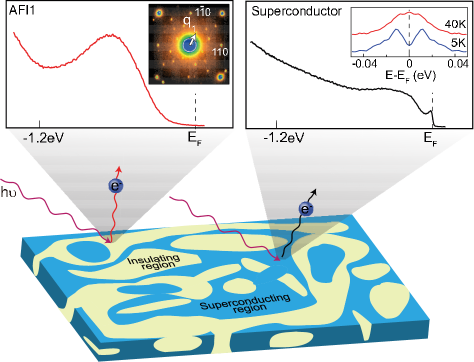
Based on the photoemission charging effects, we found that both the KxFe2-ySe2 superconductor and semicondtor are actually phase seprated ChenPRX . As sketched in Fig. 16, the superconductor is consisted of an antiferromagnetic insulating phase (AFI1), and a superconducting phase. The AFI1 phase is characterized by the vacancy order and a block antiferromagnetism as found in neutron scattering experiments. There is no density of state at the Fermi energy for AFI1. Such a phase separation in superconducting KxFe2-ySe2 is mesoscopic, which has been further confirmed by transmission-electron-microscope (TEM) and STM measurements QKXue .
IV.2.2 The superconducting gap distribution of KxFe2-ySe2
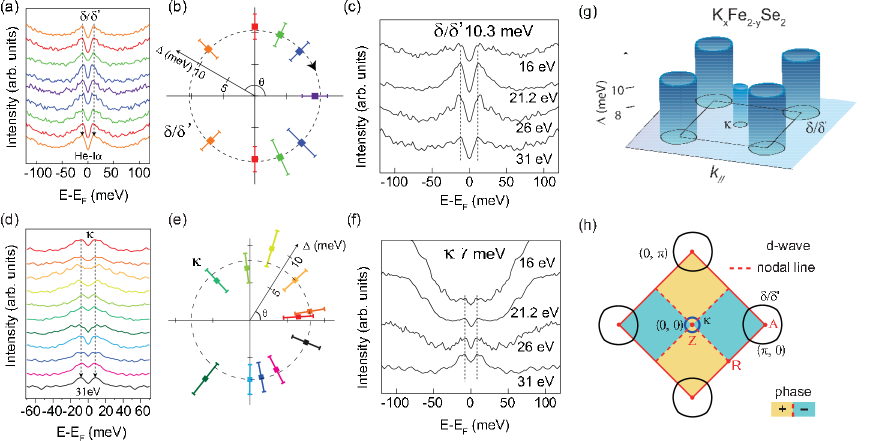
The spectral weight of insulating phases disappears near at low temperature due to the charging effect, so that the superconducting gap of the superconducting phase of KxFe2-ySe2 could be measured directly at low temperatures ChenPRX ; KFeSe . As shown in Fig. 17, the superconducting gap is isotropic with an amplitude of 10.3 meV on the /’ electron pockets [Figs. 17(a) and 17(b)]. Further data taken with different photon energies in Fig. 17(c) indicate such a gap does not vary much with . The gap on the pocket also shows isotropic character and little -dependence, which is always about 7 meV [Figs. 17(d)17(f)]. Figure 17(g) summarizes the superconducting gap distribution in the 3D momentum space.
The smaller gap at the zone center than those around the zone corner certainly violates the simple gap function of cos()cos() for the s-pairing order parameter suggested for the iron pnictides KFeSe . Moreover, as the Fermi surface size and spectral weight of the band are minimal, its contribution to the superconductivity would be rather negligible with such a small gap. Therefore, the superconductivity in KxFe2-ySe2 should mainly rely on the large electron pockets around the zone corner. This thus rules out the common s pairing symmetry proposal based on scattering between the hole and electron Fermi surface sheets in the iron-pnictides.
Theories based on local antiferromagnetic exchange interactions have predicted -wave pairing symmetry in this system that can account for the experimental results Hu ; Swave1 . However, calculations based on the scattering amongst the / electron pockets have indicated that the -wave pairing channel would win over the -wave pairing channel dwave1 ; dwave4 , which makes the superconducting order parameters to change sign between the neighboring / Fermi pockets as illustrated in Fig. 17(h). Because the four nodal directions (dashed lines) do not cross any of the / Fermi cylinders, it is consistent with the observed nodeless gap structure on the / electron pockets KFeSe . However as shown in Fig. 17(h), the nodal lines in the -wave pairing scenario actually cross the pocket, thus the observed isotropic superconducting gap on [Figs. 17(d) and 17(e)] favors the -wave pairing symmetry. This helps pin down the pairing symmetry of KxFe2-ySe2.
V Summary
Five years after the discovery of the superconductivity in iron-based superconductors, the mechanism of its superconductivity is yet to be revealed. However, ARPES has enabled us to unveil many critical information on iron-based superconductors and their parent compounds. We found that the low-lying electronic structures of iron-based superconductors are characterized by multi-band and multi-orbital nature. The Hund’s rule coupling and the fluctuating collinear spin order is responsible for the large electronic structure reconstruction, spin density wave and structural transition in iron-pnictides. However, the magnetic-ordered state in Fe1+yTe might be originated from the local antiferromagnetic exchange interactions. Upon doping, the superconductivity is enhanced by the Fermi surface nesting between / orbitals while diminishes quickly after the central / hole Fermi surfaces sink below . The superconducting gap of both iron pnictides and iron selenides might be described ubiquitously under the -wave pairing symmetry. Particularly, the nodal ring near Z in BaFe2(As1-xPx)2 is likely accidental, due to the strong mixing of the orbital on a hole Fermi surface sheet. The coexistence of SDW and superconductivity would cause anisotropic gap on the electron pockets. Moreover, the superconductivity in KxFe2-ySe2 is dominated by the large electron pockets at the zone corner, leading to a reconsideration of the superconducting mechanism established in iron pnictides. These results lay the foundation for the ultimate understanding of unconventional high- superconductivity in iron-based superconductors.
Looking into the future, there are still many important issues that remain to be resovled. For example, little is known on the superconductivity of 48 K in (TlRb)0.8Fe1.67Se2 under high pressure pressure , and there are still arguments regarding the nodal superconducting gap distribution in iron pnictides, thus more data need to be accumlated on materials like the overdoped BaFe2(As1-xPx)2, BaFe2-xRuxAs2 and so on. Moreover, a novel and complex pairing symmetry for the iron based superconductors have been proposed by Hu et al. Hupairing which are of the utter importance to be settled experimentally. On the other hand, intriguing novel pheonomena continuously emerge. Signs for superconductivity has been found at 65 K in mono-layer FeSe thin film on STO substrate zhou ; tan , which suggests that there is still room for futher enhancement of . Therefore, there are still plenty to be explored, and as always in this field, more surprises and discoveries are expected.
Acknowledgements: We are grateful for many collaborators for providing us the materials, helpful discussions, and experimental support at various synchrotron beamlines in the last five years. This work is supported in part by the National Science Foundation of China and National Basic Research Program of China (973 Program) under the grant Nos. 2012CB921400, 2011CB921802, 2011CBA00112.
References
- (1) Y. Kamihara, T. Watanabe, M. Hirano, and H. Hosono, J. Am. Chem. Soc. 130, 3296 (2008).
- (2) Johnpierre Paglione, and Richard L. Greene, Nature Physics 6, 645 (2010).
- (3) A. Damascelli, Z. Hussain and Z.-X. Shen, Rev. Mod. Phys. 75, 473 (2003).
- (4) Y. Zhang, F. Chen, C. He, B. Zhou, B. P. Xie, C. Fang, W. F. Tsai, X. H. Chen, H. Hayashi, J. Jiang, H. Iwasawa, K. Shimada, H. Namatame, M. Taniguchi, J. P. Hu, and D. L. Feng, Phys. Rev. B 83, 054510 (2011).
- (5) V. Brouet, M. Fuglsang Jensen, Ping-Hui Lin, A. Taleb-Ibrahimi, P. Le F vre, F. Bertran, Chia-Hui Lin, Wei Ku, D. Colson, A. Forget, arXiv, 1205.4513 (2012).
- (6) F. Ma and Z.-Y. Lu, Phys. Rev. B 78, 033111 (2008).
- (7) D. J. Singh and M. H. Du, Phys. Rev. Lett. 100, 237003 (2008).
- (8) L. X. Yang, Y. Zhang, H. W. Ou, J. F. Zhao, D. W. Shen, B. Zhou, J. Wei, F. Chen, M. Xu, C. He, Y. Chen, Z. D. Wang, X. F. Wang, T. Wu, G. Wu, X. H. Chen, M. Arita, K. Shimada, M. Taniguchi, Z. Y. Lu, T. Xiang, and D. L. Feng, Phys. Rev. Lett. 102, 107002 (2009).
- (9) L. X. Yang, B. Xie, Y. Zhang, C. He, Q. Q. Ge, X. F. Wang, X. H. Chen, M. Arita, J. Jiang, K. Shimada, M. Taniguchi, I. Vobornik, G. Rossi, J. P. Hu, D. H. Lu, Z. X. Shen, Z. Y. Lu, and D. L. Feng, Phys. Rev. B 82, 104519 (2010).
- (10) C. He, Y. Zhang, B. P. Xie, X. F. Wang, L. X. Yang, B. Zhou, F. Chen, M. Arita, K. Shimada, H. Namatame, M. Taniguchi, X. H. Chen, J. P. Hu, and D. L. Feng, Phys. Rev. Lett. 105, 117002 (2010).
- (11) C. de la Cruz, Q. Huang, J. W. Lynn, J. Li, W. R. Ii, J. L. Zarestky, H. A. Mook, G. F. Chen, J. L. Luo, N. L. Wang, and Pengcheng Dai, Nature 453, 899-902 (2008).
- (12) Q. Huang, Y. Qiu, W. Bao, M. A. Green, J. W. Lynn, Y. C. Gasparovic, T. Wu, G. Wu, and X. H. Chen, Phys. Rev. Lett. 101, 257003 (2008).
- (13) Y. Zhang, C. He, Z. Ye, J. Jiang, F. Chen, M. Xu, Q. Q. Ge, B. Xie, J. Wei, M. Aeschlimann, X. Y. Cui, M. Shi, J. P. Hu, and D. L. Feng, Phys. Rev. B 85, 085121 (2012).
- (14) J. Jiang, C. He, Y. Zhang, M. Xu, Q. Q. Ge, Z. R. Ye, F. Chen, B. P. Xie and D. L. Feng, arXiv, 1210.0397 (2012).
- (15) C. Fang, H. Yao, W.-F. Tsai, J. Hu, and S. A. Kivelson, Phys. Rev. B 77, 224509 (2008).
- (16) C.-C. Lee, W.-G. Yin, and W. Ku, Phys. Rev. Lett. 103, 267001 (2009).
- (17) Y. Zhang, J. Wei, H. W. Ou, J. F. Zhao, B. Zhou, F. Chen, M. Xu, C. He, G. Wu, H. Chen, M. Arita, K. Shimada, H. Namatame, M. Taniguchi, X. H. Chen, and D. L. Feng, Phys. Rev. Lett. 102, 127003 (2009).
- (18) K. Kaneko, A. Hoser, N. Caroca-Canales, A. Jesche, C. Krellner, O. Stockert, and C. Geibel, Phys. Rev. B 78, 212502 (2008).
- (19) Y. Xiao, Y. Su, M. Meven, R. Mittal, C. M. N. Kumar, T. Chatterji, S. Price, J. Persson, N. Kumar, S. K. Dhar, A. Thamizhavel, and Th. Brueckel, Phys. Rev. B 80, 174424 (2009).
- (20) A. I. Goldman, D. N. Argyriou, B. Ouladdiaf, T. Chatterji, A. Kreyssig, S. Nandi, N. Ni, S. L. Bud’ko, P.C. Canfield, and R. J. McQueeney, Phys. Rev. B 78, 100506 (2008).
- (21) Ying Chen, J. W. Lynn, J. Li, G. Li, G. F. Chen, J. L. Luo, N. L. Wang, Pengcheng Dai, C. dela Cruz, and H. A. Mook, Phys. Rev. B 78, 064515 (2008).
- (22) C. de la Cruz, Q. Huang, J. W. Lynn, J. Li, W. Ratcliff II, J. L. Zarestky, H. A. Mook, G. F. Chen, J. L. Luo, N. L. Wang and P. Dai, Nature (London) 453, 899 (2008).
- (23) M. Yi, D. H. Lu, J. G. Analytis, J.-H Chu, S,-K Mo, R,-H He, M. Hashimoto, R. G. Moore, I. I. Mazin, D. J. Shingh, Z. Hussain, I. R. Fisher, and Z.-X Shen, Phys. Rev. B. 80, 174510 (2009).
- (24) Stephen D. Wilson, Z. Yamani, C. R. Rotundu, B. Freelon, E. Bourret-Courchesne, and R. J. Birgeneau, Phys. Rev. B 79, 184519 (2009).
- (25) Jun Zhao, Q. Huang, Clarina de la Cruz, J. W. Lynn, M. D. Lumsden, Z. A. Ren, Jie Yang, Xiaolin Shen, Xiaoli Dong, Zhongxian Zhao, and Pengcheng Dai, Phys. Rev. B 78, 132504 (2008).
- (26) C. Lester, Jiun-Haw Chu, J. G. Analytis, S. C. Erickson, C. L. Condronm, M. F. Toney, I. R. Fisher, and S. M. Hayden, Phys. Rev. B 79, 144523 (2009).
- (27) J. T. Park, D. S. Inosov, Ch. Niedermayer, G. L. Sun, D. Haug, N. B. Christensen, R. Dinnebier, A. V. Boris, A. J. Drew, L. Schulz, T. Shapoval, U. Wolff, V. Neu, Xiaoping Yang, C. T. Lin, B. Keimer, and V. Hinkov, Phys. Rev. Lett. 102, 117006 (2009).
- (28) Shiliang Li, Clarina de la Cruz, Q. Huang, G. F. Chen, T.-L. Xia, J. L. Luo, N. L. Wang, and Pengcheng Dai, Phys. Rev. B 80, 020504 (2009).
- (29) Q. Q. Ge, Z. R. Ye, M. Xu, Y. Zhang, J. Jiang, B. P. Xie, Y. Song, C. L. Zhang, P. Dai and D. L. Feng, Physical Review X 3 (1), 011020 (2013).
- (30) D. Parker, M. G. Vavilov, A. V. Chubukov, and I. I. Mazin, Phys. Rev. B 80, 100508(R) (2009).
- (31) R. M. Fernandes, D. K. Pratt, W. Tian, J. Zarestky, A. Kreyssig, S. Nandi, M. G. Kim, A. Thaler, N. Ni, P. C. Canfield, R. J. McQueeney, J. Schmalian and A. I. Goldman, Phys. Rev. B 81 (14), 140501 (2010).
- (32) S. Maiti, R. M. Fernandes, and A. V. Chubukov, Phys. Rev. B 85, 144527 (2012).
- (33) H. Ding, P. Richard, K. Nakayama, K. Sugawara, T. Arakane, Y. Sekiba, A. Takayama, S. Souma, T. Sato, T. Takahashi, Z. Wang, X. Dai, Z. Fang, G. F. Chen, J. L. Luo,and N. L. Wang, Europhysics Letters 83, 47001 (2008).
- (34) K. Terashima, Y. Sekiba, J. H. Bowen, K. Nakayama, T. Kawahara, T. Sato, P. Richard, Y.-M. Xu, L. J. Li, G. H. Cao, Z.-A. Xu, H. Ding, T. Takahashi, Proceedings of the National Academy of Sciences of the USA 106, 7330-7333 (2009).
- (35) J. D. Fletcher, A. Serafin, L. Malone, J. G. Analytis, J. H. Chu, A. S. Erickson, I. R. Fisher and A. Carrington, Phys. Rev. Lett. 102 (14), 147001 (2009).
- (36) K. Hashimoto, M. Yamashita, S. Kasahara, Y. Senshu, N. Nakata, S. Tonegawa, K. Ikada, A. Serafin, A. Carrington, T. Terashima, H. Ikeda, T. Shibauchi, and Y. Matsuda, Phys. Rev. B 81, 220501 (2010).
- (37) M. Yamashita, Y. Senshu, T. Shibauchi, S. Kasahara, K. Hashimoto, D. Watanabe, H. Ikeda, T. Terashima, I. Vekhter, A. B. Vorontsov, and Y. Matsuda, Phys. Rev. B 84, 060507 (2011).
- (38) Y. Nakai, T. Iye, S. Kitagawa, K. Ishida, S. Kasahara, T. Shibauchi, Y. Matsuda, and T. Terashima, Phys. Rev. B 81, 020503 (2010).
- (39) K. Hashimoto, S. Kasahara, R. Katsumata, Y. Mizukami, M. Yamashita, H. Ikeda, T. Terashima, A. Carrington, Y. Matsuda and T. Shibauchi, Phys. Rev. Lett. 108 (4), 047003 (2012).
- (40) J. K. Dong, S. Y. Zhou, T. Y. Guan, H. Zhang, Y. F. Dai, X. Qiu, X. F. Wang, Y. He, X. H. Chen and S. Y. Li, Phys. Rev. Lett. 104 (8), 087005 (2010).
- (41) X. Qiu, S. Y. Zhou, H. Zhang, B. Y. Pan, X. C. Hong, Y. F. Dai, M. J. Eom, J. S. Kim, Z. R. Ye, Y. Zhang, D. L. Feng and S. Y. Li, Physical Review X 2 (1), 011010 (2012).
- (42) Z. R. Ye, Y. Zhang, F. Chen, M. Xu, Q. Q. Ge, J. Jiang, B. P. Xie and D. L. Feng, Phys. Rev. B 86 (3), 035136 (2012).
- (43) Y. Zhang, Z. R. Ye, Q. Q. Ge, F. Chen, J. Jiang, M. Xu, B. P. Xie and D. L. Feng, Nature Physics 8 (5), 371-375 (2012).
- (44) K. Suzuki, H. Usui, K. Kuroki, J. Phys. Soc. Jpn. 80, 013710 (2011).
- (45) Y. Su, C. Setty, Z. Wang, and J. Hu, Phys. Rev. B 85, 184517 (2012).
- (46) Y. Zhang, L. X. Yang, F. Chen, B. Zhou, X. F. Wang, X. H. Chen, M. Arita, K. Shimada, H. Namatame, M. Taniguchi, J. P. Hu, B. P. Xie and D. L. Feng, Phys. Rev. Lett. 105 (11), 117003 (2010).
- (47) H. Ding and et al., EPL (Europhysics Letters) 83 (4), 47001 (2008).
- (48) C. Liu, A. D. Palczewski, R. S. Dhaka, T. Kondo, R. M. Fernandes, E. D. Mun, H. Hodovanets, A. N. Thaler, J. Schmalian, S. L. Bud ko, P. C. Canfield and A. Kaminski, Phys. Rev. B 84 (2), 020509 (2011).
- (49) S. V. Borisenko, V. B. Zabolotnyy, D. V. Evtushinsky, T. K. Kim, I. V. Morozov, A. N. Yaresko, A. A. Kordyuk, G. Behr, A. Vasiliev, R. Follath, uuml and B. chner, Phys. Rev. Lett. 105, 067002 (2010)
- (50) K. Kuroki, S. Onari, R. Arita, H. Usui, Y. Tanaka, H. Kontani and H. Aoki, Phys. Rev. Lett. 101 (8), 087004 (2008).
- (51) I. I. Mazin, D. J. Singh, M. D. Johannes, and M. H. Du,Phys. Rev. Lett. 101 (5), 057003 (2008).
- (52) I. Davide, et al., Superconductor Science and Technology 24 (1), 015012 (2011).
- (53) Z. R. Ye, Y. Zhang, M. Xu, Q. Q. Ge, Q. Fan, F. Chen, J. Jiang, P. S. Wang, J. Dai, W. Yu, B. P. Xie and D. L. Feng, arXiv, 1303.0682 (2013).
- (54) Y. Zhang, F. Chen, C. He, L. X. Yang, B. P. Xie, Y. L. Xie, X. H. Chen, Minghu Fang, M. Arita, K. Shimada, H. Namatame, M. Taniguchi, J. P. Hu, and D. L. Feng, Phys. Rev. B 82, 165113 (2010).
- (55) F. Chen, B. Zhou, Y. Zhang, J. Wei, H. W. Ou, J. F. Zhao, C. He, Q. Q. Ge, M. Arita, K. Shimada, H. Namatame, M. Taniguchi, Z. Y. Lu, J. P. Hu, X. Y. Cui, and D. L. Feng, Phys. Rev. B 81, 014526 (2010).
- (56) Jiangang Guo, Shifeng Jin, Gang Wang, Shunchong Wang, Kaixing Zhu, Tingting Zhou, Meng He, and Xiaolong Chen, Phys. Rev. B 82, 180520 (2010).
- (57) Z. Wang, Y. J. Song, H. L. Shi, Z.W. Wang, Z.Chen, H. F. Tian, G. F. Chen, J. G. Guo, H. X. Yang, and J. Q. Li, arXiv, 1101.2059 (2011).
- (58) Wei Li, Hao Ding, Peng Deng, Kai Chang, Canli Song, Ke He, Lili Wang, Xucun Ma, Jiang-Ping Hu, Xi Chen, and Qi-Kun Xue, arXiv, 1108.0069 (2011).
- (59) Y. J. Yan, M. Zhang, A. F. Wang, J. J. Ying, Z. Y. Li, W. Qin, X. G. Luo, J. Q. Li, Jiangping Hu, and X. H. Chen, arXiv, 1104.4941 (2011).
- (60) F. Chen, M. Xu, Q. Q. Ge, Y. Zhang, Z. R. Ye, L. X. Yang, Juan Jiang, B. P. Xie, R. C. Che, M. Zhang, A. F. Wang, X. H. Chen, D. W. Shen, J. P. Hu, and D.L. Feng, Phys. Rev. X 1, 021020 (2011).
- (61) Y. Zhang, L. X. Yang, M. Xu, Z. R. Ye, F. Chen, C. He, H. C. Xu, J. Jiang, B. P. Xie, J. J. Ying, X. F. Wang, X. H. Chen, J. P. Hu, M. Matsunami, S. Kimura, and D. L. Feng, Nature Materials 10, 273 (2011).
- (62) J. P. Hu and H. Ding, Scientific Reports 2, 381 (2012).
- (63) R. Yu, P. Goswami, Q. M. Si, P. Nikolic and J. X. Zhu, arXiv:1103.3259 (2011).
- (64) F. Wang, F. Yang, M. Gao, Z. Y. Lu, T. Xiang and D. H. Lee, Europhys. Lett. 93, 57003 (2011).
- (65) T. A. Maier, S. Graser, P. J. Hirschfeld and D. J. Scalapino, Phys. Rev. B 83, 100515 (2011).
- (66) M. Xu, Q. Q. Ge, R. Peng, Z. R. Ye, J. Jiang, F. Chen, X. P. Shen, B. P. Xie, Y. Zhang, A. F. Wang, X. F. Wang, X. H. Chen and D. L. Feng, Phys. Rev. B 85 (22), 220504 (2012).
- (67) P. Gao, R. Yu, L. Sun, H. Wang, Z. Wang, Q. Wu, M. Fang, G. Chen, J. Guo, C. Zhang, D. Gu, H. Tian, J. Li, J. Liu, Y. Li, X. Li, Q. Si and Z. Zhao, arXiv, 1209.1340 (2012).
- (68) Jiangping Hu, Ningning Hao, Xianxin Wu, arXiv, 1303.2624 (2013).
- (69) S. He, J. He, W. Zhang, L. Zhao, D. Liu, X. Liu, D. Mou, Y.-B. Ou, Q.-Y. Wang, Z. Li, L. Wang, Y. Peng, Y. Liu, C. Chen, L. Yu, G. Liu, X. Dong, J. Zhang, C. Chen, Z. Xu, X. Chen, X. Ma, Q. Xue and X. J. Zhou, arXiv, 1207.6823 (2012).
- (70) S. Y. Tan, M. Xia, Y. Zhang, Z. R. Ye, F. Chen, X. Xie, R. Peng, D. F. Xu, Q. Fan, H. C. Xu, J. Juan, T. Zhang, X. C. Lai, T. Xiang, J. P. Hu, B. P. Xie and D. L. Feng, Nature Materials 12 (7), 634-640 (2013).