LHCP 2013
Study of Higgs Production in Fermionic Decay Channels at CMS
Abstract
In these proceedings to the LHCP conference 2013 results are presented on the study of the Higgs-like particle at a mass of 125 GeV decaying into final states consisting of either , or a quark pair, based on the full statistics of about 24 fb-1, collected in 2011 and 2012 at 7 and 8 TeV respectively with the CMS experiment at the Large Hadron Collider. Leptonic and hadronic decay channels for the -lepton are included in the search. Different production channels namely gluon fusion, vector boson fusion (VBF) and associated production with W/Z bosons have been studied final states. The decay channel is studied in VBF as well as in associated production with W/Z and top quarks.
1 Introduction
The recently discovered Higgs-like particle atlasHigObs ; cmsHigObs has properties so far consistent with the Standard Model (SM) expectation in terms of spin, parity and couplings atlasCombo ; cmsCombo . However the excess in fermionic decay channels is still not firmly established. Therefore the study of Higgs properties in fermionic decay channels is of great importance to confirm or disprove the SM nature of the discovered Boson. In the SM with the present dataset of approximately 24 fb-1 delivered by the Large Hadron Collider (LHC) and recorded by the CMS experiment cmsJINST the Higgs decay modes into (denoted by in the following) and are accessible. For a mass of 125 GeV the branching ratios are about 6.2% for the decay and about 57% for the decay. In the decay channel the different production modes are very difficult to access and suffer from very different background composition, therefore different analysis techniques are used to extract the Higgs signal in each production mode. The studied production modes cover gluon fusion (only in ), vector boson fusion (VBF) and associated production with W/Z bosons and top quarks (only in ).
In these proceedings the four main analysis channels in fermionic decay modes, , , VBF- and are summarized.
2 channel
In the channel cmsHtt a combined analysis on the invariant mass distribution is employed. The analysis uses the full 7 and 8 TeV dataset of fb-1. The combined analysis tests the following production modes: gluon fusion, VBF and associated production with a vector boson. Five independent -pair final states have been studied: , , and channels where denotes a reconstructed hadronic decay. The one-jet category selects primarily signal events with a Higgs boson produced by gluon fusion, or in association with a or boson decaying hadronically. Events in the VBF category are required to have two jets separated by a large rapidity gap, which mainly selects signal events with a Higgs boson produced by VBF and strongly enhances the signal contribution.
The event categories are defined in the following way, using jets within .
-
•
VBF: In the VBF category, two jets with GeV are required to tag the vector-boson fusion Higgs-production process. The two jets must have an invariant mass GeV and be separated in pseudorapidity by . A rapidity gap is defined by requiring no additional jet with GeV between the two tagging jets. In the channel, the large background contribution is suppressed by rejecting events containing a -tagged jet of GeV.
-
•
1-jet: Events in this category are required to have at least one jet with GeV, not to be part of the VBF event category, and not to contain any -tagged jet with GeV. In the channel, the large background from Z + jets events in which an electron is misidentified as is reduced by requiring GeV.
-
•
0-jet: This category contains all events with no jet with GeV, and no -tagged jet with GeV. The 0-jet category is only used to constrain background normalization, identification efficiencies, and energy scales.
Backgrounds are estimated mainly from the data itself. The dominant Drell–Yan production is estimated by an “embedding” technique selecting events and replacing the muons with simulated decays. Background from + jets production is estimated in a high-transverse mass control region dominated by the + jets and extrapolated to the signal region using simulated events. QCD backgrounds are estimated from same-sign events in data. Other small background components are estimated using MC simulations.
The SVFit algorithm is used to improve mass reconstruction in all final states and categories allowing a better separation between signal and background than using only the invariant mass from visible decay products by utilizing the measurement of the missing transverse energy.
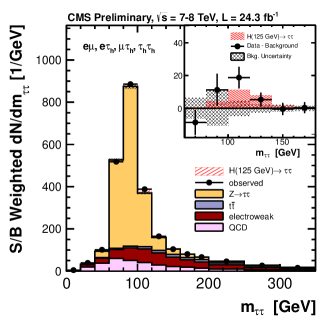
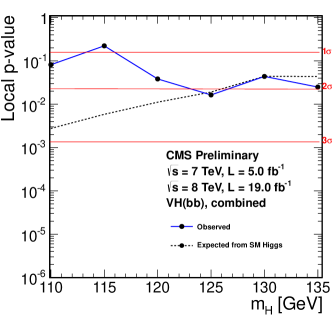
Figure 1 shows the combined observed and expected distributions, weighting all distributions in each category by the ratio between the expected signal and background yields for this category in a interval containing 68% of the signal. It also shows the difference between the observed data and expected background distributions, together with the expected distribution for a SM Higgs boson signal with GeV.
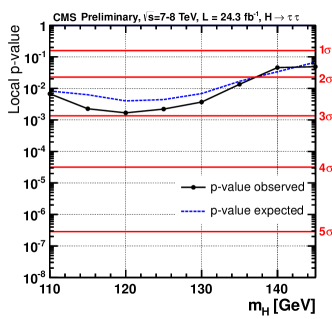
The best-fit value for the signal strength combining all channels is at = 125 GeV. Fig. 2 shows the expected and observed p-value versus Higgs boson mass. The observed excess is compatible with the presence of a standard model Higgs boson of mass GeV, for which the local significance is .
3 channel
In the channel cmsttHbb the events are classified based on the decay of the associated top quarks: lepton+jets and dilepton events. The dominant background consists of events. The analysis uses the full 7 TeV and the first fb-1 of the 8 TeV dataset, so in total an integrated luminosity of fb-1.
To increase the sensitivity of the analysis selected events are separated into different categories based on the number of jets and -tags. For lepton+jets events, the following seven categories are used: 6 jets + 2 b-tags, 4 jets + 3 b-tags, 5 jets + 3 b-tags, 6 jets + 3 b-tags, 4 jets + 4 b-tags, 5 jets + 4 b-tags, and 6 jets + 4 b-tags. For dilepton events, only two categories are used: 2 jets + 2 b-tags and 3 jets + 3 b-tags.
Artificial neural networks (ANNs) are used in all categories of the analysis to further discriminate signal from background and improve signal sensitivity. Separate ANNs are trained for each jet-tag category, and the choice of input variables is optimized for each as well. The ANN input variables considered are related to object kinematics, event shape, and the discriminant output from the b-tagging algorithm. A total of 24 input variables has been considered where only a subset has been used in each category.
Backgrounds are estimated from MC simulation and the dominant systematic uncertainties originate from the theoretical uncertainty as well as from b-tagging.
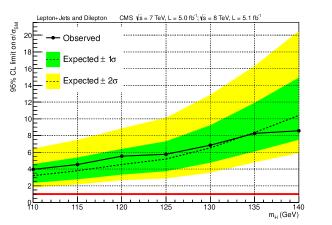
The observed (expected) 95% confidence level (CL) limit on the cross section for Higgs boson production in association with top-quark pairs for masses from 110–140 GeV, have been derived using the 7 TeV and 8 TeV samples (Fig. 3). No significant excess is found and the limit at a Higgs boson mass of GeV is 5.8 (5.2) times the standard model expectation.
4 VBF- channel
In the VBF- channel cmsVBFHbb events are characterized by two forward quark jets and two -jets originating from the decay of the Higgs boson. The by far dominant background consists of purely QCD multi-jet events which already were reduced at the trigger level. Data at a center of mass energy of TeV corresponding to an integrated luminosity of 19 fb-1 have been analyzed. The events are selected by requiring four jets with GeV. The four jets are ordered in pairs labeled “bb” and “qq” alternatively with b-tag ordering, where the “qq” pair is made with least b-tagged jets, and with ordering, where the “qq” pair is the most -separated jet pair. For both orderings the event selection further requires GeV and . Finally, to remove the large QCD contribution of back-to-back pairs, events are required to satisfy , for the b-tag ordered jet pair only.
To further identify if the less b-tagged jet pair among the four leading jets is likely to originate from the hadronization of a light (u,d,s-type) quark, as for signal VBF tagging jets, or from gluons, as is more probable for jets produced in QCD processes, a quark-gluon discriminator has been applied to the b-tag sorted “qq” candidate jets.
The signal extraction is performed on the pair invariant mass distribution. To improve the mass resolution a neural network regression technique is employed. The sensitivity of the analysis within pre-selection is improved by classifying the events based on a neural network using the characteristics of the “qq” jet pair in order not to bias the pair invariant mass distribution.
Data are categorized in four categories and a polynomial of fifth degree is used to model the QCD continuum background. A fit of the pair invariant mass distribution in the most sensitive category is shown in Fig. 4.
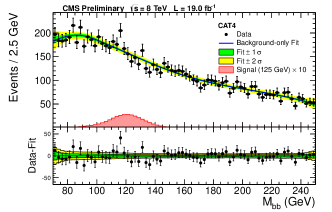
To validate the search strategy the fit is performed in the same way as for the Higgs boson search, but trying to extract VBF Z production with . The data yields 28441127 events in the Z peak, i.e. a fit of the Z peak with a significance of 2.5 standard deviations, in agreement with expectations derived using Monte Carlo pseudo experiments.
Based on all four categories upper limits, at the 95% confidence level, on the production cross section times the branching ratio, with respect to the expectations for a standard model Higgs boson, are derived for a Higgs boson in the mass range 115–135 GeV. In this range, the expected upper limits in the absence of a signal vary from 2.4 to 4.1 times the standard model prediction, while the corresponding observed upper limits vary from 2.4 to 5.2 (Fig. 5).
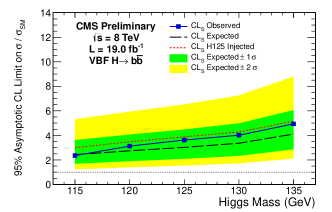
At a Higgs boson mass of 125 GeV the expected limit is 3.0 and the observed limit is 3.6. The fitted signal strength is .
5 channel
In the channel cmsVHbb the full LHC dataset of fb-1 at 7 TeV and 8 TeV has been analyzed. The following modes are included in the search: , , , , and , all with the Higgs boson decaying to .
The background processes to VH production originate from vector-boson+jets (V+jets), , single-top and dibosons (VV) production. Except for diboson production, these processes have production cross sections that are several orders of magnitude larger than Higgs boson production. The diboson production cross section is only a few times larger than the production cross section for VH and, given the nearly identical final state for VZ with , this process provides a benchmark against which the Higgs boson search strategy is tested.
Backgrounds are reduced by requiring a boost of the of the vector boson, . In that case the Higgs and Vector boson recoil away from each other with a large azimuthal opening angle, , between them. For each mode, different regions of boost are considered. Due to different signal and background composition, each boost region has different sensitivity and the analysis is performed separately in each region. The results from all regions are then combined for each channel. The “low”, “intermediate”, and “high” boost regions for the and channels are GeV, GeV, and GeV. For the a single GeV region is considered. For the channel the “low”, “intermediate”, and “high” boost regions are GeV, GeV and GeV, and for the channels, the “low” and “high” regions are GeV and GeV.
The Higgs boson mass resolution is improved by applying a bosted decision tree (BDT) regression technique. Using this a further correction, beyond the standard CMS jet energy corrections, for individual -jets improves the invariant mass resolution by around 15%.
To estimate the backgrounds a set of simultaneous fits is performed to several distributions of discriminating variables in the control regions, separately in each channel, to obtain consistent scale factors by which the Monte Carlo yields are adjusted.
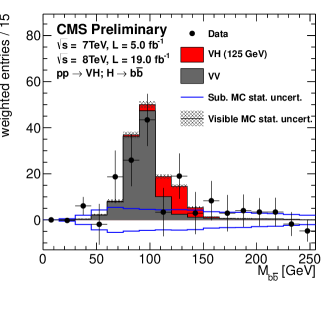
In each of the categories a boosted decision tree discriminator is used to distinguish signal from background events. Input variables consist of topological information, b-tag related quantities and kinematic quantities. The most important variable in the analysis is the mass of the system (see Fig. 6), which is also used as input to the BDT. To extract the VH signal a combined fit to all BDT distributions is employed.
As a validation of the multi-variate approach to this analysis, these BDT discriminants are also trained to find diboson signals (ZZ and WZ, with Z) rather than the VH production signal. Using this Diboson BDT the VZ process with respect to the NLO VZ cross-section, is measured to be with a significance exceeding .
Additionally a shape analysis on the mass as a single variable is used to perform a cross-check analysis of the BDT for both VZ and VH signals, yielding consistent results for both cases.
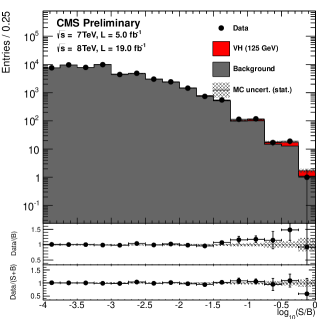
A summary of the BDT analysis is shown in Fig. 7 where all bins in the different categories are shown sorted by their . An excess is visible in the most significant bins of the analysis.
Upper limits, at the 95% confidence level, on the VH production cross section times the branching ratio, with respect to the expectations for a standard model Higgs boson, are derived for a Higgs boson in the mass range 110–135 GeV. In this range, the observed upper limits vary from 1.1 to 3.1 times the SM prediction; the corresponding expected limits vary from 0.7 to 1.5. At a Higgs boson mass of 125 GeV the observed limit is 1.89 while the expected limit is 0.95. An excess of events is observed above the expected background with a local significance of 2.1 standard deviations, which is consistent with the expectation from the production of the SM Higgs boson (Fig. 8). The signal strength corresponding to this excess, relative to that of the SM Higgs boson, is .
6 Summary
Four analysis of Higgs boson production in fermionic decay channels have been presented. Different production channels namely gluon fusion, vector boson fusion (VBF) and associated production with W/Z bosons have been studied in the mode. The decay channel has been studied in VBF as well as in associated production with W/Z and top quarks. All derived limits, significances of the excesses and signal strength with respect to the SM expectations in the four analysis are summarized in Tab. 1.
| Channel | Limit | Significance | -value |
|---|---|---|---|
| 2 (0.83) | 2.9 | ||
| 1.9 (0.95) | 2.1 | ||
| VBF- | 3.6 (3.0) | - | |
| 5.8 (5.2) | - | - |
In the and first hints of a signal are emerging at a significance above . Individually non of the channels is able to claim an evidence for Higgs decays into fermions at present.
However, a combination of the and the analysis yields an observed significance of 3.4 cmsCombo at a Higgs boson mass of 125 GeV, which can be interpreted as evidence for decays of the Higgs boson into fermions.
Nevertheless a larger dataset will be needed to firmly establish all Higgs boson decay and production processes in fermionic decay channels. This dataset is expected to be collected at a higher center of mass energy during the LHC Run 2 starting in 2015.
References
- (1) Atlas Collaboration, Physics Letters B 716, 1 - 29 (2012)
- (2) CMS Collaboration, Physics Letters B 716, 30 - 61 (2012)
- (3) Atlas Collaboration, Atlas conference note ATLAS-CONF-2013-040, 2013
- (4) CMS Collaboration, CMS physics analysis summary HIG-13-005, 2013
- (5) CMS Collaboration, Journal of Instrumentation 3, S08004 (2008)
- (6) CMS Collaboration, CMS physics analysis summary HIG-13-004, 2013
- (7) CMS Collaboration, Journal of High Energy Physics 5, 1-47 (2013)
- (8) CMS Collaboration, CMS physics analysis summary HIG-13-011, 2013
- (9) CMS Collaboration, CMS physics analysis summary HIG-13-012, 2013