Phase diagrams of voltage-gated oxide interfaces with strong Rashba coupling
Abstract
We propose a model for the two-dimensional electron gas formed at the interface of oxide heterostructures that includes a Rashba spin-orbit coupling proportional to an electric field oriented perpendicularly to the interface. Taking into account the electron density dependence of this electric field confining the electron gas at the interface, we report the occurrence of a phase separation instability (signaled by a negative compressibility) for realistic values of the spin-orbit coupling and of the electronic band-structure parameters at zero temperature. We extend the analysis to finite temperatures and in the presence of an in-plane magnetic field, thereby obtaining two phase diagrams which exhibit a phase separation dome. By varying the gating potential the phase separation dome may shrink and vanish at zero temperature into a quantum critical point where the charge fluctuates dynamically. Similarly the phase separation may be spoiled by a planar magnetic field even at zero temperature leading to a line of quantum critical points.
pacs:
71.70.Ej,73.20.-r,73.43.Nq,74.81.-gI Introduction
The observation of a two-dimensional (2D) metallic state at the interface of two insulating oxides LaAlO3/SrTiO3 (LAO/STO) ohtomo ; Mannhart:2008uj ; Mannhart:2010ha ; Hwang:2012nm has brought forward a novel class of high-mobility electron gases (EGs) which proves to be important in both theoretical and practical prospects. The occurrence of superconductivity in this 2DEGreyren ; triscone and in similar heterostructures such as LaTiO3/SrTiO3 (LTO/STO),espci1 ; espci2 with the possibility to control the transition by voltage gating, has further attracted great attention. There is however increasing evidence that inhomogeneity plays a relevant role in these systems. Not only is the large width of the superconducting transition measured in transport experiments a clear indication of charge inhomogeneity,CGBC ; BCCG ; caprara but also magnetometry,ariando ; luli ; bert ; metha1 ; metha2 ; bert2012 tunneling,ristic and piezoforce spectroscopyfeng_bi report inhomogeneities on a submicrometric scale. Extrinsic mechanisms, like impurities and defects, surely introduce inhomogeneities.bristowe However, the recent discovery of negative compressibility in a low filling regimemannhart provides, in our opinion, a clear indication that intrinsic mechanisms (i.e., effective electron-electron attractions) are present, which may render these 2DEGs inhomogeneous by phase separation even in a perfectly clean and expectedly homogeneous system. Moreover, even if such mechanisms were not strong enough to drive the EG unstable, they would still increase the charge susceptibility, reinforcing the extrinsic mechanisms.
Several mechanisms providing negative contributions to the electronic compressibility are known,eisenstein like the exchange term of the repulsive electron-electron interaction or the confinement mechanism forcing the EG at the interface. The former mechanism is only active at very low densities (even for semiconducting systems) up to a threshold density , which is further reduced by large values of the dielectric constant. Therefore, this mechanism is surely not effective at the densities relevant for the metallic regime of the 2DEG in LXO/STO interfaces (henceforth, the symbol LXO stands for LAO or LTO, whenever we generically refer to both), where the typical electron density is quite large, of order of electrons per cell, and the STO dielectric constant may reach very high values, of order of . On the other hand, concerning the latter mechanism, the self-consistent solution of the Schrödinger and Poisson equations relating the electronic wavefunctions and the electric potential arising from external potential and electronic density itself usually showseisenstein that the EG becomes more compressible once its finite transverse confinement is taken into account. Also in this case the large dielectric constant of the material hosting the EG favors its “softening”, leading to an increased compressibility. Whether and under which conditions this mechanism may lead alone to a negative compressibility and to phase separation is presently under investigation.scopigno In this general framework, looking for possible realistic sources of intrinsic mechanisms of phase separation, we recently proposed a possible explanation for the occurrence of an inhomogeneous electronic phase, which is based on a coupling between the electron orbital degree of freedom and its spin.CPG The confinement of the 2DEG at the interface restricts the electronic motion to the plane parallel to the interface, while the electric field confining the electrons is oriented perpendicularly. In this configuration, the interaction between the moving electron and the electric field gives rise to the so-called Rashba spin-orbit coupling (RSOC);rsoc in simple terms, the moving electron perceives the electric field as a magnetic field in its rest frame, which then couples to its spin. As it will be explained in detail below, the key point of our argument is the dual role assumed by the confining electric field; the field is proportional to the electron density and controls at the same time the RSOC. This leads to a density-dependent RSOC (via the electric field). Since the band structure depends on the strength of the coupling, the system acquires a non-rigid band structure which evolves as a function of the electron density. This non-rigidity gives rise to a 2DEG which may differ strongly from a standard metallic system with rigid bands. For instance, the chemical potential in the latter case is an increasing function of the electron density and the compressibility is always positive. This statement holds no longer true for a system with non-rigid bands; the 2DEG may be in a (thermodynamically unstable) phase with a negative compressibility and separate into two sub-phases with densities and .
The analysis of the precise conditions leading to such an unstable phase will be the focus of this paper, which is organized as follows. In section II we present in detail our model used for the description of the 2DEG at the interface. We study the model at zero and low temperatures as well as zero and small in-plane magnetic field and report the obtained results in section III-V. Our concluding remarks are given in section VII.
II Model
II.1 Origin of the 2DEG
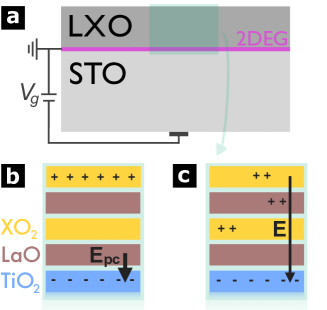
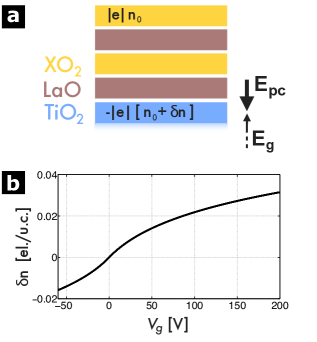
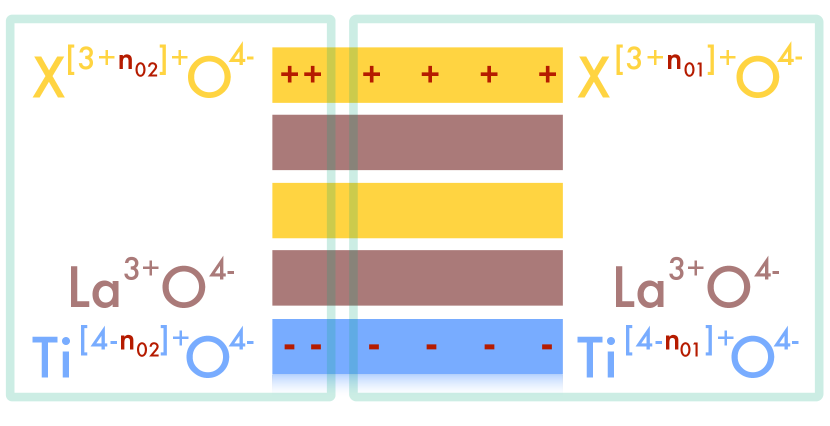
The prototype systems we have in mind are oxide heterostructures formed by an STO bulk with a thin LXO film (of the order of a few unit cells) on top [Fig. 1(a)]. The LXO film consists of alternating polar layers of (LaO)+ and (XO2)-, with XAl,Ti, whereas the STO bulk is formed by non-polar layers of TiO2 and SrO. This difference in polarity leads to a charge discontinuity at the interface. Depending on the termination, two different types of interface may arise: XO2/LaO/TiO2, called n-type, and XO2/SrO/TiO2, called p-type. In both cases, the charge discontinuity at the interface leads to a build-up of the electrical potential in the LXO film which increases monotonically with the number of layers and would diverge for an infinite number of layers. Due to this (theoretical) divergence, the scenario is termed polarity catastrophe.polarity ; popovic ; bands1 ; bands2 ; bands3 According to theory, the system avoids this unphysical limit through a redistribution of the charges at the interface. By adding half an electron per unit cell to the interfacial TiO2 layer coming from the uppermost XO2 layer (n-type), or by removing half an electron from the interfacial SrO plane in the form of oxygen vacancies (p-type), a small dipole arises that causes the electric field to oscillate about zero and the potential to remain bounded. While n-type interfaces exhibit a metallic behavior, experiments show that p-type interfaces are insulating. The experiments further report a smaller transferred amount of charge of order electrons per unit cell (el./u.c.),hirayama ; parkmillis instead of the theoretical el./u.c. (see Fig. 1(b) for an illustration). These charges create a strong electric field,
where is the dielectric constant of LXO and m is the linear size of the STO unit cell.
The polarity catastrophe is not the only mechanism leading to the formation of a 2DEG at the LXO/STO interface. The gas can be also formed as a consequence of oxygen vacancies (mostly located in LXO, which is interposed between LTO and vacuum), that act as electron dopants, each oxygen vacancy nominally providing two electrons [see Fig. 1(c)]. These additional electrons then are confined at the interface by the self-consistent potential due to the other electrostatic fields (e.g., bulk fields or gates) and the electronic density itself. Solving the Schrödinger and Poisson equations one finds that this confining potential generates an electric field perpendicular to the interface which is roughly proportional to the density of the confined electrons. Therefore also oxygen vacancies eventually produce an interface field, which is strictly related to the local density of the 2DEG, similarly to the outcome of the polarity catastrophe. The orders of magnitude, as expected in the presence of similar confined densities, should be comparable.
In our model, we focus on n-type interfaces. For the sake of concreteness, but without being necessarily tied to this mechanism, we consider here electronic charges due to the polarity catastrophe and explore a range of values of up to el/u.c. (corresponding to an electric field V m-1), in which, as we will show, the system may undergo electronic phase separation.
II.2 Effect of Gate Voltage
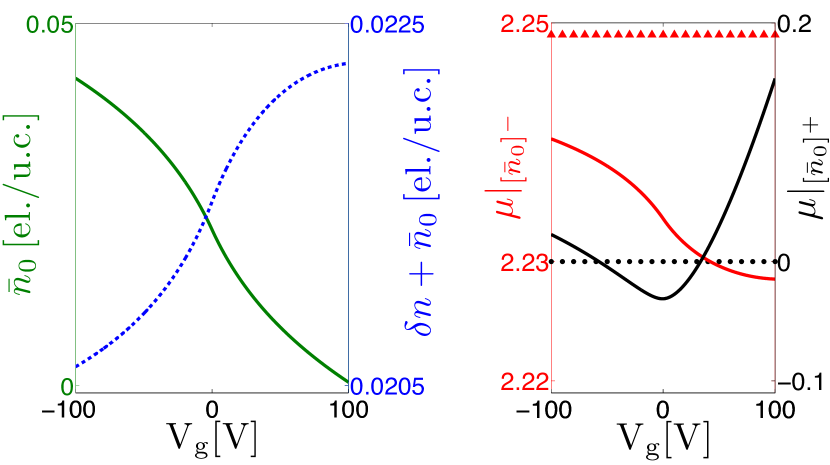
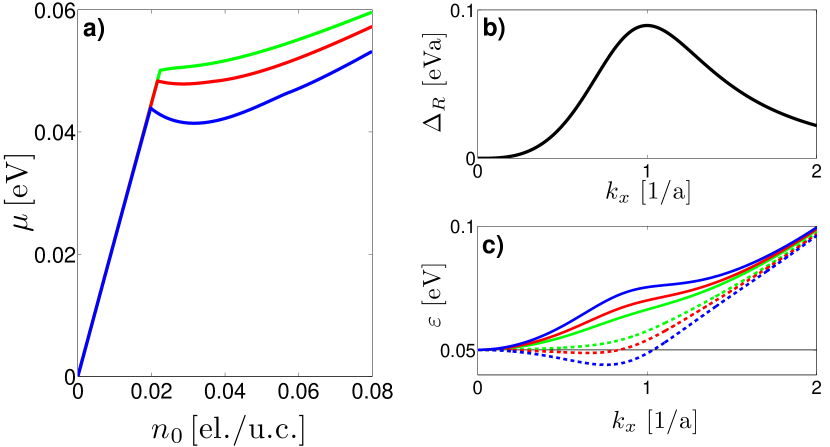
As mentioned, the density of the 2DEG can be additionally increased (decreased) by the application of a positive (negative) gate voltage on the sample. Typically, the voltage is applied by back-gating to the STO bulk alone, while the interface is kept at V. Applying a voltage V to a layer of thickness m yields an electric field V m-1, which is orders of magnitude smaller than the electric field due to the polarity catastrophe, [see Fig. 2 (a)].
In the low temperature region we are interested in, the dielectric constant of STO is a highly non-linear function of the electric field of the formespci2 ; Neville ; copie
| (1) |
where is the saturation value for very high field, and mV-1 are temperature-dependent parameters and is the amplitude of the electric field. Considering systems at zero or low temperature, where the values of and change slowly, we take to be temperature independent. The integration of the capacitance per unit surface from zero voltage to yields the charge density , where is the particle density plotted in Fig. 2 (b). In particular, the 2DEG can be greatly depleted tuning the density to , while the total electric field stays large. We will see that this implies the persistence of a strong RSOC also in the negative voltage region.
II.3 SrTiO3 Band Structure
The mobile electrons at the interface reside in the STO t2g conduction bands originating from the orbitals of Titanium. Experiments and theoretical calculations suggest that for the strictly 2D case the t2g bands are split into an isotropic band (with light mass ) separated by an energy from two anisotropic bands and (each with a light mass and a heavy mass ).salluzzo ; santander ; meevesana ; held ; nayak In addition, a finite extension of the gas perpendicular to the plane may give rise to multiple (and ) sub-bands. While the experiments performed at the STO/vacuum interface report masses of the order of and ( the bare electron mass), recent density functional theory (DFT) calculations report smaller masses of the order and . Experiments indicate a gap of the order of meV.salluzzo DFT calculations for LAO/STO report meV, with subbands which lay closer (at about meV) to the bottom of the heavier bands. In any case these values depend strongly on the details of the interface and smaller values are conceivable. Caviglia et al. obtain RSOC values of the order of eV m by fitting magnetoresistance measurements with Maekawa-Fukuyama and Dyakonov-Perel theory with a single band of mass . Zhong et al. find couplings of the same order in the limit .
In addition to the rather wide range of reported parameters, the precise form of the RSOC in the different bands remains an open issue. While in Ref. triscone, the RSOC at the LAO/STO interface was successfully fitted assuming a linear in dependence for all gate voltages, the authors of Ref. Kimura, found evidence of cubic Rashba spin-splitting in the 2DEG formed at the STO/vacuum interface. In Ref. nayak, the authors arrived at yet another conclusion, reporting that the induced spin-orbit coupling in the and bands is cubic in , whereas the spin-orbit interaction in the lower band (), has a linear momentum dependence. Ref. held, points out that the inconsistencies may be partially resolved by the fact that the two interfaces are different. More to the point, the authors show that a negative , as it may occur at the STO/vacuum interface, leads to a cubic-in- RSOC. However, the similarity of the 2DEG at the STO surface to those reported in STO-based heterostructures suggests that different forms of electron confinement at the surface of STO should lead to essentially the same 2DEGsantander .
In the present paper, we shall mainly consider a model with linear RSOC and an expedient band structure composed of one anisotropic band with mass separated by meV from two anisotropic bands with masses and , allowing for a simpler analytical treatment. For completeness, in Appendix A we also report results obtained for different values of the parameters and RSOC. In addition, in Appendix B, we show that the main conclusions of our work remain valid for more complex band structures arising from orbital mixing, for which an analytical determination of the bands in not possible. Indeed, the DFT calculations mentioned above elucidate how the Rashba splitting arises from the combined effects of atomic spin-orbit coupling and the interfacial electric field, so that the corresponding tight-binding Hamiltonian is non-diagonal in the orbitals. However, to perform analytic calculations of various quantities, that are impossible for the complex tight-binding band structure derived from DFT calculations, we adopt in this work a simplified Hamiltonian of the form:
| (2) |
with the single-orbital Hamiltonian :
| (3) |
where and are the standard Pauli matrices ( is the unity matrix) and is the strength of the RSOC. The first band is isotropic, , whereas the second and third bands are anisotropic, , . The case of a -cubic RSOC is briefly discussed in Appendix C, where we show that also this modification of our model leads to very similar physical results.
Diagonalizing the Hamiltonian of Eq. (3) we obtain the following dispersion relations:
| isotropic band: | |||
| (4) | |||
| anisotropic bands: | |||
| (5) |
where , for the second (third) band of Eq. (2). Although an anisotropic RSOC could be considered for the anisotropic bands,CPG for simplicity, we assume here the same RSOC for all bands. Henceforth, the superscripts and label quantities defined for the isotropic and the anisotropic bands, respectively.
Due to the RSOC the quantum number associated to the spin degree of freedom is no longer the spin itself but the so-called chirality, which for a given band and wave vector characterizes the orientation of the eigenspinor which we label by and . The resulting Fermi surface is formed by two circles (ellipses for the anisotropic bands) and shown in Fig. 9. The peculiar spin structure will be important when we consider the effect of a magnetic field parallel to the interface.
The anisotropic bands have each two minima at on the axis corresponding to the heavy mass. The separated minima become a ring of radius in the isotropic band. A schematic view of the resulting band structure is given in Fig. 3.
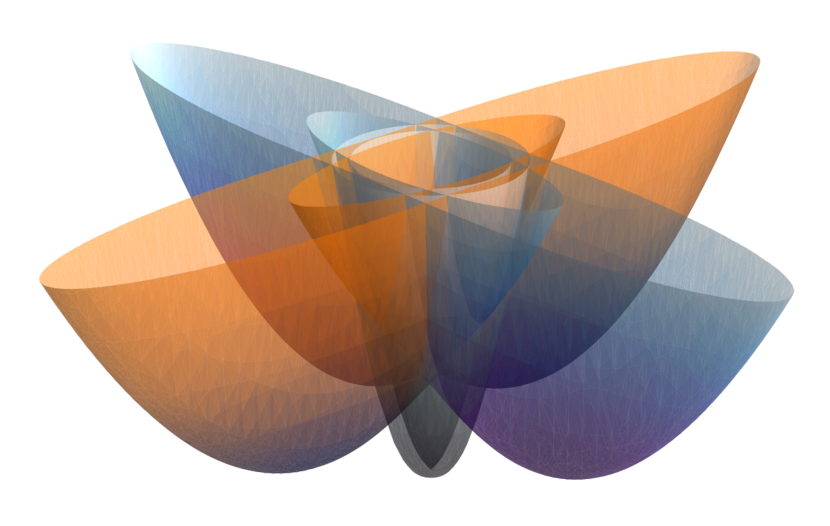
We will see in the following how, due to the density-dependent Rashba coupling, the band structure, and in particular its (local) minima are functions of the electron density.
II.4 Field-dependent Rashba Coupling
Concerning the dependence of the Rashba coupling on the electric field, in the absence of compelling first-principle calculations, we borrow its functional form from semiconductor physics, while the appearing parameters are inferred from LXO/STO experiments. More precisely, we takelibroSO ; schapers
| (6) |
where is the electron wave function (for simplicity we here display only its dependence) and , is the subband energy relative to the bulk conduction band, is the band-bending potential, is the band gap, and is a measure of the spin-orbit splitting within a Kane approach.kane Expanding for small values of , taking the electric field uniform along ,notapotential and replacing in the denominator by after the differentiation, ( being the width of the confining potential well), Eq. (6) can be written in the simple form
| (7) |
which in terms of the polarity catastrophe electron density becomes
| (8) |
The expression (7) has the standard linear behavior at small electric field, but saturates at and then decreases at larger fields. This latter behavior is important to stabilize the system against an unphysical unbounded growth of the RSOC. We define the parameters and on purely phenomenological grounds. Experimental observationscavigliaPRL ; fete ; espciprivcom report Rashba couplings of order eV m, based on which we take eV m. Assuming that this maximum value is attained for densities el/u.c. (for typical experimentsl values of the densities at the interface, see, e.g., Ref. espci2, ), we get eV mV-1 and m V-1. Note that this value of corresponds to a maximum field at the interface of V m-1, comparable to the values estimated in Ref. espci2, .
A comment is now in order about the choice of the field-dependent RSOC in Eq. (7). Since LXO and STO are different materials, inversion symmetry at the interface is broken even in the absence of polarity catastrophe reconstruction (i.e., for ). This means that a residual electric field besides should always be present, leading to a finite RSOC, , even for vanishing . This additional field, no matter how small, has been shown in Ref. CPG, to always produce phase separation at low enough densities ( el./u.c.) for the linear–in-k RSOC considered there. However, we are interested in the typical regime of real materials with densities el./u.c. Therefore, in order to keep the smallest number of model parameters, we omit this term, which, in any case, favors the occurrence of phase separation and therefore would strengthen our conclusions.
As will become clearer below, the possibility of a phase separation depends only marginally on the precise density dependence of the RSOC. The crucial point is that when the Fermi energy enters the heavy bands, the coupling and/or its derivative with respect to need to exceed a certain value in order for the instability to occur.
II.5 Chemical Potential
From the band structure we deduce the density of states (DOS):
where the subscript reminds us that, like the band structure, also the DOS depends on the density. These density dependencies add some subtleties to the calculation of the chemical potential which we will discuss in the following.
We begin by considering the simple example of a constant DOS and a density-dependent band bottom , in which case the Fermi level reads
| (9) |
and the total energy per unit cell is given by
Differentiating once (twice) with respect to the density we obtain the chemical potential (inverse compressibility)
The inverse compressibility, instead of being equal to as in the standard case of a constant band structure, has two additional contributions coming from the density dependence of the energy. Therefore, we find that already in the simplified case of a constant DOS, the density dependence of introduces new terms to the chemical potential and its derivative.
Next, we address the implications of the density dependence of the DOS. To calculate the thermodynamic properties of the system we consider the grand-canonical ensemble defined by the potential , where is the free energy and the total particle number of the system. In this ensemble the chemical potential is fixed while the particle density is a fluctuating quantity ( is the number of lattice sites). To be precise, the fluctuating quantity here is , while is univocally fixed by the gating , which is an external parameter. Therefore, when we calculate the chemical potential via the density-dependent grand-canonical potential, the density [and therefore also ] is not known a priori. An elegant way to circumvent this problem is the introduction of a Lagrange multiplier ; we take the energy to be dependent on a real parameter , determine the chemical potential , and then chose to impose . So, we consider the following grand-canonical Hamiltonian:
where and are the usual electron destruction and creation operators, is the canonical one-particle Rashba Hamiltonian of Eq. (3) and . The grand-canonical potential density reads
(for simplicity we here take the Boltzmann constant ) where are the eigenvalues of given in Eqs. (4) and (5). The electron density is given by
| (10) |
where is the Fermi-Dirac function at a temperature . The equations for and read:
| (11) |
Notice that depends on both the absolute value of [via the difference ] and its derivative with respect to (i.e., ). It is also worth noticing that the pseudo-chemical potential , and not the chemical potential , coincides with the Fermi energy at .
Eventually, we want to know whether for a given experimentally observed value of , say , fixed by the chemistry of the sample, the EG is stable or not. This amounts to determine whether the chemical potential is an increasing or a decreasing function of in the vicinity of . To accomplish this, we vary over the interval el./u.c. for and el./u.c. for , keeping the gating fixed, and calculate for each density the chemical potential
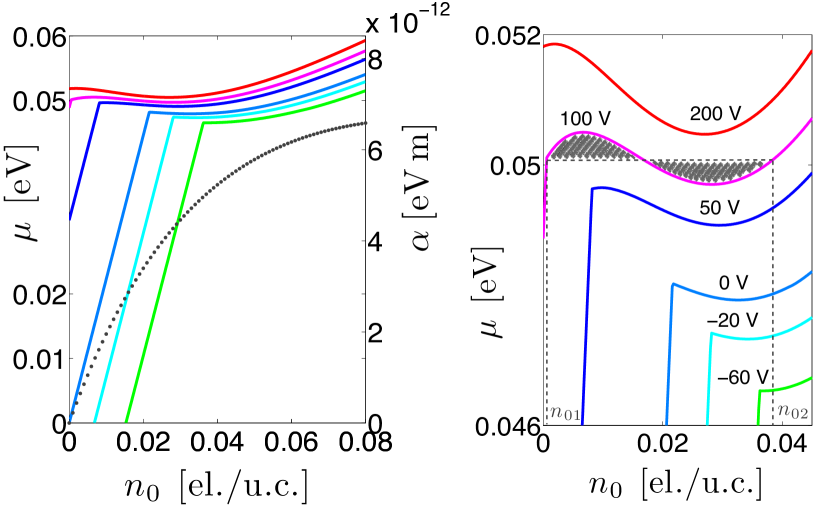
which yields curves of the form shown in Fig. 4. The respective densities and of the coexisting phases are then determined by the Maxwell construction
where , and satisfy the relations . In case falls into the interval , the system is unstable and separates into two phases with density and , respectively. An example of the Maxwell construction is given in the right panel of Fig. 4 for V, where and . The contribution of the Lagrange multiplier to the chemical potential and to the compressibility, which was neglected in Ref. CPG, , enhances the tendency to electronic phase separation.
III The phase separation at ,
We commence the study of the phase separation instability with the calculation of the chemical potential at zero temperature and zero magnetic field and analyze how it evolves upon varying the gate voltage . As mentioned above, the electric field due to the charge reconstruction is much larger than the one arising from gating and we omit this latter contribution to . Consequently, the only effect of increasing (decreasing) is to increase (decrease) the density by with respect to , leaving the value of essentially unchanged. Furthermore, we remind that temperature, magnetic field and gate potential are (the) external parameter determining the thermodynamic state of the system, while the density (and its fluctuations) are determined by its internal stability.
We anticipate here that for the (physically realistic) values of the RSOC considered in this paper, no instability occurs as long as only the lower-lying low-DOS band is filled. On the contrary, a phase separation instability is possible at higher electron density, when the heavier bands start to be filled. A precondition for this possibility is that the RSOC and its derivative with respect to are large enough (see below). Quite remarkably, we find that the values of at which the instability occurs are well in the range of those inferred from magnetotransport experiments in LAO/STOcavigliaPRL ; fete and LTO/STO.espciprivcom Before considering the occurrence of the instability in a more detailed and quantitative way, we address the numerical solutions of shown in Fig. 4 and explain them on a qualitative basis.
First of all, one has to bear in mind that, although in the real systems is determined by the chemistry of the system, for a given one has to explore a whole interval of to establish whether the system stays homogenous at this or whether it is energetically convenient to split into separate phases with different electronic reconstructions ( and ). Let us start with a system having, say, at . Only the band is filled and the chemical potential has a positive slope as a function of the electron density. Upon increasing V other electrons are introduced and the anisotropic bands start to be filled, while and are large enough to render the system unstable [negative slope of ]. The system therefore becomes inhomogeneous and splits into regions at densities to be determined by the Maxwell construction [see the enlarged view in the right panel of Fig. 4, where the construction is explicitly done for V]. If the chemistry were such that in the as-grown system, the heavy bands would be filled, but would vary too mildly with and therefore the bands would be too rigid to allow for the instability to occur. On the other hand, if the chemistry were such that no electrons were transferred at the interface of the as-grown system (), then the gated electrons only would fill the bands and one should apply a gate voltage V before is large enough to fill the heavy bands. At this point, upon increasing , the system becomes unstable and regions with different electronic reconstructions, and , are formed.
Once this rapid survey of the unstable reconstruction has been given, we now move to a more analytic understanding of the above phenomenology at zero temperature and zero magnetic field.
The chemical potential for a constant isotropic band of mass is
| (12) |
where corresponds to the constant DOS of a 2DEG. The correction term due to the density dependence of the Rashba coupling reads
| (13) |
where
For the chosen values of the parameters and , the condition is never satisfied,2E0g0 and the terms which depend on and [via ] are small compared to . Therefore, the major effect of gating is to translate the (quasi) linear curves by as it is shown in Fig. 4. In terms of the total density a rigid shift by translates into coinciding . We note that here we can write , because it does not matter whether the electrons come from the polarity catastrophe or gating.
What happens when the anisotropic bands start to be filled? In general, one expects effects due to the RSOC to increase. Indeed, inspecting Fig. 4 one observes a strong flattening of the chemical potential when . In order to pinpoint the density at which the anisotropic bands begin to be filled, we solve the equation
| (14) |
where . The solutions and are reported in the left plot of Fig. 5 and correspond, as expected, to the densities at which the chemical potential shown in Fig. 4 changes abruptly.
For V we find , meaning that fills up the isotropic band to the bottom of the anisotropic bands.
In general, the equations for do not allow for a simple solution due to the absence of rotational symmetry. If, however, we are only interested in the region , we can expand around its four minima and . Due to invariance of the Hamiltonian under a rotation of , it is sufficient to consider one minimum only (and multiply by at the end). Taking, for example, , we obtain
where .
Based on this quadratic dispersion relation we derive the following quantities, valid for :
In addition, we calculate the chemical potential for densities ,
from which we deduce the value of the inverse compressibility,
| (15) |
where . Evaluating Eq. (15) at we obtain the (inverse) compressibility when the anisotropic bands start to be filled, which is shown in the right plot of Fig. 5. We find that at large negative voltage V, , i.e., the EG is stable. Increasing the voltage we arrive at a critical value V where changes sign, which means that the EG becomes locally unstable. Increasing further the gate voltage, it becomes stable again at , and the phase separation occurs at higher density (see also Fig. 4). For comparison, we plot the derivative at at the top of the isotropic band. One observes that the derivative is close to which corresponds to its value for a constant band. This confirms that the contribution from and are indeed small in the isotropic band.
To summarize the above findings we plot in Fig. 6 the density dependence of (red curve) and (green curve) for V, V and V (from left to right).
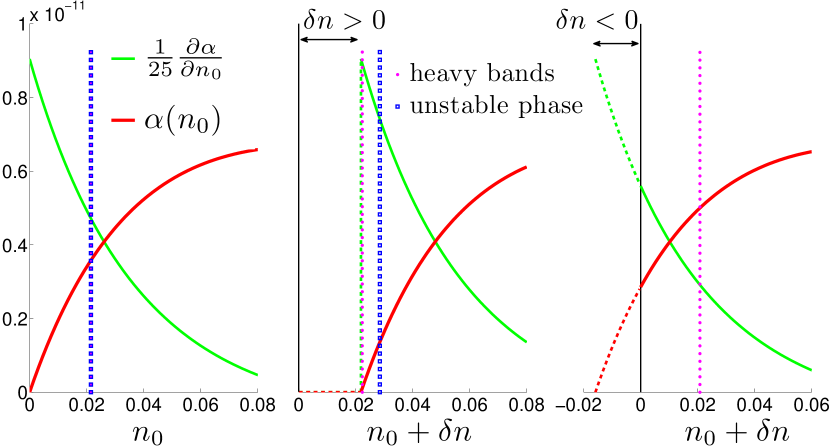
We also include (dots) and the density at which the chemical potential attains its local maximum (square markers). At zero gating, the blue and purple lines coincide, i.e., the EG becomes unstable as soon as the anisotropic bands start to be filled. Lowering the gating down to V the phase separation vanishes. Fig. 6 reveals that V and V thereby illustrating the importance of a sizable derivative of the Rashba coupling with respect to density (i.e., a sufficiently non-rigid band) in order to drive the system unstable. Increasing the gating up to V the EG remains stable upon initially filling the anisotropic bands and it is only after further augmenting the density that the instability occurs. The explication is identical to the previously discussed case, with the roles of and interchanged. According to Fig. 6, V and V with V yet to small to cause the instability so that the density has to be augmented by going to larger ’s (or the chemistry should have been different, providing a larger ) to attain a negative compressibility.
IV Finite temperature effects
The equations relating the particle density to the chemical potential and to the Lagrange multiplier at finite temperature maintain the same form as at ; only the Fermi-Dirac distribution ceases to be step-like and acquires a temperature dependence. This dependence leads to a mixing of states with an energy when calculating the integrals in Eqs. (10) and (11). As a consequence, the transition from the isotropic to the anisotropic bands smoothens.
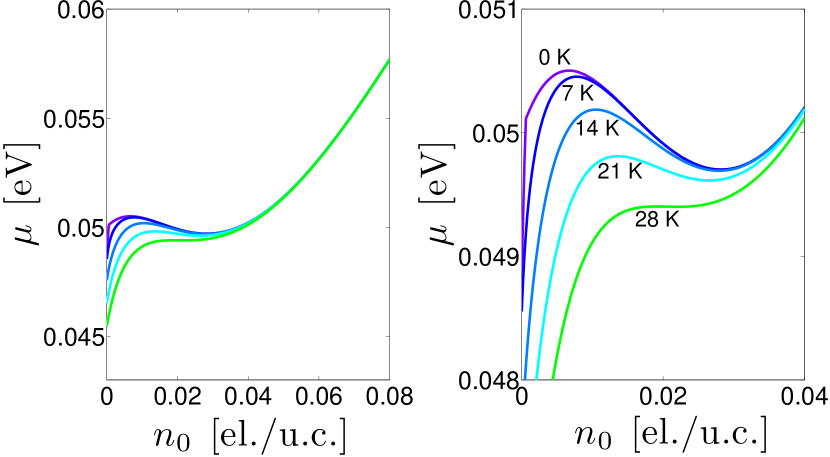
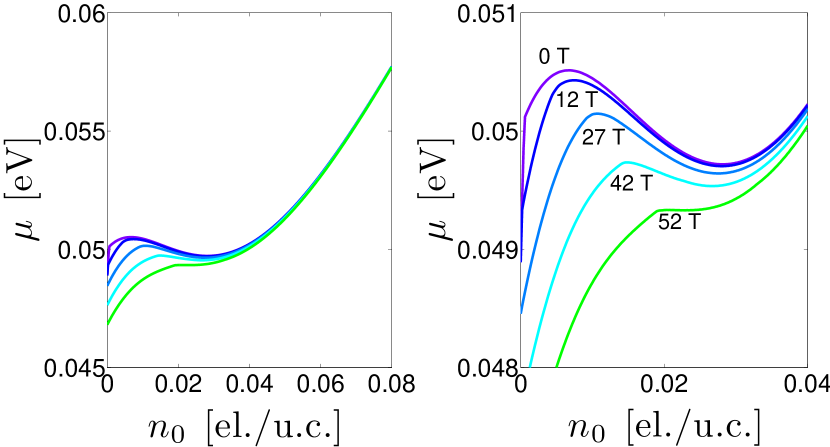
More importantly, the phase separation, if present at K, vanishes at a temperature of the order of equal to the difference between the two spinodal points divided by the Boltzmann constant. This means that the energy associated to the thermal excitations is comparable to the energy the EG gained when it phase separated. In Fig. 7 we report the thermal evolution of for V and find meV and meV.
In Fig. 8 we report the evolution of the phase separated densities and in temperature for V. The obtained phase diagram has a dome-like shape separating the stable from the unstable phase. The black shaded area corresponds to the physically inaccessible region and the markers to at fixed, which represents the behavior of the density in gating and temperature for an actual sample (where is fixed by its specific chemistry). We find that for realistic values of el/u.c., the EG is unstable in a large range of gating and (at K) exits the phase separation dome near the quantum critical point at V.bianconi
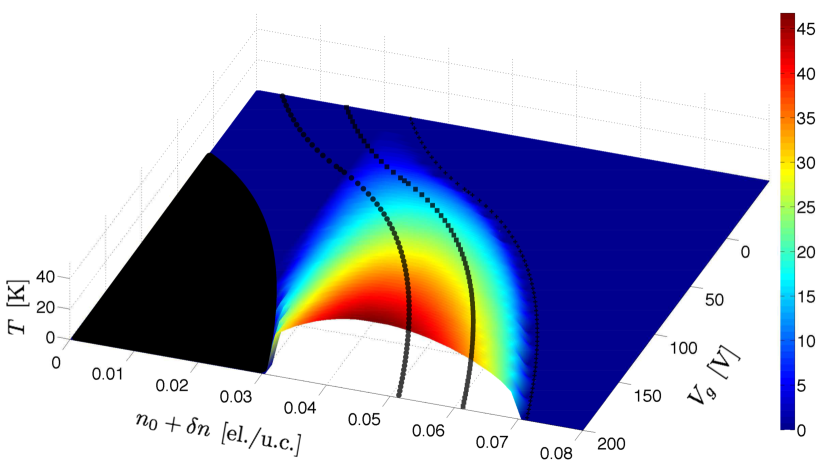
This is an interesting occurrence because it implies that near this gating value the system is characterized by strong nearly-critical quantum (i.e., intrinsically dynamical) fluctuations of its reconstructed structure. This entails strong density fluctuations which at zero temperature display critical dynamical behaviors with large dynamical critical exponents (for clean nearly ballistic electrons) or (for diffusive electrons). Of course, these critical behaviors rest on the assumption that these large scale density fluctuations are neutral at long distance because they are charge compensated by other mechanisms (like, e.g., variations of the Ti, Al valency), which should still be able to follow the slow critical electronic dynamics. The possible consequences of slow nearly critical density fluctuations on the superconducting critical behavior of these oxide interfaces at low gating/densities are presently under investigation.
V Effects of a finite magnetic field parallel to the interface,
In this section we analyze the effects of a magnetic field on the electronic phase separation at zero temperature. We limit our considerations to the simpler case of an in-plane magnetic field, where the magnetic field is parallel to the interface and couples to the electron spin only, leaving the orbital part unaltered. The dispersion relations read:
| (16) | ||||
| (17) |
where is the Bohr magneton, is the strength of the magnetic field, and denotes the angle between and . As the equations suggest, the presence of a magnetic field leads to a rich band structure. Indeed, the evolution of the band structure differs from the previous case where the minima were fixed at . Here, the positions and the number of minima depend on the values of , , , and . We will not go into details of the band structure, but focus instead on the general features important to understand the effects of the magnetic field.
The Fermi surface and the band structure along of the isotropic band in the absence of a magnetic field are displayed in Fig. 9 (panels and ). From the spin structure of the Fermi surface it is readily seen that one has a competition between the chiral structure of the RSOC and the magnetic field which tends to polarize the spins along its direction. As a result the application of a magnetic field causes a band shift for states perpendicular to (panel ) and a Zeeman splitting for states parallel to the field (panel ).
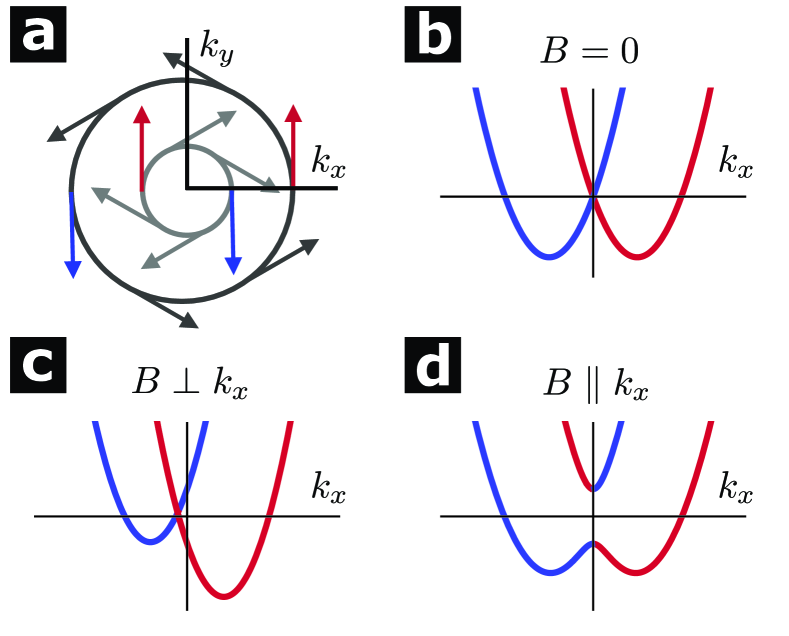
According to Eqs. (16) and (17), the phase separation, if it occurs for , vanishes for magnetic fields of the order . Physically, this means that the magnetic field polarizes the spins so strongly, that the effect of the RSOC, which is central for the phase separation, is suppressed. As an example, the evolution of the chemical potential with increasing magnetic field at gating V is given in Fig. 10, where meV and meV.
In Fig. 11 we report the evolution of the phase separated densities and in magnetic field for V. Similar to the evolution in temperature, we obtain a phase diagram with a dome-like shape separating the stable from the unstable phase. Being at zero temperature, the locus of the critical fields at which phase separation disappears, as a function of the gate voltage , defines a line of quantum critical points. The black shaded area corresponds to the physically inaccessible region .
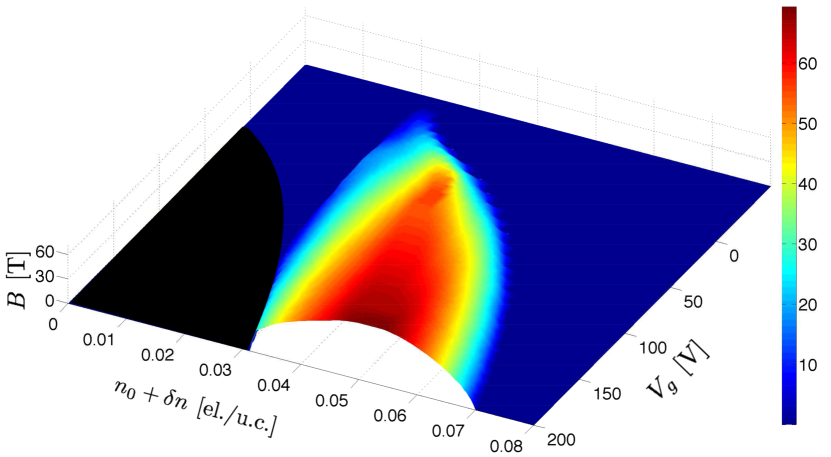
Again we find regions in the phase diagram where strong density fluctuations are expected. Also in this case, slow critical quantum fluctuations with or are expected provided the long-range Coulomb interactions are ineffective and do not spoil the whole phase separation structure.
VI Effects of Coulombic interactions
The phase separation analyzed above involves the segregation of charged carriers, entailing an energetic cost due to Coulombic interactions. In a first step one can assume that, while electrons acquire a negative compressibility and tend to segregate, the background of positive countercharges stays infinitely rigid. This causes a local charge imbalance which eventually stops the charge segregation at finite length scales as soon as the electrostatic cost overcomes the energy gain due to phase separation. This so-called frustrated phase separation was extensively investigated in the context of cuprates as a possible mechanism of charge inhomogeneous (stripe) states.emerykivelson ; FPS The issue then becomes whether the inhomogeneous state occurs on large scales comparable to the experimentally observed nano/mesoscopic disorder (for instance in Ref. doublecrit, a typical size of inhomogeneous regions of order 50-100 nm was estimated) or on shorter scales. In the latter case, it might even happen that the scales are so short that inhomogeneities simply do not occur and phase separation is spoiled. To complement our analysis of the phase separation mechanism, we therefore estimate, as a function of size, the electrostatic cost of a disk with excess electron charge embedded in the STO matrix, but close to the LXO/STO interface. A positively charged ring of excess charge , arising from a depletion of the electron density, is also considered, giving rise to a “disk+ring” with an average charge density equal to its surrounding. [see Fig. 12(a)]. For the sake of concreteness, we take for the excess electron density the form , where corresponds to the disk and corresponds to the ring.
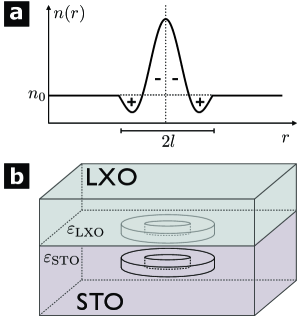
The electrostatic potential generated by this charge distribution is calculated using the standard image-charge method considering the limiting case [the dielectric constant of STO is strongly field-dependent, see Eq. (1), but always at least one order of magnitude larger than the dielectric constant of the nearby LXO]. The charges in STO are taken at a typical distance nm from the interface (this distance turns out to be much smaller than the disk+ring diameter ). The cost of this inhomogeneous charge distribution is then compared to the energy gain from phase separation, as determined from our vs. curves obtained above. We find , where is the linear size of the STO unit cell. Taking for the geometric average of the minimal () and maximal () value, we obtain nm. This means that even in the worst case of an infinitely rigid background, sizable nanoscopic inhomogeneities are produced by phase separation despite the Coulombic cost of charge segregation.
The worst-case situation sets a lower bound to the size of inhomogeneities. Assuming, as it seems to be more realistic, that the charge distribution in the LXO/STO heterostructure is not rigid, the possibility arises that an inhomogeneous distribution of electrons at the interface is (at least partially) balanced by a corresponding redistribution of opposite countercharges at the top of (and possibly inside) the LXO film, leading to an increase of the size of the inhomogeneous regions. We stress that these adjustments are not necessarily due to any displacement of ionic positions, but may simply arise from small variations of the XAl,Ti ion valency [see Fig. 13].
Given the smallness of , we can assume that the energetic cost of this even smaller modulation of the valency of X is not exceedingly large. Then, the thickness of the LXO film being small, the negative charges at the interface and the positive countercharges at the top of the LXO film can be considered as a neutral system over distances larger than the thickness of the LXO layer.
Of course one should worry about the fact that inside the LXO layer the inhomogeneous distribution of charges produces an inhomogeneous electric field distribution like in joined capacitors with different surface charges on their plates (see Fig. 13). This will generate an increase of electrostatic energy with respect to the homogeneous case, likely overcoming the phase separation gain. However, one should bear in mind that i) the charge reconstruction precisely occurs to avoid the presence of an average electric field in the interstitial polar planes of LXO and ii) this reconstruction is only partial because the interface charge, even taking into account possible trapping of charge carriers, never coincides with the nominally required el./u.c. (the density of charge carriers is roughly ten times smaller). The real amount of charges transferred from the LXO top layer (or bulk) to the interface region is unknown. Most of these charges are either trapped at STO impurity states or simply they are not transferred because 0.5 is the nominal limit value expected when a (macroscopically) thick stack of LXO planes is deposited on the STO substrate, while for smaller thickness (1-10 layers) the systems finds a compromise between having a smaller but finite average electric field in LXO and the energy cost involved in transferring charge to the interface. In this complex situation it is really awkward to estimate, e.g., the different energy cost for transferring to the interface, say, 0.4 el/u.c. uniformly or creating inhomogeneous regions with 0.38 and 0.42 el/u.c. This estimate would involve: a) DFT calculations keeping track of the rigidity of small valence fluctuations of Ti ions; b) the screening associated with tiny lattice deformations of the LXO planes; c) the possibility for a slightly non uniform redistribution of the charge in the intermediate ionic planes: the nominal polarity catastrophe distribution (0.5) (1) (+1) … (1) (+1) (0.5) could well become, say, (0.6) (0.9) (+0.8) … (0.9) (+0.8) (0.4). Moreover, all these effects related to the polarity catastrophe could well coexist and cooperate with a not fully uniform distribution of the oxygen vacancies. An analysis of all these issues is far beyond the scope of our paper and an analysis by means, e.g., of DFT calculations, would be made difficult by the smallness of the charge imbalances and of the related energies involved (a few meV) so that a first-principle analysis would be very delicate.
It is however conceivable that small redistributions of the charge in the top layer and in the internal polar planes of LXO balance the excess (or lack) of electrons in the 2DEG without creating substantial changes in the electric field inside the LXO. In this respect, we point out that the worst-case scenario of a rigid background already gives rise to large enough inhomogeneities to justify our analysis of phase separation. Additional mechanisms related to the charge flexibility of these systems can only extend the effects of phase separation in generating the experimentally observed inhomogeneous interface state.
VII Conclusions
Based on a simple and general model we demonstrated that, as soon as the Rashba coupling depends on the density, the possibility for an intrinsic electronic phase separation arises. In this framework, we showed that the instability occurs for reasonable values of the Rashba coupling and the band structure parameters. We then systematically analyzed how the phase separation instability changes upon varying the gating , the temperature and the magnetic field (applied parallel to the interface). The dependence on the parameters defining the RSOC, and , and the band structure and the heavy-to-light mass ratio is discussed in Appendix A, whereas the case of more realistic band structures is dealt with in Appendix B. Also the case of a -cubic RSOC is addressed in Appendix C, where a coupling is considered leading to a band splitting of the same order of the one obtained in Ref. held, .
In all the above cases, a main finding of our work is the possible occurrence of the phase separation instability for quite realistic values of the RSOC as soon as the heavier (mostly with character) bands start to be filled. The filling of these bands, despite their location at higher energies eV, is a reasonable occurrence at the accessible electron densities both on experimentalsalluzzo and theoretical grounds.parkmillis ; sangiovanni ; held ; nayak Furthermore, the idea that qualitatively new physics then emerges when the heavier and bands start to be filled is also gaining consensus on the basis of both theoretical resultsfischer and experimental evidences.ilani ; joshua ; gabay ; banerjee Our scenario does not contradict these evidences, but suggests that these new physical effects may occur on an intrinsically inhomogeneous state.
In our opinion, a negative compressibility like the one measured in Ref. mannhart, cannot be explained by impurities, defects and so on, but is a distinct signature of an intrinsic mechanism leading to an effective charge segregating attraction like the one proposed here.notamannhart
In any case, the instability gives rise to dome-shaped coexistence surfaces in the parameter spaces below which the electronic reconstruction due to the polarity catastrophe and the related electron densities cannot occur homogeneously, but rather give rise to domains with different densities. The Maxwell construction only determines the densities of the coexisting phases, but says nothing on the size and structure of the phase separated regions. These non universal details are instead determined by the energy cost of the interfaces between regions with different densities, by the strain effects, and so on. The residual amount (if any) of Coulombic forces opposing phase separation, also contributes to non universal features like size and shape of the inhomogeneous regions.emerykivelson ; FPS
Another remarkable finding is related to the closing of the phase-separation domes upon varying the gating potential. This gives rise to quantum critical points of a novel type, where the Landau damped electron density fluctuates with a relatively large dynamical critical index ,CDG ; maccarone or . The fact that (nearly) neutral large-scale density fluctuations might occur in these systems is the key point allowing to escape the Coulombic frustration usually invoked to produce critical fluctuations.efetov ; fisher ; vishwanath Of course, the possibility is also open that Coulombic forces frustrate the phase separation giving rise to charge-density waves (or even anharmonic stripes) similar to what has been proposed in high cuprates,emerykivelson ; FPS ; CDG ; sulpizi ; DBC ; seibold2000 ; mazza likely yielding a dynamical critical index .CDG
Recent experimentsdoublecrit do reveal the presence of quantum critical behavior under magnetic field in the low voltage region, suggesting non trivial interplay between the superconducting fluctuations and the nanoscale inhomogeneities. Work is in progress to investigate the possible connection between these observed quantum critical behaviors and the quantum critical points found in the present work.
The generality of our model is based on the idea that RSOC arises at interfaces where a metallic 2DEG forms with a density which self-consistently adjusts itself on the basis of a local confining electric field. If one allows the RSOC to depend on this density via the orthogonal electric field, the issue of a charge instability naturally arises. Of course, the details of the system then enter to establish whether or not the frustration due to long-range Coulombic forces is present or not. It is anyhow tempting to investigate whether our instability mechanism is applicable to other systems as well. For instance, one could consider an EG with a sizable RSOC and/or very low densities in quantum wells, at the boundaries of heavy metal alloys like BixPb1-x, on the reconstructed surfaces of Ag(111), in MOSFET and semiconducting heterostructures at low densities, and on the surface of topological insulators.
Previous work in strongly correlated systemsCDG ; GC ; GRCDK ; BTDG ; BKCDG ; CCCDGR ; CDG1 shows that electron-electron correlations and electron-phonon coupling favor phase separation. Therefore, while it is natural that weak repulsive electron-electron interactions turn out to weakly stabilize the phase-separation instability,finocchiaro strong correlations induce an intrinsic non-rigidity to the quasiparticle bands and may cooperate with the RSOC to produce a charge instability.
On more general grounds, the present analysis paves the way for further models apt to describe the inhomogeneities at the LXO/STO interface. From experiments and theory we know that the superconducting state is inhomogeneous.BCCG ; caprara As a possible variation/improvement of our approach, one could then think of a model with superconductivity in which the coupling constant between Cooper pairs (or even superconducting islands) depends on the density. Based on the current work, one expects that also in this case the effective attraction leads to an unstable EG. Of course, one would need to check whether the orders of magnitude of the involved physical quantities are such to cause a measurable instability or not.
Acknowledgments. We acknowledge insightful discussions with L. Benfatto, N. Bergeal, C. Castellani, C. Di Castro, J. Lesueur, and R. Raimondi. G.S. acknowledges support from the Deutsche Forschungsgemeinschaft. M.G. and S.C. acknowledge financial support from University Research Project of the University of Rome Sapienza, No. C26A125JMB.
Appendix A How the instability depends on the parameters of the RSOC and of the bands
We have shown the rather delicate dependence of the phase instability on the values of and . This suggests a strong dependence on the parameters and as well. To investigate in more detail this dependence, we solve Eq. (15) for a range of values of and and determine the minimum gate voltage at which the instability occurs. The possible case of a phase separation only in the isotropic band is taken into account by calculating for from Eqs. (12) and (13) versus the density. In this way we get an understanding about how much the quantum critical point changes upon varying the parameters of the model. In Fig. 14 we plot as a function of and which denotes the density at which attains its maximal value. The values chosen correspond to a cut-off field V m-1 and a maximal Rashba coupling eV m. The possible interval of the quantum critical point is chosen as V. The dark red region (upper left corner) corresponds to a (possible) quantum critical point above V where our quadratic approximation of the anisotropic band structure does not hold anymore, while the dark blue region (upper right corner) corresponds to values of and such that V.
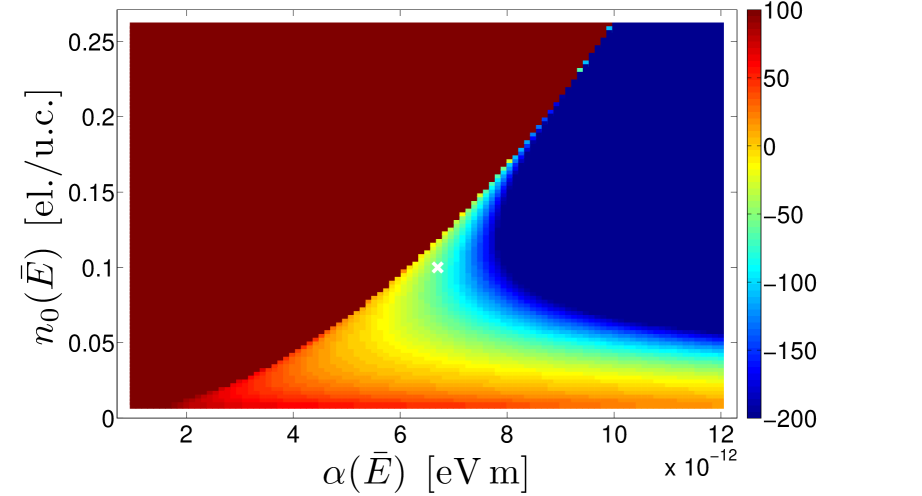
For small densities el./u.c. the function attains its maximum in the isotropic band (unless we partially fill the band by gating) and the occurrence of a phase separation either requires a large to drive the instability in the isotropic band already, or additional electrons to reach when has already entered the anisotropic bands. In the former case, which occurs for eV m and el./u.c., we obtain V, whereas in the latter case the critical voltage is necessarily shifted towards positive gating. Increasing the voltage necessary to partially fill the band decreases, and thus as well. For large values of the minimal value V is reached at el./u.c. and stays low all the way up to el./u.c., where the critical value passes in an abrupt manner from V to V.
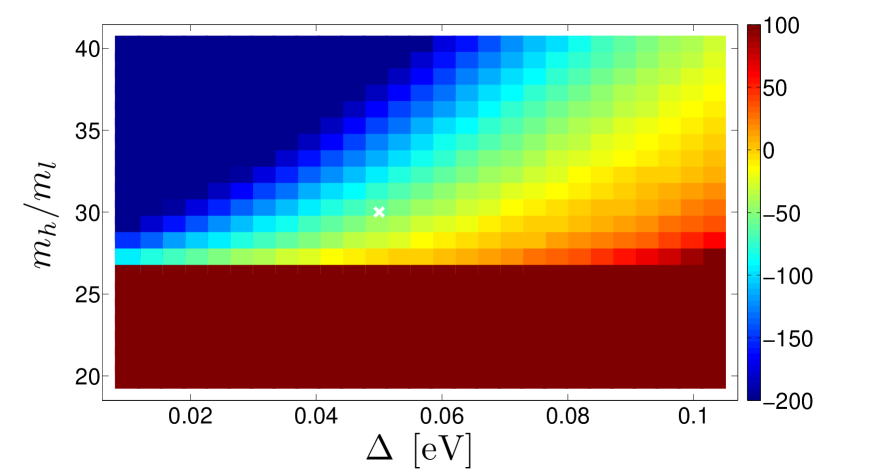
In addition to the parameters and defining the RSOC, the model contains the band structure parameters and , where . To gain insights about the dependence of on these two parameters, we solve Eq. (15) for eV and with and the same as initially ( m V-1 and eV m2 V-1).
The resulting phase diagram reported in Fig. 15 shows that for small values of the gap eV the instability arises at low gating because the chemical potential enters soon in the anisotropic bands. Then, increasing the gap leads to an increasing because one has to introduce more electrons in the system before the anisotropic bands start to be filled.
Concerning the masses, the ratio has to exceed for the the EG to become unstable in the physically meaningful range of gate voltages. This value corresponds to a large heavy mass of , especially when compared with the values reported from DFT calculations. Roughly speaking, if the mass is reduced by a factor of , the RSOC has to be increased by a factor of in order to get the same effect. More to the point, consider the Hamiltonian
| (18) | |||||
| (19) |
where Eq. (19) leads to the same energy spectrum as Eq. (18) (up to a factor ).
Appendix B More realistic band structures
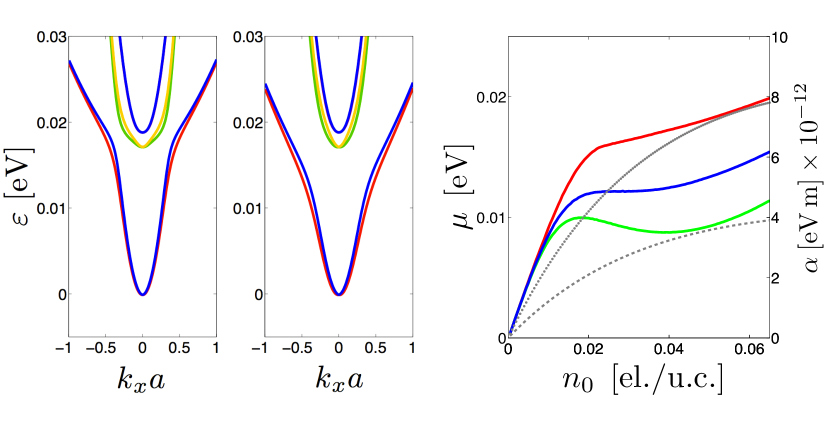
In the present appendix, we show that our conclusions concerning RSOC-driven electronic phase separation also hold for more realistic band structures, which we borrow from a tight-binding transcription of the results of DFT band calculations. Specifically, we numerically solved a tight-binding Hamiltonian in the form of a matrix in the space of the three orbitals of Ti and spin. describes the interface hopping and splitting in the basis, and is diagonal in spin space (i.e., its spinor structure is proportional to the identity matrix ),
where , , eV is the larger nearest neighbor hopping corresponding to the direction of lighter band mass, eV is the smaller nearest neighbor hopping corresponding to the direction of heavier mass, while eV is the planar next-nearest neighbor hopping. The spin-orbit Hamiltonian reads
where , is the atomic spin-orbit strength (see Ref. held, ), while is the inter-orbital hopping term due to the interface asymmetry, eventually producing the Rashba-like band splittings (see Refs. held, , nayak, , and khalsa, for details). The resulting band structures are reported in the left and middle panel of Fig. 16. For the parameters of we phenomenologically adjusted and , such as to yield a value eV m at el./u.c. The value eV is accordingly adjusted to produce a band structure similar to the one reported in Fig. 3 of Ref. nayak, . The chemical potential as a function of is the red curve reported in the right panel of Fig. 16. For this choice of the parameters, the system is still stable, although a substantial decrease of the inverse compressibility (the slope of the vs. curve) is found. Remarkably, by simply increasing by a factor two the strength of , we find a negative compressibility. We conclude that also for more complex (and realistic) band structures the instability occurs in a range of RSOC strengths which is fully compatible with the experimentally inferred values. This result is quite reasonable. Indeed, although the band structure of Fig. 16 looks quit different form the bands described by Eqs. (4) and (5), it results in fact from an admixture and spin-orbit splitting of the bands, which were split by the RSOC, but not mixed (by hybridization and/or spin-orbit coupling), within our simplified approach. For similar values of the physical parameters, the two band structures qualitatively share the same physics, with minor quantitative differences. On the other hand, the simplified band structure adopted in the main part of this piece of work has the advantage of allowing for more transparent analytical results, highlighting the physical mechanisms leading to RSOC-driven electronic phase separation.
Appendix C Cubic Rashba coupling
For the sake of completeness, in this Appendix we briefly consider the possibility that RSOC lacks -linear dependence and starts with a termnayak in the anisotropic bands. To implement this RSOC we phenomenologically start from the simplified expression of the band structure in Eqs.(2) and (3) and take a momentum dependent spin splitting of the form
| (20) |
to replace the -linear term ( is the lattice spacing). The denominator has been chosen to match the generic shape of the kubic spin splitting (see, e.g., Ref. khalsa, ; held, ). The strength of this RSOC is varied by multiplying by a factor , with the same density dependence as in the main part of the paper [see Eq. (8) and Fig.4] The resulting anisotropic band structure in the heavy-mass direction acquires a dispersion as reported in Fig.17.
As it can be seen in Fig. 17 (a), a phase separation instability takes place also in this case for values of eV m, such that the lowering of the lower part of the (heavy) bands is comparable to the analogous lowering in the case of -linear RSOC. Indeed the chemical potential starts to bend down with a negative slope as soon as the Fermi energy enters the bottom of the band provided this is located at finite momenta, where the momentum dependent RSOC has a finite value.
Notice that the chosen values of the parameters for the RSOC lead to a band splitting of the order of 25 meV, comparable with the values obtained in Ref. held, .
References
- (1) A. Ohtomo and H. Y. Hwang, Nature (London) 427, 423 (2004).
- (2) J. Mannhart, D. H. A. Blank, H. Y. Hwang, A. J. Millis, and J. M. Triscone, MRS Bulletin 33, 1027 (2008).
- (3) J. Mannhart and D. G. Schlom, Science 327, 1607 (2010).
- (4) H. Y. Hwang, Y. Iwasa, M. Kawasaki, B. Keimer, N. Nagaosa, and Y. Tokura, Nat. Mat. 11, 103 (2012).
- (5) N. Reyren, S. Thiel, A. D. Caviglia, L. Fitting Kourkoutis, G. Hammerl, C. Richter, C. W. Schneider, T. Kopp, A.-S. Retschi, D. Jaccard, M. Gabay, D. A. Muller, J.-M. Triscone, and J. Mannhart, Science 317, 1196 (2007).
- (6) A. Caviglia, S. Gariglio, N. Reyren, D. Jaccard, T. Schneider, M. Gabay, S. Thiel, G. Hammerl, J. Mannhart, and J.-M. Triscone, Nature (London) 456, 624 (2008).
- (7) J. Biscaras, N. Bergeal, A. Kushwaha, T. Wolf, A. Rastogi, R. C. Budhani, and J. Lesueur, Nat. Commun. 1, 89 (2010).
- (8) J. Biscaras, N. Bergeal, S. Hurand, C. Grossetête, A. Rastogi, R. C. Budhani, D. LeBoeuf, C. Proust, and J. Lesueur, Phys. Rev. Lett. 108, 247004 (2012)
- (9) S. Caprara, M. Grilli, L. Benfatto, and C. Castellani, Phys. Rev. B 84, 014514 (2011).
- (10) D. Bucheli, S. Caprara, C. Castellani, and M. Grilli, New J. Phys. 15, 023014 (2013).
- (11) S. Caprara, J. Biscaras, N. Bergeal, D. Bucheli, S. Hurand, C. Feuillet-Palma, A. Rastogi, R. C. Budhani, J. Lesueur, and M. Grilli, Phys. Rev. B 88, 020504(R) (2013).
- (12) Ariando, X. Wang, G. Baskaran, Z. Q. Liu, J. Huijben, J. B. Yi,A. Annadi, A. Roy Barman, A. Rusydi, S. Dhar, Y. P. Feng, J. Ding, H. Hilgenkamp, and T. Venkatesan, Nat. Commun. 2, 188 (2011).
- (13) Lu Li, C. Richter, J. Mannhart, and R. C. Ashoori, Nat. Phys. 7, 762 (2011).
- (14) J. A. Bert, B. Kalisky, C. Bell, M. Kim, Y. Hikita, H. Y. Hwang, and K. A. Moler, Nat. Phys. 7, 767 (2011).
- (15) D. A. Dikin, M. Mehta, C. W. Bark, C. M. Folkman, C. B. Eom, and V. Chandrasekhar, Phys. Rev. Lett. 107, 056802 (2011).
- (16) M. M. Mehta, D. A. Dikin, C. W. Bark, S. Ryu, C. M. Folkman, C. B. Eom, and V. Chandrasekhar, Nat. Commun. 3, 955 (2012).
- (17) J. A. Bert, K. C. Nowack, B. Kalisky, H. Noad, J. R. Kirtley, C. Bell, H.i K. Sato, M. Hosoda, Y. Hikita, H. Y. Hwang, and K. A. Moler, Phys. Rev. B 86, 060503(R) (2012).
- (18) Z. Ristic, R. Di Capua, G. M. De Luca, F. Chiarella, G. Ghiringhelli, J. C. Cezar, N. B. Brookes, C. Richter, J. Mannhart, and M. Salluzzo, Europhys. Lett. 93, 17004 (2011) .
- (19) F. Bi, M. Huang, C. Wung Bark, S. Ryu, S. Lee, C.-B. Eom, P. Irvin, and J. Levy, arXiv:1302:0204.
- (20) N. C. Bristowe, T. Fix, M. G. Blamire, P. B. Littlewood, and E. Artacho, Phys. Rev. Lett. 108, 166802 (2012).
- (21) Lu Li, C. Richter, S. Paetel, T. Kopp, J. Mannhart, and R. C. Ashoori, Science 332, 825 (2011)
- (22) See, e.g., J. P. Eisenstein, L. N. Pfeiffer, and K. W. West, Phys. Rev. B 50, 1760 (1994), and references therein.
- (23) N. Scopigno, D. Bucheli, S. Caprara, and M. Grilli, unpublished.
- (24) S. Caprara, F. Peronaci, and M. Grilli, Phys. Rev. Lett. 109, 196401 (2012).
- (25) Y. A. Bychkov and E. I. Rashba, J. Phys. C 17, 6039 (1984).
- (26) N. Nakagawa, H. Y. Hwang, and D. A. Muller, Nat. Mat. 5, 204 (2006).
- (27) Z. S. Popović, S. Satpathy, and R. M. Martin, Phys. Rev. Lett. 101, 256801 (2008).
- (28) S. Okamoto, A. J. Millis, and N. A. Spaldin, Phys. Rev. Lett. 97, 056802 (2006).
- (29) N. C. Bristowe, E. Artacho, and P. B. Littlewood, Phys. Rev. B 80, 045425 (2009).
- (30) R. Pentcheva, M. Huijben, K. Otte, W. E. Pickett, J. E. Kleibeuker, J. Huijben, H. Boschker, D. Kockmann, W. Siemons, G. Koster, H. J. W. Zandvliet, G. Rijnders, D. H. A. Blank, H. Hilgenkamp, and A. Brinkman, Phys. Rev. Lett. 104, 166804 (2010).
- (31) While the authors of Ref. polarity, proposed a full electronic reconstruction with a large transfer of electrons at the interface of about 0.5 electron per cell, both experiments and more realistic calculations find much lower densities. See, e.g., M. Hirayama and M. Imada, J. Phys. Soc. Jpn. 79, 034704 (2010).
- (32) S. Y. Park and A. J. Millis, Phys. Rev. B 87, 205145 (2013).
- (33) M. C. Neville, C. A. Mead, and B. Hoeneise, J. Appl. Phys 43, 2124 (1972).
- (34) O. Copie, V. Garcia, C. Bödefeld, C. Carrétéro, M. Bibes, G. Herranz, E. Jacquet, J.-L. Maurice, B. Vinter, S. Fusil, K. Bouzehouane, H. Jaffrès, and A. Barthélémy, Phys. Rev. Lett. 102, 216804 (2009).
- (35) M. Salluzzo, J. C. Cezar, N. B. Brookes, V. Bisogni, G. M. De Luca, C. Richter, S. Thiel, J. Mannhart, M. Huijben, A. Brinkman, G. Rijnders, and G. Ghiringhelli, Phys. Rev. Lett. 102, 166804 (2009).
- (36) A. F. Santander-Syro, O. Copie, T. Kondo, F. Fortuna, S. Pailhès, R. Weht, X. G. Qiu, F. Bertran, A. Nicolaou, A. Taleb-Ibrahimi, P. Le Fèvre, G. Herranz, M. Bibes, N. Reyren, Y. Apertet, P. Lecoeur, A. Barthélémy, and M. J. Rozenberg, Nature (London) 469, 189 (2011).
- (37) W. Meevasana, P. D. C. King, R. H. He, S-K. Mo, M. Hashimoto, A. Tamai, P. Songsiriritthigul, F. Baumberger, and Z-X. Shen, Nat. Mat. 10, 114 (2011).
- (38) Z. Zhong, A. Tóth, and K. Held, Phys. Rev. B 87, 161102(R) (2013).
- (39) Y. Kim, R. M. Lutchyn, and C. Nayak, Phys. Rev. B 87, 245121 (2013).
- (40) H. Nakamura, T. Koga, and T. Kimura, Phys. Rev. Lett. 108, 206601 (2012).
- (41) R. Winkler, Spin-Orbit Coupling Effects in Two-Dimensional Electron and Hole Systems, Springer-Verlag, Berlin, Heidelberg, New York.
- (42) Th. Schäpers, G. Engels, J. Lange, Th. Klocke, M. Hollfelder, and H. Lüth, J. Appl. Phys., 83, 4324 (1998).
- (43) E. O. Kane, J. Phys. Chem. Solids 1, 249 (1957).
- (44) This assumption holds exactly for a triangular confining potential, while it becomes questionable for electron sub-bands, which are less confined in the direction because the potential bends and deviates from linearity far from the interface.
- (45) A. D. Caviglia, M. Gabay, S. Gariglio, N. Reyren, C. Cancellieri, and J.-M. Triscone, Phys. Rev. Lett. 104, 126803 (2010).
- (46) A. Fete, S. Gariglio, A. D. Caviglia, J.-M. Triscone, and M. Gabay, Phys. Rev. B 86, 201105 (2012)
- (47) J. Biscaras, N. Bergeal, and J. Lesueur, private communication.
- (48) To be precise, as soon as there does exist an accessible region , where the Fermi energy falls in the negative energy regions near the bottom of the isotropic band. An analysis of Eqs. (12) and (13) for shows that if the electric field (and therefore ) stays finite when (i.e. ), then and the system is always driven unstable at sufficiently low filling. Although, depending on the value of , this latter instability could occur at very low densities, this observation might turn out to be relevant in physical systems like, e.g., semiconducting heterostructures where is small but also is very small. In this regard, we considered the possibility that RSOC mechanism could be at the origin of the negative compressibility recently observed in LAO/STO interfacesmannhart at low filling. We find that a negative compressibility in the observed range cm-2 would require values of eV m.
- (49) A similar closing of a coexistence dome at was proposed to occur in cuprates, by varying the lattice strain, in A. Bianconi, G. Bianconi, S. Caprara, D. Di Castro, H. Oyanagi, and N. L. Saini, J. Phys.: Condens. Matter 12, 10655 (2000).
- (50) V. J. Emery and S. Kivelson, Physica C 209, 597 (1993).
- (51) R. Raimondi, C. Castellani, M. Grilli, Y. Bang, and G. Kotliar, Phys. Rev. B 47, 3331 (1993); J. Lorenzana, C. Castellani, and C. Di Castro, Phys. Rev. B 64, 235127 (2001); R. Jamei, S. Kivelson, and B. Spivak, Phys. Rev. Lett. 94, 056805, (2005); C. Ortix, J. Lorenzana, and C. Di Castro, Phys. Rev. Lett. 100, 246402 (2008).
- (52) J. Biscaras, N. Bergeal, S. Hurand, C. Feuillet-Palma, A. Rastogi, R. C. Budhani, M. Grilli, S. Caprara, and J. Lesueur, Nat. Mat. 12, 542 (2013).
- (53) Z. Zhong, P. Wissgott, K. Held, and G. Sangiovanni, Europhys. Lett. 99, 37011 (2012).
- (54) M. H. Fischer, S. Raghu and E.-A. Kim, New J. Phys. 15, 023022 (2013).
- (55) A. Joshua, S. Pecker, J. Ruhman, E. Altman, and S. Ilani, Nat. Commun. 3, 1129 (2012).
- (56) A. Joshua, J. Ruhman, S. Pecker, E. Altman, and S. Ilani Proc. Nat. Ac. Sc. 110, 9633 (2013).
- (57) M. Gabay and J.-M. Triscone, Nat. Phys. 9, 610 (2013).
- (58) S. Banerjee, O. Erten, and M. Randeira, Nat. Phys. 9, 626 (2013).
- (59) Several important differences make a precise comparison with the experimental data of Ref. mannhart, difficult. First of all the top-gating used in experiments act on the filling differently from the back-gating more commonly considered both in experimental set-ups and in models for the polarity catastrophe. Secondly the experimental inverse compressibility values greatly depend on the samples, making a quantitative comparison hard to implement. Finally, some physical effects like electron-electron interaction and disorder become more important at low density ( [el/u.c.]), thereby preventing a reliable quantitative use of our schematic model.
- (60) C. Castellani, C. Di Castro, and M. Grilli, Phys. Rev. Lett. 75, 4650 (1995).
- (61) C. Castellani, S. Caprara, C. Di Castro, and A. Maccarone, Nucl. Phys. B 594, 747 (2001).
- (62) K. B. Efetov, Sov. Phys. JETP 51, 1015 (1980).
- (63) M. P. A. Fisher, G. Grinstein, and S. M. Girvin, Phys. Rev. Lett. 64, 587 (1990).
- (64) A. Vishwanath, J. E. Moore, and T. Senthil, Phys. Rev. B 69, 054507 (2004).
- (65) S. Caprara, M. Sulpizi, A. Bianconi, C. Di Castro, and M. Grilli, Phys. Rev. B 59, 14980 (1999).
- (66) C. Di Castro, L. Benfatto, S. Caprara, C. Castellani, and M. Grilli, Physica C 341, 1715 (2000).
- (67) G. Seibold, F. Becca, F. Bucci, C. Castellani, C. Di Castro, and M. Grilli, Eur. Phys. J. B 13, 87 (2000).
- (68) G. Mazza, M. Grilli, C. Di Castro, and S. Caprara, Phys. Rev. B 87, 014511 (2013).
- (69) M. Grilli and C. Castellani, Phys. Rev. B 50, 16880 (1994).
- (70) N. Cancrini, S. Caprara, C. Castellani, C. Di Castro, M. Grilli and R. Raimondi, Europhys. Lett. 14, 597 (1991).
- (71) M. Grilli, R. Raimondi, C. Castellani, C. Di Castro, and G. Kotliar, Int. J. Mod. Phys. B 5, 309 (1991); Phys. Rev. Lett. 67, 259 (1991).
- (72) Y. Bang, G. Kotliar, C. Castellani, M. Grilli, and R. Raimondi, Phys. Rev. B 43, 13724 (1991).
- (73) S. Caprara, C. Di Castro, and M. Grilli, Phys. Rev. B 51, 9286 (1995).
- (74) F. Becca, M. Tarquini, M. Grilli, and C. Di Castro, Phys. Rev. B 54, 12443 (1996).
- (75) F. Finocchiaro, D. Bucheli, S. Caprara, G. Seibold, and M. Grilli, unpublished.
- (76) G. Khalsa, B. Lee, and A. H. MacDonald, Phys. Rev. B 88, 041302(R) (2013).