A Possible Detection of Solar Gamma-Rays by the Ground Level Detector
Abstract
On March 7, 2011 from 19:48:00 to 20:03:00 UT, the solar neutron telescope located at Mt. Sierra Negra, Mexico (4,600 m) observed a 8.8 enhancement. In this paper, we would like to try to explain this enhancement by a hypothesis that a few GeV gamma-rays arrived at the top of the mountain produced by the Sun. We postulate that protons were accelerated at the shock front. They precipitate at the solar surface and produced those gamma-rays. If hypothesis is confirmed, this enhancement is the first sample of GeV gamma-rays observed by a ground level detector.
1 Introduction
This paper describes an excess of the counting rate observed by the Solar Neutron Telescope (SONTEL) located at Mt. Sierra Negra in Mexico (4,600m a.s.l. or 575g/) on March 7, 2011 from 19:48 to 20:03 UT. We attempt to explain this excess as due to the M3.7 solar flare observed by GOES. The solar flare started at 19:43 UT and reached its maximum at 20:12 UT. The RHESSI satellite also observed this flare from 19:27 UT to 20:08 UT. However the FERMI-LAT satellite and the SEDA-AP on board the International Space Station (ISS) were in the night side of the Earth until 20:02 UT.
According to the SEDA observation, the FIB neutron detector observed an excess induced by solar neutrons between 20:02 and 20:10 UT [1]. On the other hand the FERMI-LAT satellite observed a long lasting GeV gamma-ray emission after 20:08 UT [2]. The emission continued for more than 12 hours. The Solar Dynamical Observatory observed a Coronal Mass Ejection (CME) associated with this flare using their UV detector [3]. Therefore this is a good opportunity to propose a solution for the long standing question as to whether the flare starts first or the CME starts first and flares are produced afterwards [4], and question is whether the long lasting emission of gamma-rays was induced by the continuous acceleration of the ions or by the precipitation of the trapped ions in the upper magnetic loop [5].
This paper is organized as follows: In Section 2, the solar neutron telescope located at Mt. Sierra Negra is described. In Section 3, we provide the data obtained by five different kinds of satellites; the flare was observed by GOES, SEDA-FIB, FERMI-LAT, SDO and RHESSI satellites. A unified model is proposed to explain these observations in Section 4. Finally, in Section 5 we summarize and conclude.
2 Solar Neutron Telescope at Sierra Negra
A Solar Neutron Telescope (SONTEL) was installed at Sierra Negra on March 12, 2003. At Mt. Sierra Negra, Mexican astronomers were making a Large Milli-meter radio Telescope (LMT) there. They installed a power line from a village in the foot of mountain. The authorities of INAOE (The Instituto Nacional de Astrofisica, Optica y Electronica) kindly accepted our proposal to use the power line for a cosmic ray detector and the construction of the detector started.
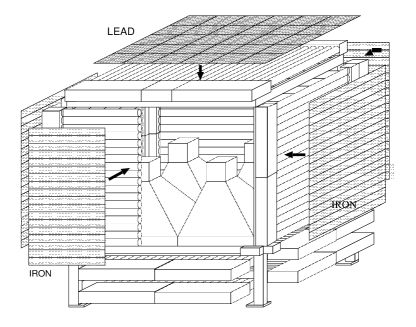
As shown in Figure 1, the core of the detector consists of 30cm thick plastic scintillator with an area of 4. The scintillators are used for the measurement of the energy of neutron-induced-protons. The arrays of the proportional counters beneath the plastic scintillator are used for the determination of the direction of the incoming neutrons. Surrounding these detectors, proportional (anti) counters are located to identify the charged particles (e, p, ) and separate them from the neutral particles (n, ). At the top of the anti-counter, a 5 mm thick lead plate is installed to stop the flux of gamma-rays. However, the efficiency of the anti-counter is estimated to be about 80 due to lack of coverage (gap) and the conversion rate of photons into electron-positron pairs in the lead and iron plates.
Here we show typical trigger rate for 10 years in Table I, separating them into three periods; 2003, 2005, and 2011. The trigger rates of anti-counters (anti-all) and scintillators have been quite stable for 10 years, however slight increase of the counting rate for neutral channels S1 and L1 is recognized. Here S1charged denotes incident charged particles (e, p, ) with deposited energy in the scintillator higher than 30 MeV and S1 represents the counting rate with the same deposited energy but induced by neutral particles (n, ). L1 represents the counting rate of the top array of the PR counters underneath the plastic scintillator.
The counting rate of the L1 channel should be produced by penetrating charged particles from the scintillator like protons or electrons, originated from neutral particles like neutrons or gamma-rays (n, ). The S1 (neutral) represents the counting rate induced by neutral particles inside the scintillator. At the moment, we do not understand the reason of the increase; probably it arises from the degradation of one of the IC chips used to make the trigger logic; Xlink Complex Programmable Logic Device (CPLD), due to the radiation damage at high altitude [6]. Another possibility may arise from the increase of the flux of gamma-rays during solar cycle 24. Anyway the ratio S1/L1 increased only 9 from 2005 to 2011.
| channel | 2003.11 | 2005.9 | 2011.3 |
|---|---|---|---|
| anti-all | 687,000 | 707,000 | 749,000 |
| S1-charged | 186,000 | 171,900 | 173,400 |
| S1(neutral) | 67,800 | 67,000 | 85,000 |
| L1(neutral) | — | 23,300 | 27,030 |
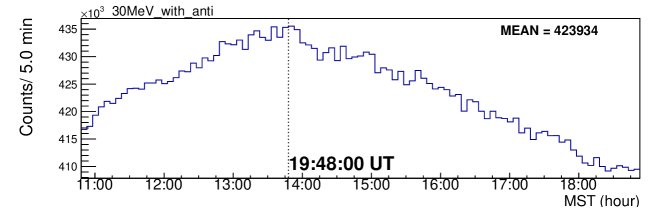
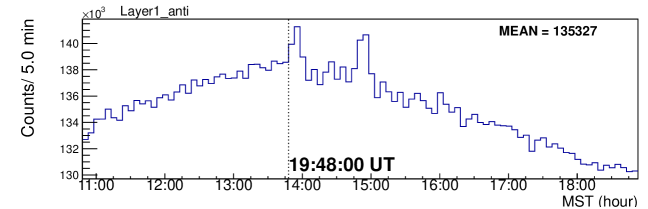
3 The time profile of the S1 and L1
n Figures 2(a) and 2(b), we present the time profile of the two typical neutral channels, S1 and L1. The excess of the counting rate at the L1 channel can be identified around 19:48-20:03 UT. It is very clear and the statistical significance of the excess was calculated as to be 8.8 using Li-Ma statistics. The number of excess was 5,700 counts within 15 minutes. On the other hand, the excess of S1 channel was about 6.0 and the number of counts was about 6,800 events. What is the problem? According to our observation of solar neutrons by the same detector on September 7, 2005, the ratio between S1/L1 was 10 [7]; however, in this case the ratio is only 1.21.8. Can we explain this ratio reasonably? Before we enter the discussions on this matter, let us look at the space environment through the data collected by several satellites.
4 Space Environment Data
Here we will present the space environment data obtained around 20 UT on March 7, 2011, based on five different satellites; GOES, RHESSI, FERMI-LAT, SEDA-FIB and SDO satellites.
1. data
The GOES satellite observed a flare of magnitude of M3.7. The flare started at 19:43 UT and reached its maximum at 20:13 UT. The flare position was identified at about N23W50 in Region 1164.
2. satellite
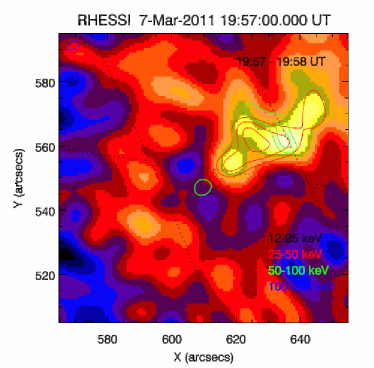
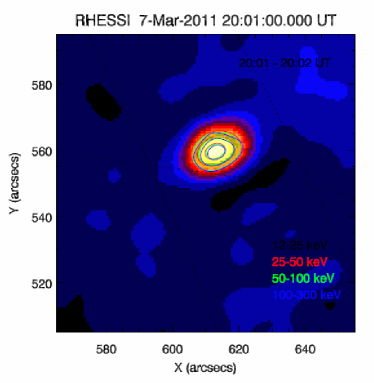
The RESSHI satellite observed a solar flare from 19:27 UT to 20:08 UT. The intensity at the beginning was weak, we can therefore make a two dimensional plot of the hard X-rays at 19:57 UT and 20:01 UT. They are presented in Figures 3a and 3b. We can recognize from these two pictures, that the position of the flare moved between the two times.
3. satellite
The FERMI-LAT satellites observed a flare from 20:08 UT. Gamma-rays with a peak intensity at 200 MeV was observed. The spectrum extended beyond 1.5 GeV. The gamma-ray emission continued for 12 hours [2].
4. detector on ISS
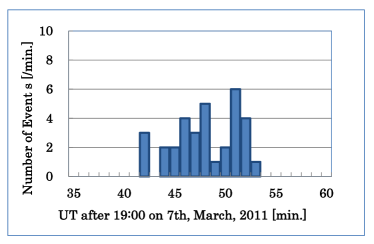
The SEDA-AP is a neutron sensor on board the International Space Station. The sensor can measure the energy and arrival direction of neutrons. Therefore the production time can be estimated through the information on the energy of neutron-induced-protons. Figure 4 indicates the production time of those neutrons. The most probable production time of neutrons is estimated as to be around 19:48 UT [1].
5. satellite
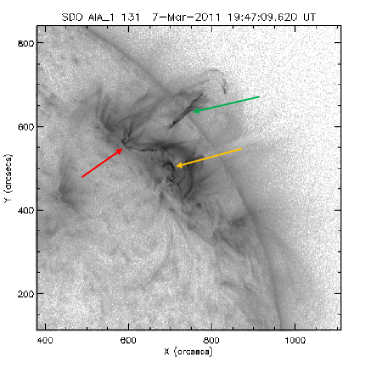
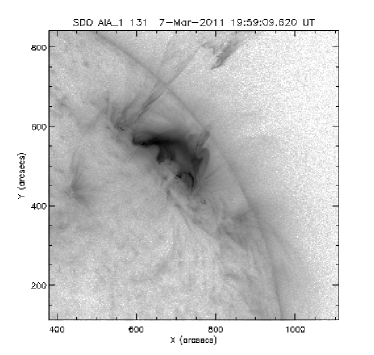
The Solar Dynamical Observatory is looking at the Sun by means of ultra-violet telescopes over different wave lengths. The SDO satellite succeeded to observe the emission of a Coronal Mass Ejection (CME) associated with this flare from the emission of early times. Furthermore not only they succeeded to observe the birth of the CME but also its development together with the start of an impulsive flare at 19:43 UT. In Figure 5a (extension of CME) and 5b (start of impulsive flare), we show the data described above. They are taken at 19:47 UT and 19:59 UT respectively.
In the next, we will introduce a hypothesis and try to explain in search of a unified model for the whole event.
5 Interpretation for the Sierra Negra event
5.1 A possible gamma-ray detection
We provide here an interpretation of the excess on the counting rate observed at Mt. Sierra Negra. First of all, the observed ratio of S1/L1 was 1.21.8, depending on how estimate the background. However, the result sharply contrasts with the assumption that this excess was produced by neutrons, as for the observation of solar neutrons on September 7, 2005, this ratio was 10. These observations have been extensively discussed in Watanabe et al 2006 [8] and Sako et al 2007 [7]. According to the calculations [9], the ratio was predicted to be 8 at En=200 MeV and 20 at En=100 MeV. However the same MC calculation predicts for gamma-rays a ratio of 1.5 at 200 MeV and 3 at 100 MeV.
We have made a new full MC calculation for gamma-rays with different energies. As a result of MC calculations, the value turns out to be 3 between E=1 GeV to 10 GeV. Based on this argument, we believe that this excess was made by gamma-rays. New MC calculation also shows the ratio of S1/L1 for neutron incidence to be .
The radiation length of the scintillator is about 40 g/. Therefore if gamma-rays enter into the plastic scintillator, they will be converted into electron-positron pairs with high probability. However those electron and positron pairs are passing through the scintillator with the minimum deposited energy like muons. On the contrary, protons loose the energy in the scintillator. This makes a sharp contrast between proton passage and electron passage in the scintillator. Thus they produce less trigger rate of the L1 channel for protons.
Can gamma-rays arrive at mountain detectors? When high energy gamma-rays enter into the atmosphere, electro-magnetic showers are produced. The incident energy is distributed into individual energies of secondary photons and electron-positron pairs. Therefore it is expected to be absorbed in the atmosphere before arrival of the detector. The critical energy to penetrate into the atmosphere is 84.4 MeV and the radiation length is 37.7g/. When very high energy gamma-rays enter into the atmosphere, they produce large air showers. Secondary electrons and gamma-rays arrive at the top of the detector. We made a MC calculation for gamma-rays with energy range from 50 MeV to 20 GeV. According to our MC calculation, when the incident energy of gamma-rays exceeds 3 GeV, the detection efficiency of gamma-rays by SONTEL exceeds beyond 1.0 (100). However for gamma-rays with E=1 GeV, the value is expected to be 0.2 (2). Concerning the S1/L1 ratio, the value is expected to be 3 in a wide energy range of E=1 GeV - 20 GeV.
Taking into account these circumstances, it would be natural to set the assumption that these excesses were produced by arriving high energy gamma-rays produced at the solar surface. If this is true, as far as we know, this is the first evidence that solar gamma-rays are detected by a ground level detector. Until now the detection of high energy gamma-rays have been made only at space vehicles.
5.2 Production time and Mechanism
According to RHESSI, the intensity of hard X-rays (25-50 keV) reached its maximum at 20:02 UT. The time does not correspond to the excess time of SONTEL (19:48-20:03 UT). On the other hand, solar neutrons were observed by SEDA-FIB. Solar neutrons were estimated to start from the Sun around 19:48 UT (Figure 4). This time accords with the enhanced time of SONTEL counting rate.
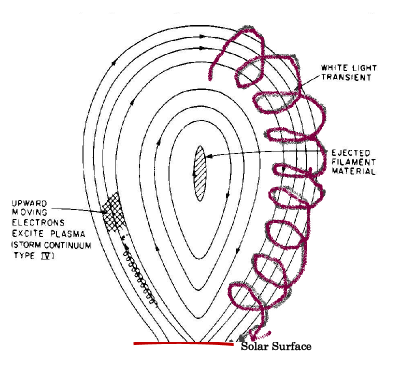
We have carefully investigated the movies of the solar surface obtained by SDO. Some key pictures are given in Figures 5a and 5b. At 19:48 UT, CME already arched. Therefore we reached the conclusion that around 19:45 the hot plasma was injected into the magnetic loop of the CME. Those were accelerated into high energy at the shock front of the CME by the shock acceleration mechanism. The highest energy of protons already reached over the energy of 30 GeV at 19:48 UT. When they reached high energy, the magnetic loop of the CME cannot involve those high energy protons inside the magnetic loop. So they precipitate onto the solar surface and produced a few GeV gamma-rays and neutrons. The whole scenario may be summarized in Figures 6a and 6b. The M3.7 solar flare was made at different place near the CME.
6 Conclusions
The excess observed by the SONTEL at Mt. Sierra Negra must be produced by high energy solar gamma-rays. As far as we know, this is the first experimental data that solar gamma-rays detected by ground level detector.
References
- [1] Y. Muraki, K. Koga, T. Goka, H. Matsumoto, T. Obara, O. Okudaira, S. Shibata, and T. Yamamoto, Advances in Astronomy, vol 2012, Article ID 37904, 14 pages, doi:10.1155/2012/379304.
- [2] Y.T. Tanaka, Proceed 32nd ICRC in Beijing, No.683, vol 10 (2011)115-116p . A. Allafort, N. Giglietto, N. Omodei, H. Takahashi and Y. Tanaka (Fermi-LAT collaboration) doi:10.7529/icrc2011v10/0683.
- [3] X. Cheng, J. Zhang, M.D. Ding, Y. Liu, and W. Poomvises, Astrophysical Journal, 763 (2013) 43. doi:10.1088/0004-637X/763/1/43.
- [4] J. T. Gosling, JGR, 98 (1993) 18937-18949. The famous graph can be found in Figure 8. Also see Harrison et al, JGR, 95 (1990) 917.
- [5] R. Ramaty and N. Mandzhavidze, AIP Conference Proceeding 294, (1993) 26-44.
- [6] N. Hirano, Proceedings of the Cosmic-Ray Research section of Nagoya University, vol 44 (2003) 15-132. (in Japanese)
- [7] T. Sako, K. Watanabe, Y. Muraki, Y. Matsubara, H. Tusjihara, M. Yamashita, T. Sakai, S. Shibata, J.F. Valdes-Galicia, L.X. Gonzalez, A. Huertado, O. Musalem et al., ApJl 651 (2006) L69-L72.
- [8] K. Watanabe, R.J. Murphy, G.H. Share, G.J. Hurford, S. Krucker, R.P. Lin, M. Harris, M. Gros, T. Sako, Y. Muraki, Y. Matsubara, S. Shibata, T. Sakai, J. F. Valdes-Galicia, L. X. Gonzalez, A. Hurtard, O. Musalem, A. Verade, R. Ticona, N. Martinic, P.P. Miranda, F. Kakimoto, Y. Tsunesada, H. Tokuno and S. Ogio, Proceed. 30th ICRC ( Merida), 1 (2007 45-48.
- [9] K. Watanabe, Proceedings of the Cosmic-Ray Research section of Nagoya University, vol 46 No2 (2005) 1-249. (in English)