11email: matute, isabel, pepa, cesar, chony, jaime, mpovic, emilio, benitez, mcs, rosa, amb, fprada, quintana@iaa.es 22institutetext: Instituto de Física de Cantabria (CSIC-UC), E–39005, Santander, Spain; fsoto@ifca.unican.es 33institutetext: Unidad Asociada Observatori Astronòmic (IFCA - Universitat de València), Valencia, Spain 44institutetext: Centro de Estudios de Física del Cosmos de Aragón (CEFCA), E–44001 Teruel, Spain; moles, dch@cefca.es 55institutetext: Instituto de Astrofísica de Canarias, La Laguna, Tenerife, Spain; jalfonso@iac.es 66institutetext: Observatório Nacional-MCT, CEP 20921-400, Rio de Janeiro-RJ, Brazil; villegas@on.br 77institutetext: School of Physics and Astronomy, Tel Aviv University, Israel; tjb@wise.tau.ac.il 88institutetext: Facultad de Física. Departamento de Física Atómica, Molecular y Nuclear. Universidad de Sevilla, Sevilla, Spain; jcc-famn@us.es 99institutetext: Institut de Ciències de l’Espai, IEEC-CSIC, Barcelona, Spain; fjc@ieec.fcr.es 1010institutetext: Departamento de Astrofísica, Facultad de Física, Universidad de la Laguna, Spain; jcn@iac.es 1111institutetext: Departamento de Astronomía, Pontificia Universidad Católica, Santiago, Chile; linfante@astro.puc.cl 1212institutetext: Departament d’Astronomía i Astrofísica, Universitat de València, Valencia, Spain; vicent.martinez@uv.es 1313institutetext: Observatori Astronòmic de la Universitat de València, Valencia, Spain
The ALHAMBRA survey: Discovery of a faint QSO at
Abstract
Aims. We aim to illustrate the potentiality of the Advanced Large, Homogeneous Area, Medium-Band Redshift Astronomical (ALHAMBRA) survey to investigate the high redshift universe through the detection of quasi stellar objects (QSOs) at redshifts larger than 5.
Methods. We searched for QSOs candidates at high redshift by fitting an extensive library of spectral energy distributions —including active and non-active galaxy templates as well as stars— to the photometric database of the ALHAMBRA survey (composed of 20 optical medium-band plus the 3 broad-band near-IR filters).
Results. Our selection over 1 square degree of ALHAMBRA data (1/4 of the total area covered by the survey), combined with GTC/OSIRIS spectroscopy, has yielded the identification of an optically faint QSO at very high redshift ( = 5.41). The QSO has an absolute magnitude of -24 at the 1450Å continuum, a bolometric luminosity of 2 erg s-1 and an estimated black hole mass of 108M⊙. This QSO adds itself to a reduced number of known UV faint sources at these redshifts. The preliminary derived space density is compatible with the most recent determinations of the high- QSO luminosity functions (QLF). This new detection shows how ALHAMBRA, as well as forthcoming well designed photometric surveys, can provide a wealth of information on the origin and early evolution of this kind of objects.
Key Words.:
cosmology: Observations – galaxies: active – galaxies: distances and redshifts galaxies: evolution – galaxies: high-redshift – quasars: general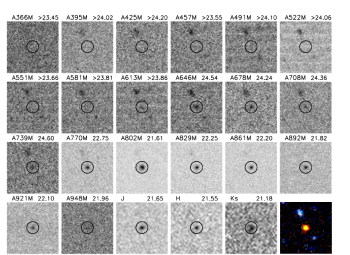
1 Introduction
It is now widely accepted that the release of gravitational energy, as matter falls into a supermassive black hole (106-9M⊙; SMBH), is the main generation mechanism for the high luminosities observed in AGN. Inside the variety of the AGN family, quasi-stellar objects (quasars or QSOs) are the fraction that shows particularly high intrinsic luminosities that allow them to be detected over very large distances. Consequently, QSOs provide a way to peer into the physical conditions of an early universe and study the history of the QSOs and their host galaxy interaction over cosmic time. The largest samples of known QSOs are provided by the optical spectroscopic surveys carried out over thousands of sq. degrees of sky (e.g. SDSS and the 2dF QSO survey, 2QZ). These surveys secure tens of thousand of QSO detections and are able to derive detailed luminosity functions up to (e.g., Richards et al. 2006b; Siana et al. 2008; Croom et al. 2009; Ross et al. 2012) in the form of double power-laws with a characteristic luminosity () and faint and bright slopes ( and for and respectively). The situation at very high- () is quite different. At these redshifts, most of the identified QSOs (300 objects above and 40 at ) sample only the brightest end of the QSO luminosity function (QLF; Wolf et al. 2003; Fan et al. 2006; Jiang et al. 2009; Willott et al. 2010b; McGreer et al. 2012; Pâris et al. 2012). Over the redshift range , less than 10% of the known QSOs (23 objects; Mahabal et al. 2005; Jiang et al. 2009; Willott et al. 2010b; Masters et al. 2012; McGreer et al. 2012) sample the faint part of the QLF ( where is the monocromatic luminosity at rest frame 1450 Å). This not only restrains our knowledge of the true number of faint QSOs at these redshifts but also severely hampers the derived accuracy of the overall QLF (given the high correlation between the LF parameters). This uncertainty in the high- QLF limits our capability to answer some important cosmological questions such as the contribution of QSOs to the epoch of re-ionization (Fan et al. 2006; Dunkley et al. 2009; Schroeder et al. 2013), the formation of SMBHs within the first billion years of the universe and its challenge to models of galaxy formation, BH formation, and BH growth (Di Matteo et al. 2005; Hopkins et al. 2010; Melia 2013; Khandai et al. 2012)
The optical selection of QSOs has been performed mainly with follow-up spectroscopic observations of colour–colour selected candidates (e.g., Croom et al. 2004; Richards et al. 2002a; Pâris et al. 2012; McGreer et al. 2012; Palanque-Delabrouille et al. 2013), using slitless or prism spectroscopic surveys and through poorly efficient flux–limited spectroscopic surveys (e.g. VIMOS–VLT Deep Survey, Bongiorno et al. 2007). The novel photometric survey definition by COMBO–17 (Wolf et al. 2003) introduced for the first time a highly efficient selection criteria for QSOs with photometric redshift (photo-) estimates with precisions of /(1+)0.03. Following the same philosophy, the Advanced Large, Homogeneous Area, Medium-Band Redshift Astronomical (ALHAMBRA111http://www.alhambrasurvey.com) survey aims at probing a large cosmological fraction of the universe with a deep and wide catalogue of extragalactic sources with highly accurate photometry (Moles et al. 2008). The survey actually covers 4 over eight different regions of sky and provides a photometric dataset over 20 contiguous, equal-width, non-overlapping, medium-band optical filters (3500 – 9700 Å) plus the 3 standard broad-band NIR filters JHKS (Benítez et al. 2009; Aparicio Villegas et al. 2010). The capabilities of the ALHAMBRA survey to select and classify extragalactic sources with its very-low-resolution-spectra have been explored for galaxies and AGN by Molino et al. (2013, submitted) and Matute et al. (2012) respectively. The photometric redshift precision achieved is /(1+)0.011 and 0.009 for galaxies and AGNs, respectively. A morphological classification for more than 20000 ALHAMBRA galaxies (with photo-) has been recently derived by Pović et al. (2013, submitted).
We present here the discovery of a UV-optically faint QSO at a redshift of 5.41 from the ALHAMBRA photometric survey. The selection criteria and spectroscopic observations are described in §2 and §3 respectively, while §4 presents the general properties of the QSO. The significance of our discovery is discussed in §4 and the conclusions are summarised in §5. Throughout this paper we assume a CDM cosmology with , , and . Unless otherwise specified, all magnitudes are given in the AB system.
2 High- QSOs candidates
Optical -dropouts have proven useful in detecting high- QSO (e.g., Fan et al. 2001, based on SDSS photometry). Unfortunately, the -dropouts and broad-band colours of a z5–6 QSO can look very similar to those of evolved/passive galaxies at z1 or of local red giants and super-giants. Matute et al. (2012) have shown that using the 23 bands of the ALHAMBRA photometric catalogue it is possible to efficiently classify an important fraction (90%) of the BLAGN/QSO population and measure highly accurate photometric redshifts.
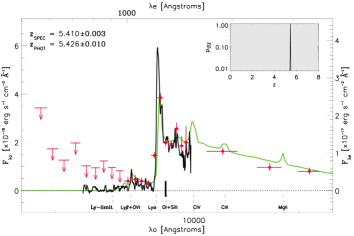
We have applied the methodology described by Matute et al. (2012) to the search for high- () QSOs using the ALHAMBRA photometric database. The candidates were selected over 1 deg2 in the two ALHAMBRA fields (out of eight; ALH-2/DEEP2 and ALH-8/SDSS) observable from the Roque de los Muchachos observatory in La Palma during the 2011B semester according to the following criteria: ) located in the fully exposed areas of the images and in regions not contaminated by bright sources flux or artifacts (e.g., spikes), ) detected (at least) in the three NIR bands and the four reddest optical222Notice that this implies the detection of flux at Å, which induces for this sample an upper limit on the redshift and a photometric upper limit . filters and ) having a best fit template of a BLAGN/QSO (templates numbers 29 to 59 in Matute et al. 2012), and photo- with a probability333The photometric redshift code LePhare provides for each source the normalized probability distribution over redshift (Pd), i.e. at each (based on the photometry quality, the SED library and parameters assumptions) Pd gives the probability that it is the correct one. at the selected redshift %. As a result of the spectroscopic follow–up of one of the highest probability candidates, we report the discovery and basic properties of ALH023002+004647, a low luminosity and very high redshift QSO. The left panel of Fig.1 shows the ALH023002+004647 cutouts of the 23 ALHAMBRA filters plus a colour composite.
| ALH-Field | ALH-2 (DEEP2) | |
| R.A. (J2000) | 02hh 30mm 02.27ss | |
| DEC. (J2000) | +00dd 46′ 46.8″ | |
| Best Fit SED | qso_0.25 (model #42) | |
| Best Fit E() | 0.08 | |
| Best Fit Ext. Law | SMC | |
| EW(Ly) | 86 | |
| 1.388 10-17 | ||
| 46.28 | ||
| (1.520.83)108 | ||
| 0.25 |
3 Observations and Data Reduction
A pilot program, containing ALH023002+004647, was approved and observed with the OSIRIS555http://www.gtc.iac.es/en/pages/instrumentation/osiris.php spectrograph at the 10-meter GTC telescope located at the Observatorio del Roque de los Muchachos in La Palma. Since only a redshift confirmation and rough spectral classification was required, we used the low-resolution red grism R300R (with a resolution of 327 and a wavelength coverage from 5000 Å to 10000 Å) with a slit width of 1.2″and a 2x2 on-chip binning. The observations of our candidates were carried out during September and November 2011 (period 2011B) under spectroscopic conditions.
The reduction process made use of standard IRAF/PyRAF facilities. Wavelength calibration was carried out by comparison with exposures of HgAr, Xe and Ne lamps. We used the 5577 Å [O I] sky emission line to correct (applying a rigid shift) for the small offsets that can be introduced by instrument flexures. Relative flux calibration was carried out by observations of the spectrophotometric standard stars G158-100 and GRW708247. Each of the four 1200 s exposures was reduced and flux calibrated independently and they were combined afterward. The final spectrum is the result of 4800 s on–source integration time at a resolution of 6.5 Å/pixel with a continuum S/N of 10 at 1450 Å rest-frame. The spectrum after smoothing with a 7 pixel-wide boxcar filter is shown in the right panel of Fig. 1, together with the ALHAMBRA photometry and best-fit template model.
4 Properties of ALH023002+004647
The spectrum of ALH023002+004647 shows typical features of a high- QSO spectrum with a a very blue continuum and prominent emission from broad Ly, N V, Ly+O VI and the Si IV+O IV] complex. The continuum blue-wards of Ly is substantially reduced due to intervening clouds of neutral hydrogen present in the IGM at different redshifts along the line of sight (the Ly forest). Nevertheless, the presence of a detectable flux blueward of Ly is a clear sign that the universe was highly ionised at the rest-frame of the source.
Table 1 resumes the main characteristics of the identified QSO.
4.1 Redshift
We derived a preliminary spectroscopic redshift based on the position of the O I + Si II emission line 1302. The observed wavelength of Ly+O VI is compatible with this redshift.
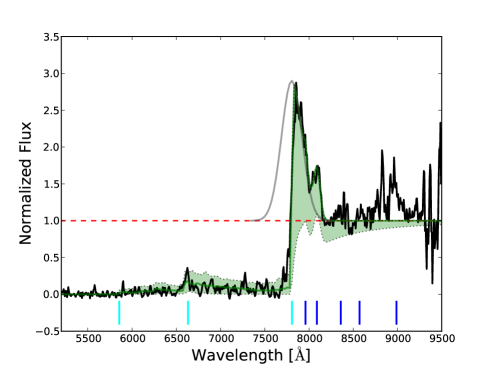
An alternative approach for measuring the redshift, which allows to use the highly asymmetric Ly + N V complex, consists in modelling the continuum and the strongest emission lines (Ly, N V and Si II), together with a stochastic realisation of the IGM absorption. The result of such an approach is shown in Figure 2. The continuum has been normalised as a power law of slope 2.5 (as F). The emission lines have been modeled with single Gaussian profiles, at a common redshift for Ly and NV, and for SiII 1260. The FWHM of the fitted Ly is 1600 km/s, well above the 1000 km/s limit offered by the instrumental resolution of the grating we used, and usual for this type of objects.
In order to include the effect of the IGM in the spectrum, we have generated 100 Ly forest absorption spectra for lines of sight corresponding to the given redshift , using the technique presented in Fernández-Soto et al. (2003). These spectra are able to reproduce the average absorption in the Ly and Ly regions, as well as the incidence of Lyman limit and Damped Ly systems and the basic statistical properties of the absorption. For each pixel in the 100 resulting spectra we calculated the resulting median, and statistical absorption, and used them to generate the IGM absorption component over our continuum plus emission-line model.
As can be seen in Figure 2, the model perfectly reproduces the highly asymmetric (Ly + N V) profile, as well as the average observed flux in the Ly and Ly forest ranges. Only for the 2.5% densest IGM absorption sightlines the model would underestimate the data redward of Lyman , and this is due to the putative presence, in those cases, of a strong Damped Ly system at a redshift close to that of the quasar itself–a possibility which is clearly discarded by the data.
The Ly redshift derived with this second method, , is in agreement with the O I + Si II estimate within the errors, but we cannot reject the possibility of an offset in the emission-line velocities, as observed in other quasar spectra. We find a small discrepancy between the redshift provided by Ly and N V, and the low-ionisation emission line. The disagreement is only of the order of 500 km/s, but in a direction opposite to the expected one. We find the low ionisation lines—supposedly marking the real, systemic redshift—to be blueshifted with respect to our only clearly detected high ionisation line, N V, which is in a position compatible with Lyman .
As a comparison, Gaskell (1982) in his pioneering work found an offset of km/s in the opposite direction to the one we find, whereas Richards et al. (2002b) and Shen et al. (2007), using large samples of quasars, found deviations of the same order, albeit with large scatter, covering from -500 out to 2000 km/s and beyond. Such scatter would, in fact, render the difference observed in ALH023002+004647 compatible with their extreme cases. However, we would need a better spectrum (particularly in terms of signal-to-noise ratio) to study the emission lines in more detail.
4.2 Companion galaxies
The cutout images of the QSO (Fig. 1) show two companions located 5″ to the NE and 4″ to the SW. According to the ALHAMBRA catalogue (Molino et al. 2013, in prep.), the NE source corresponds to an blue galaxy at photometric redshift whose spectrum peaks at 6500 Å, and the SW source corresponds to an blue galaxy at photometric redshift peaking at 5500 Å. The former has a counterpart in the NED database, the source RCS-01020502096 from the Red-Sequence Cluster Survey (Hsieh et al. 2005) with a reported redshift of 0.249. However, the band magnitude of this object () puts it well below the limit that Hsieh et al. (2005) quote for good quality redshifts in their catalogue. No other counterpart has been found for the second source. According to our data both sources correspond to low-to-average mass galaxies ().
Given the estimated masses for the companions and their distance to the QSO, they should provide negligible gravitational lensing amplification to the quasar image (Willott et al. 2005). We have checked this for the observed configuration (including both redshift possibilities in the case of the NE source), establishing an upper limit to the possible magnification of 0.4%. This may not be exact as the colours of both sources are intrinsically blue and we have used a simple model of an early galaxy type halo—however, no realistic halo model would yield a significantly different result, not over a factor of two in the magnification effect (Bartelmann & Schneider 2001).
4.3 Black hole mass
The best black hole measurements (apart from reverberation mapping) can only be obtained using the FWHM of H or MgII 2800 as a surrogate (Marziani & Sulentic 2012). Unfortunately, there is no currently available NIR spectra that covers the wavelength range where these lines are located (1.8 and 3.1 m for MgII and H respectively). Nevertheless, a crude estimation of the the black hole mass and bolometric luminosity can be obtained through the rest-frame 1350 Å continuum flux measurement. The observed 1350 Å continuum flux value of (1.780.27) 10-18 erg s-1 cm-2 Å-1 translates into an absolute luminosity of (5.030.76) erg s-1 at 1350 Å, assuming an isotropic emission and that the QSO flux has not been magnified by gravitational lensing. A bolometric luminosity of (1.911.05) 1046 erg s-1 was obtained following the prescription given in Richards et al. (2006a) (a factor at Hz). A black hole mass of (1.520.83)108M⊙ is derived assuming that the QSO is radiating at the Eddington limit (Peterson 1997). We note that a recent study of high-redshift quasars by Willott et al. (2010a) has shown that assumption to be reasonable, with all nine quasars in their sample having and .
4.4 Ancillary data
There is a detection of ALH023002+004647 by SDSS in the Stripe 82 coadd (SDSS J023002.28+004646.8) with reported magnitudes of 29.001.45, 26.621.00, 24.310.18, 22.640.07 and 21.79010 in the , , , and bands respectively. No optical, ultraviolet and radio detections by HST, GALEX, XMM-OM and VLA-FIRST are reported by MAST666http://archive.stsci.edu/ for ALH023002+004647. The Infrared Science Archive (IRSA777http://irsa.ipac.caltech.edu) provides counterparts above 5- from Spitzer/IRAC observations at 3.6, 4.5 and 5.8 m with a 3.8″aperture flux of 9.56(), 13.45() and 14.17() Jy, respectively. These fluxes are compatible, within the errors, with the photo- best fit solution SED. The sky position of ALH023002+004647 is covered by the Field-4 of the DEEP2 Redshift Survey. Neither the discovered QSO nor the companions have spectroscopic information in the latest data release DR4 (Newman et al. 2012).
The cross-correlation of the ALH023002+004647 position with the high energy HEASARC888http://heasarc.gsfc.nasa.gov/ and XSA999http://xmm.esac.esa.int/xsa/ databases reveals that the field has only been observed by XMM-Newton with the Epic camera. We find no counterpart associated with the QSO as the closest XMM-Newton detection is located 12″ from the QSO and coincides with a galaxy at .
5 Discussion
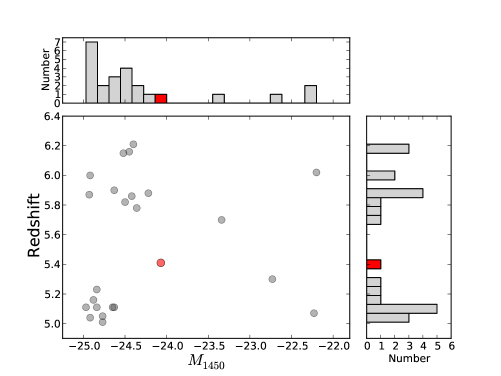
With , ALH023002+004647 is the 5th (out of 24) less luminous QSOs known above redshift of . As a consequence, it samples the faint part () of QLF, which is currently poorly constrained at these redshifts. This is illustrated in Fig. 3 where we have plotted, in the redshift–luminosity space, all the faint spectroscopically confirmed QSO with . Stronger constraints to the space density of high- low luminosity QSOs are needed to address questions as the implications for early AGN/host-galaxy interactions or the true fraction of ionizing photons coming from AGN activity in an epoch of increasing QSO activity and significant BH growth. Therefore, in the following we derive the space density associated with the ALH023002+004647 detection.
A first approximation to the contribution of ALH023002+004647 to the space density has been computed using the binned 1/Va method of Avni & Bahcall (1980), where Va is the comoving volume per magnitude and redshift interval accessible to the source, taking into account the characteristics of the survey. It is defined as,
where is the function that corrects for the survey incompleteness at each and . The space density associated to ALH023002+004647 is computed as . The first release of the ALHAMBRA photometric database has been recently finalised and its completeness needs to be addressed through extensive simulations. So, for the time being, and given our first order approximation, we will consider that all “possible” type-I QSOs within the magnitude limits of the survey could have been detected (i.e. ). We find this to be a reasonable assumption based on previous results for QSO completeness maps of similar surveys like COMBO-17 (see Fig. 4 in Wolf et al. 2003). Therefore, the volume accessible to our QSO is only delimited by the redshift range =[5.0, 6.1]. At the QSO would no longer satisfy our selection criteria, as the magnitude would be fainter than when it samples the Ly-forest of the spectra. The lower limit redshift is fixed by our requirement to have a best fit model with . The necessary -corrections have been derived using the best-fit template for the photo- solution. Considering the covered area (1 deg2) and the magnitude limit of our selection, we derive a space density of for ALH023002+004647. The errors were estimated from Poisson statistics (Gehrels 1986). The result is presented in Figure 4. In order to illustrate the large uncertainties of the high- QLF, we have delimited by a grey-shaded area the luminosity-density space covered by several published QLFs in the redshift range, namely: CFQRS+SDSS-Deep (Willott et al. 2010b), SDSS-stripe82 (McGreer et al. 2012), COMBO-17 (Wolf et al. 2003) and SDSS-Deep-Stripe (Jiang et al. 2009). Two of the most recent determinations of the QLF at (McGreer et al. 2012) and (Willott et al. 2010b) are highlighted by the blue and black lines respectively. We also report the upper limits derived by Ikeda et al. (2012) from the non-detections of QSOs in the redshift bin [4.5–5.5] of the COSMOS field (black pentagons) and the faintest QSO identification above in the SXDS field (black square) as the only constraints to the very faint end of the QLF.

The associated error due to poor statistics hardly constrains the QLFs, making our measurement compatible with all the previous, both single and double power-law, determinations. Nevertheless, the result is very promising considering that the QSO selection was made in a fraction of the total area covered by ALHAMBRA and based on preliminary photometry. With the final release of the 4 sq. degrees of ALHAMBRA data already in place, our collaboration aims to further constraint the QLF over a much larger range of magnitudes and redshifts.
6 Conclusions
We report the discovery of ALH023002+004647, a new, intrinsically faint, QSO at . The candidate was selected based on a SED fitting to the 23 bands of the ALHAMBRA photometry and spectroscopically confirmed with GTC/OSIRIS. The observed continuum luminosity at 1450 Å () and derived bolometric luminosity of 2 erg s-1, makes ALH023002+004647 one of the faintest QSOs discovered above . Based on the ALH023002+004647 space density (and associated errors), no tighter constraints can be placed on the QLF. Nonetheless, we have demonstrated the capabilities of the ALHAMBRA survey to select this type of sources. An analysis similar to the one presented here, applied to the final release of the ALHAMBRA photometric database (DR4) in the near future, will surely provide a significant contribution to the QLF at these very high redshifts.
Acknowledgements.
Part of this work was supported by Junta de Andalucía, through grant TIC-114 and the Excellence Project P08-TIC-3531, and by the Spanish Ministry for Science and Innovation through grants AYA2006-1456, AYA2010-15169 and AYA2010-22111-C03-02, and Generalitat Valenciana project Prometeo 2008/132. IM thanks Cecile Cartozo for the careful reading of the manuscript. This research has made use of the NASA/IPAC Extragalactic Database (NED) which is operated by the Jet Propulsion Laboratory, California Institute of Technology, under contract with the National Aeronautics and Space Administration. Based on observations collected at the Centro Astronómico Hispano Alemán (CAHA) at Calar Alto, operated jointly by the Max-Planck Institut für Astronomie and the Instituto de Astrofísica de Andalucía (CSIC), and on observations made with the Gran Telescopio Canarias (GTC), installed in the Spanish Observatorio del Roque de los Muchachos of the Instituto de Astrofísica de Canarias, on the island of La Palma. MP acknowledges financial support from the JAE-Doc program of the Spanish National Research Council (CSIC), co-funded by the European Social Fund.References
- Aparicio Villegas et al. (2010) Aparicio Villegas, T., Alfaro, E. J., Cabrera-Caño, J., et al. 2010, AJ, 139, 1242–1253
- Avni & Bahcall (1980) Avni, Y. & Bahcall, J. N. 1980, ApJ, 235, 694
- Bartelmann & Schneider (2001) Bartelmann, M. & Schneider, P. 2001, Phys. Rep, 340, 291
- Benítez et al. (2009) Benítez, N., Moles, M., Aguerri, J. A. L., et al. 2009, ApJ, 692, L5–L8
- Bongiorno et al. (2007) Bongiorno, A., Zamorani, G., Gavignaud, I., et al. 2007, A&A, 472, 443–454
- Croom et al. (2009) Croom, S. M., Richards, G. T., Shanks, T., et al. 2009, MNRAS, 399, 1755–1772
- Croom et al. (2004) Croom, S. M., Smith, R. J., Boyle, B. J., et al. 2004, MNRAS, 349, 1397–1418
- Di Matteo et al. (2005) Di Matteo, T., Springel, V., & Hernquist, L. 2005, Nature, 433, 604–607
- Dunkley et al. (2009) Dunkley, J., Komatsu, E., Nolta, M. R., et al. 2009, ApJS, 180, 306
- Fan et al. (2001) Fan, X., Narayanan, V. K., Lupton, R. H., et al. 2001, AJ, 122, 2833–2849
- Fan et al. (2006) Fan, X., Strauss, M. A., Becker, R. H., et al. 2006, AJ, 132, 117–136
- Fernández-Soto et al. (2003) Fernández-Soto, A., Lanzetta, K. M., & Chen, H.-W. 2003, MNRAS, 342, 1215
- Gaskell (1982) Gaskell, C. M. 1982, ApJ, 263, 79
- Gehrels (1986) Gehrels, N. 1986, ApJ, 303, 336–346
- Hopkins et al. (2010) Hopkins, P. F., Croton, D., Bundy, K., et al. 2010, ApJ, 724, 915–945
- Hsieh et al. (2005) Hsieh, B. C., Yee, H. K. C., Lin, H., & Gladders, M. D. 2005, ApJS, 158, 161
- Ikeda et al. (2012) Ikeda, H., Nagao, T., Matsuoka, K., et al. 2012, ApJ, 756, 160
- Jiang et al. (2009) Jiang, L., Fan, X., Bian, F., et al. 2009, AJ, 138, 305
- Khandai et al. (2012) Khandai, N., Feng, Y., DeGraf, C., Di Matteo, T., & Croft, R. A. C. 2012, MNRAS, 423, 2397
- Mahabal et al. (2005) Mahabal, A., Stern, D., Bogosavljević, M., Djorgovski, S. G., & Thompson, D. 2005, ApJ, 634, L9
- Marziani & Sulentic (2012) Marziani, P. & Sulentic, J. W. 2012, New A Rev., 56, 49–63
- Masters et al. (2012) Masters, D., Capak, P., Salvato, M., et al. 2012, ApJ, 755, 169
- Matute et al. (2012) Matute, I., Márquez, I., Masegosa, J., et al. 2012, A&A, 542, A20
- McGreer et al. (2012) McGreer, I. D., Jiang, L., Fan, X., et al. 2012, ArXiv e-prints
- Melia (2013) Melia, F. 2013, ApJ, 764, 72
- Moles et al. (2008) Moles, M., Benítez, N., Aguerri, J. A. L., et al. 2008, AJ, 136, 1325–1339
- Newman et al. (2012) Newman, J. A., Cooper, M. C., Davis, M., et al. 2012, ArXiv e-prints
- Palanque-Delabrouille et al. (2013) Palanque-Delabrouille, N., Magneville, C., Yèche, C., et al. 2013, A&A, 551, A29
- Pâris et al. (2012) Pâris, I., Petitjean, P., Aubourg, É., et al. 2012, A&A, 548, A66
- Peterson (1997) Peterson, B. M. 1997, An Introduction to Active Galactic Nuclei
- Richards et al. (2002a) Richards, G. T., Fan, X., Newberg, H. J., et al. 2002a, AJ, 123, 2945–2975
- Richards et al. (2006a) Richards, G. T., Lacy, M., Storrie-Lombardi, L. J., et al. 2006a, ApJS, 166, 470–497
- Richards et al. (2006b) Richards, G. T., Strauss, M. A., Fan, X., et al. 2006b, AJ, 131, 2766
- Richards et al. (2002b) Richards, G. T., Vanden Berk, D. E., Reichard, T. A., et al. 2002b, AJ, 124, 1
- Ross et al. (2012) Ross, N. P., McGreer, I. D., White, M., et al. 2012, ArXiv e-prints
- Schroeder et al. (2013) Schroeder, J., Mesinger, A., & Haiman, Z. 2013, MNRAS, 428, 3058
- Shen et al. (2007) Shen, Y., Strauss, M. A., Oguri, M., et al. 2007, AJ, 133, 2222
- Siana et al. (2008) Siana, B., Polletta, M. d. C., Smith, H. E., et al. 2008, ApJ, 675, 49
- Willott et al. (2010a) Willott, C. J., Albert, L., Arzoumanian, D., et al. 2010a, AJ, 140, 546–560
- Willott et al. (2010b) Willott, C. J., Delorme, P., Reylé, C., et al. 2010b, AJ, 139, 906–918
- Willott et al. (2005) Willott, C. J., Percival, W. J., McLure, R. J., et al. 2005, ApJ, 626, 657
- Wolf et al. (2003) Wolf, C., Wisotzki, L., Borch, A., et al. 2003, A&A, 408, 499–514