Characterization of the candidate site for the Cherenkov Telescope Array at the Observatorio del Teide
Abstract
The Spanish partners of the future Cherenkov Telescope Array (CTA) have selected a candidate site for the Northern installation of CTA, at 3 km from the Observatorio del Teide (OT), in the Canary Island of Tenerife. As the OT is a very well-characterized astronomical site. We focus here on differences between the publicly accessible measurements from the OT observatory and those obtained with instruments deployed at the candidate site. We find that the winds are generally softer at the candidate site, and the level of background light comparable to the Observatorio del Roque de los Muchachos (ORM) at La Palma in the B-band, while it is only slightly higher in the V-band.
1 Introduction
The Canaries have two islands with world-class skies for astronomy, which can compete for hosting CTA-North. These islands host two international observatories which together constitute the most important optical, infrared and gamma-ray observatories in Europe: the Observatorio del Teide (OT) at the island Tenerife, and the Observatorio del Roque de los Muchachos (ORM) at the island La Palma. A specific National Law protects the quality of the sky in these observatories [1]. As La Palma does not fulfill the current CTA requirement of having flat land of 1 km2 above 1,500 meters, we have selected a site in Tenerife, close to the OT. This site is a plateau at an altitude of 2,260 m a.s.l. with the geographic coordinates 28∘16’36” N and 16∘32’08” W. It has the great advantage of being located at only 3 km from the OT, which has all kind of infrastructure for an observatory available, and only 5 km away from the Izaña Atmospheric Observatory (IZO), where the atmosphere is extensively characterized.
The astronomical quality of an observatory is largely determined by the transparency of the sky above it and the number of useful hours of observation it offers each year (useful time). These two constraints are intimately bound up with the site climate and geography. The excellent conditions at the region of the Canarian observatories result from the Canary Islands geographical location, their orography, and the legal measures in place to protect sky quality. It’s worth mentioning that OT has been used and characterized as observatory for the last 50 years, and that the characterization of the atmosphere at IZO covers almost one century. This long-term data monitoring provides reliability to the data presented here.
2 Weather Conditions
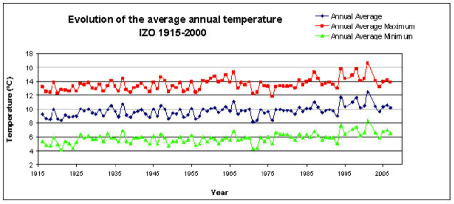
Temperature measurements.
The average temperature at the OT is 9.8∘C, with
minimum and maximum averages being 5.9∘C and 13.6∘C
respectively [2]. These
agree with the temperatures measured at IZO,
yielding an average annual temperature around 10∘C, for the
period from 1915 to 2000, and average minima and maxima around
6∘C and 13∘C, respectively (Fig. 1).
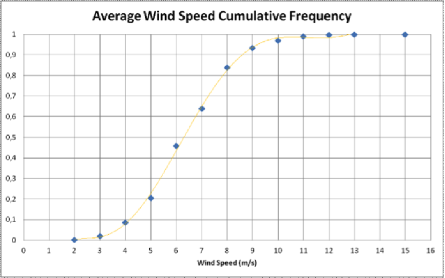
Wind Measurements. Due to the abrupt orography of the island, wind speed and direction greatly vary from place to place. Wind speed data at IZO are available since 1933 and are publicly accesible from the AEMET webpage [5]. The wind speed measurements were taken every second or every 0.25 seconds (depending on the anemometer which has changed over the years). The average wind speed values have been averaged every 10 minutes. The IZO anemometer was placed at different heights: from Jan 1933 to Feb 1984 at 12 m height, then until Feb 2000 at 16 m and then to present at 10 m height. Fig. 2 presents the monthly average wind speed cumulative frequency at IZO from 1933 to present: For over 90% of the values, the average wind speed is lower than 9 m/s (32.4 km/h). The average value lies at 6.8 m/s (24.6 km/h). It is however expected that the wind speeds are lower at the CTA candidate site (CTA-s), since IZO is located at the top of the most exposed peak in the area, whereas the CTA-s is more shielded.
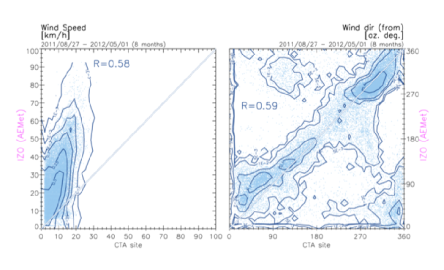
In Fig. 3, we show a comparison of simultaneous wind measurements at IZO and the CTA-s, from Aug 2011 to Apr 2012. We compare wind at 10 m height at IZO with wind at 2.5 m height at the CTA-site (Fig. 3-left) and find that the wind speed at the CTA-s is always about a factor 3 lower than at IZO. In Fig. 3-right we compare the simultaneous wind direction, and find again that there is a quite strong global correlation between the two sites.
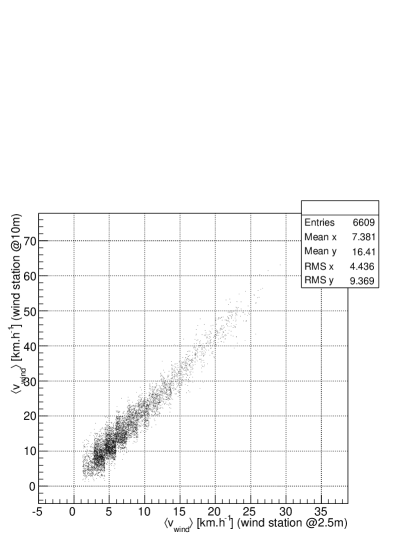
To test whether the difference in the position of the anemometers can
account for the large difference in wind speed observed at CTA-s
compared to IZO, we compare measurements taken both at CTA-s with the
sensor at 2.5 m and 10 m above the ground, from Dec 2012 to April
2013. Fig. 4 shows the results. We see a clear correlation,
and roughly an increase of a factor 2 in wind speed from 2.5 m to 10 m.
Compared to Fig. 3 we still observe that the typical CTA-s
wind speed is about two thirds of that at IZO.
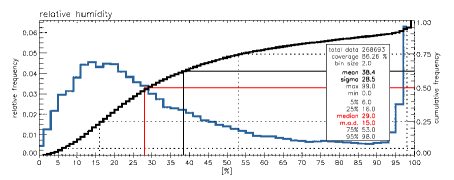
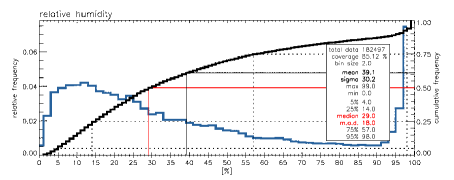
Humidity Measurements.
The values presented here correspond to measurements taken at IZO and at the OT
The median, mean and percentiles (5%, 25%, 75% and 95%) are given
in Fig. 5.
The median is found at 29% humidity,
and in 75% of the night-time, the relative humidity is
lower than 55%.
The median humidity value of 29%, found for this one
year of data, coincides with the value
obtained from a 5-year site characterization campaign for the
European Solar Telescope (EST), carried out from 2003 to 2008 at the
OT. However, the highest humidity values are less frequent in this
long database [6].
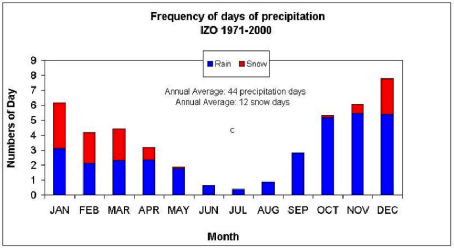
Precipitation Measurements.
The climate at the IZO region is extremely dry most of the year,
as it lies above the quasi-permanent temperature inversion layer, in
the dry free troposphere. Precipitation is mainly recorded in winter
time when Atlantic low areas pass over the Canary Islands.
Fig. 6 presents the seasonal
frequency of days of appreciable precipitation (i.e. precipitation
0.1 mm), observed at IZO for the period from 1971 to 2000.
The annual average during this period is about 44 precipitation days.
Out of these, about 11 days are of snow precipitation, mainly from Nov
to Apr, and, less frequently, from May to Oct.
Considering only the days with precipitation 10 mm, the
annual number of days goes down to 11 precipitation days per year.
The AEMET public database also gives the number of days with hail per
month from 1920 to 2011. The annual average for this period amounts to
1.5 days of hail per year.
3 Atmospheric Quality
The Cherenkov light that arrives to the telescopes from the particle
showers in the high atmosphere is highly dependent on the quality of
the atmosphere that it traverses. In fact different density profiles
lead to differences in Cherenkov light density of up to
60% [8], and the presence and position of clouds and
aerosol layers also affect differently the atmosphere transmission [9].
Cloud Coverage and Useful Nights. The atmosphere in the subtropical region of the Canary Islands is characterized by its great stability throughout the year. This is due to the combination of two processes of the atmospheric circulation at large scale [10]. One of them is the descending branch of the Hadley cell around 30∘ N and the other one the Trade or Alisios Winds coming from the Azores high area that blow in the low troposphere above an ocean which is relatively cold. As a result, a temperature inversion layer appears around 1,300 m a.s.l. on average, called the “Alisio inversion”, which can be usually well identified by the sea of stratocumulus on the Northern coasts of the islands. This layer separates two well-defined regimes: below it, there is the moist marine boundary layer and above it, the dry free troposphere (where the OT and the CTA-s are located). The Alisio inversion is a quasi-permanent layer, being present 78% of the time throughout the year. Its altitude and thickness has a seasonal dependence, being higher and thinner during the winter (when it is located between 1,350 and 1,850 m a.s.l., being only 350 m thick) and lower and thicker during the summer between 750 and 1,400 m a.s.l., being about 550 m thick) [11]. Unfortunately, so far there are no specific and well-calibrated instruments for ground measurements of cloud coverage at the OT or IZO. We present here a compendium with the most relevant data found: sunshine measurements at IZO and useful time at the ORM observatory on La Palma, 140 km away and also located at 2400 m a.s.l., i.e. also above the inversion layer, and cloud coverage at the ORM calculated with satellites.
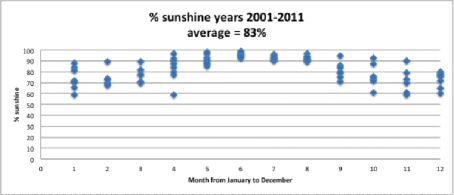
The insolation, defined as the period of time during which the sun shines, at IZO is very high, especially in summer, recording the highest average annual insolation duration of Spain with 3448.5 hr/year. Fig. 7 shows the monthly insolation in percentage taken with a heliograph at IZO from Jan 2001 to Dec 2011. The average is 83% of sunshine. Detailed satellite studies have been carried out by the certified consulting meteorologist Dr. André Erasmus for the ORM on La Palma, showing that the photometric time at this observatory is 83.7% (for the 7-year period 1996-2002). Cross-calibration with ground measurements using the Carlsberg Meridian Telescope (CMT) at the ORM shows a good agreement of the data [13], with only 1.2% differences [14].
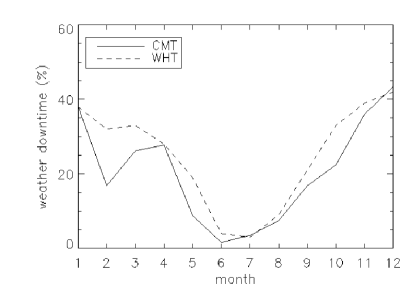
The weather downtime calculated [15] for the period 1999-2003 using the logs of the CMT telescope obtained an average of 20.7% weather downtime (defined as the period when there were no recorded observations during a whole night). The monthly average of weather downtime was also calculated and compared with the one obtained at the William Herschel telescope (WHT) for the 18-year period from 1989 to 2006 and it is in good agreement with the previous numbers, see Fig. 8.
Other in-situ measurements of useful time at the ORM yield the values:
78% [17], 75% [18] (11-year time interval) and
72.7%-77.5% [19] (4-year period). More detailed
references and data can be found at the IAC Sky Quality Group
webpage [20]. At both observatories, the percentage of time
lost per year due to adverse atmospheric conditions remains between
16.3% and 27.5%, depending on the methodology for calculations and
the selected period of time.
In-site Particle Matter.
Cuevas et al. [21] concludes that in-situ TSP, PM10 data, and
Aerosol Optical Depth (AOD) observations performed at IZO demonstrate
that the site IZO-OT is characterized by extremely clean air and
pristine skies. IZO-OT is sometimes affected by dust-loaded African
air mass intrusions in the summer time (Jul-Sep), called
calima. Since African air masses impact only in summer when
nights are short, the annual percentage of nocturnal observing
affected by calima is very low. In addition, most of the dust uses
to keep below the inversion layer and hardly affect the observatory.
Finally, the fact that under calima intrusions, middle clouds are normally
observed between 5 and 6 km altitude minimizes the negative impact of these
intrusions on astronomical observations performed at the OT. Overall, the
low impact of calima events can be seen in Fig. 7 where the weather
downtime percentage in summer months is lower than 10% at the ORM.
Night Sky Background (NSB). Here we present the results of a document about NSB at OT and ORM by M. Nievas-Rosillo, supervised by R. Barrena-Delgado, from summer 2012, to be published soon. The following table shows NSB measurements in the V-band (mag/arcsec2) for the OT taken with 3 different instruments, an all-sky camera of type AstMon, an 80 cm telescope (the IAC80) and the sky-quality-meter from Unihedron (SQM), similar to the one used in the CTA-ATMOSCOPE, corrected for the light contamination by the Milky Way:
| Instrument | All Data | From 2011 |
|---|---|---|
| AstMon (From 2012) | 21,41 0,15 | 21,41 0,15 |
| IAC80 (From 2006) | 21,24 0,34 | 21,39 0,38 |
| SQM (From 2006) | 21,25 0,23 | 21,21 0,16 |
The results of NSB measurements in the V- and B-bands (mag/arcsec2) [22] are compared between OT and ORM (both are telescope measurements) in the next table:
| Instrument | B | V |
|---|---|---|
| IAC-OT | 22,34 0,25 | 21,23 0,13 |
| ORM | 22,70 0,03 | 21,90 0,03 |
| Diff OT-ORM | 0,36 0,24 | 0,67 0,13 |
We can see that the typical night sky at OT is brighter than that of ORM,
which is a very dark astronomical observatory. It is interesting to note
that the difference in the B band, which is closer to the spectral
sensitivity of the photo-multipliers employed for the CTA telescopes is only
mag/arcec2.
4 Conclusions
The site proposed by the Spanish partners of CTA at 3 km from the OT consitutes an excelent candidate to host CTA-North. Actually, OT, together with ORM in La Palma, is a very extensively and long-term characterized astronomical observatory. Such a long-term database makes the knowledge of the atmospheric conditions very reliable and reduces the risk of a wrong characterization from short-term measurements. We have summarized the main climate and atmospheric parameters obtained from public databases. In order to complement the public databases, some measurements have been taken with instruments deployed at the candidate site. Of special importance is the result we have obtained by comparing wind speeds: the wind speed at the candidate site is about one thirds lower than that at IZO, according to the fact that the site is more shielded than the IZO anemometer. Recent results on the NSB measurements at the OT compared with ORM show that even though the night sky at OT is brighter than that of ORM, the difference in the B band is very low and will hardly affect the CTA performance.
Acknowledgements:
We gratefully acknowledge support from the agencies and organizations
listed in this page:
http://www.cta-observatory.org/?q=node/22
References
- [1] Ley 31/1988 del 31 de Octubre.
- [2] See http://www.iac.es/proyecto/site-testing/index.php?option=com_content&task=view&id=90
- [3] Graph from IARC webpage on climatology http://www.izana.org/index.php?option=com_content&view=article&id=23&Itemid=23&lang=en
- [4] Data from AEMET database http://www.aemet.es/es/servidor-datos/acceso-datos/listado-contenidos/detalles/series_climatologicas
- [5] http://www.aemet.es/es/servidor-datos/acceso-datos/listado-contenidos/detalles/series_climatologicas
- [6] Sky Quality Group of the IAC, private communication.
- [7] Graph from IARC webpage on climatology http://www.izana.org/index.php?option=com_content&view=article&id=23&Itemid=23&lang=en
- [8] K. Bernlöhr, Astropart.Phys. 12 (2000) 255-268
- [9] D. Garrido et al, these proceedings ID 465
- [10] see e.g. Palmén E. and Newton C.W, International Geographic ser. 13, Academic Press Ed (1969)
- [11] see e.g. Torres C. et al., 3rd Hispanic-Portuguese Assembly of Geodesics and Geophysics (2002).
- [12] Data from AEMET database http://www.aemet.es/es/servidor-datos/acceso-datos/listado-contenidos/detalles/series_climatologicas
- [13] Erasmus, D.A. and van Rooyen, R. Final Report to ESO 2006, Purchase Order 73526/TSD/04/6179/GW/LET
- [14] Muñoz-Tuñón, C., Varela, A. M. and Fuensalida, J. J. RevMexAA 31 (2007) 36-46.
- [15] García-Gil, A., Muñoz-Tuñón, C., and Varela, A. M., PASP 122:1109-1121, 2010.
- [16] Graph from [15].
- [17] Murdin P., Vistas in Astronomy 28, Issue 2 (1985) 449-465.
- [18] ING Annual Report 1999 of PPARC-NWO ING Board, and Rutten, R.G.M “ING Director’s Report: operations and development”, 9-10 April 2001.
- [19] Lombardi, G., Zitelli, V., Ortolani, S., Pedani, M., PASP, 118 (2006) 1198-1204
- [20] http://www.iac.es/proyecto/site-testing/index.php?option=com_content&task=view&id=89
- [21] Cuevas, E. and Baldasano, J.M., AEMET and BSC-CNS, 2009.
- [22] Nievas-Rosillo et al. (2013) in preparation.