119–126
Detection of the buckminsterfullerene cation (C) in space
Abstract
In the early 90’s, C was proposed as the carrier of two diffuse interstellar bands (DIBs) at 9577 and 9632 Å, but a firm identification still awaits gas-phase spectroscopic data. Neutral C60, on the other hand, was recently detected through its infrared emission bands in the interstellar medium and evolved stars. In this contribution, we present the detection of C through its infrared vibrational bands in the NGC 7023 nebula, based on spectroscopic observations with the Spitzer space telescope, quantum chemistry calculation, and laboratory data from the literature. This detection supports the idea that C could be a DIB carrier, and provides robust evidence that fullerenes exist in the gas-phase in the interstellar medium. Modeling efforts to design specific observations, combined with new gas-phase data, will be essential to confirm this proposal. A definitive attribution of the 9577 and 9632 Å DIBs to C would represent a significant step forward in the field.
keywords:
Fullerenes, PAHs, interstellar medium, diffuse interstellar bands, spectroscopy1 Introduction
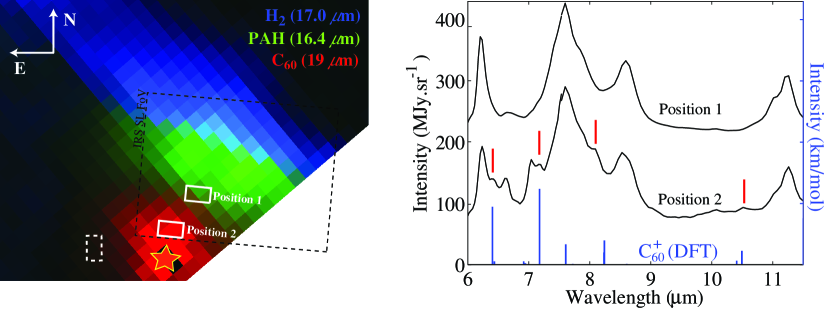
The mid-infrared (mid-IR) spectrum of galactic and extragalactic objects exhibits band emission (strongest at 3.3, 6.2, 7.7, 8.6, and 11.2 m) attributed to carbonaceous macromolecules, i.e., polycyclic aromatic hydrocarbons (PAHs, see recent state of the art in Joblin & Tielens (2011)). In addition to PAH bands, IR emission bands at 7.0, 8.5, 17.4, and 19.0 m have recently been reported (Cami et al., 2010; Sellgren et al., 2010), and found to match quite closely the IR active bands of buckminsterfullerene (C60, Kroto et al. (1985)), a cage-like carbon molecule. Carbonaceous macromolecules, including PAHs, carbon clusters, or fullerenes, are believed to play a fundamental role in the physics and chemistry of the interstellar medium (ISM), and their infrared signatures are commonly used as a tracer of physical conditions. Nevertheless, C60 is the only molecule belonging to this family, which has been specifically identified in the ISM. In the NGC 7023 reflection nebula, Sellgren et al. (2010) have shown that C60 is predominantly found in the regions closest to the star. In that part of the nebula, UV irradiation is high (above times the interstellar standard radiation field), and PAH molecules are ionized (Rapacioli et al., 2005; Berné et al., 2007; Pilleri et al., 2012), if not destroyed (Berné & Tielens, 2012; Montillaud et al., 2013). One could therefore expect C to be present in these regions.
Foing & Ehrenfreund (1994) reported evidence for interstellar C based on the detection of two diffuse interstellar bands (DIBs) at 9577 and 9632 Å, however this identification is still questioned considering that no spectroscopic information on C could be recorded yet, in conditions appropriate for DIB identification, i.e., in the gas-phase and at low temperature. The IR spectrum of C was measured in a rare-gas matrix by Fulara et al. (1993) and was found to exhibit two bands at 7.1 and 7.5 m. Kern et al. (2012) have performed new spectroscopic measurements and suggested that the latter band was due to C, whereas the authors attributed a band at 6.4 m to C. Moutou et al. (1999) derived upper limits on the abundance of C in NGC 7023 based on ISO-SWS data. So far, there has been no observational evidence of any 7.1 or 6.4 m bands in astronomical sources.
Looking carefully at the Spitzer data of NGC 7023, we found four emission bands, at 6.4, 7.1, 8.2, and 10.5 m, which are only present in the regions closest to the star. This also corresponds to a region where C60 emission is strong. A natural carrier to explain these bands is C, and this assertion is supported by spectroscopic arguments that we discuss hereafter.
2 Observational results
Fig. 1 shows two mid-IR spectra extracted in NGC 7023 at two positions, one close the the star and one farther away. These spectra have in common that they are dominated by bands at 6.2, 7.7, 8.6, and 11.2 m, which are attributed to vibrational modes of PAH molecules. In addition to these bands, the spectrum at position 2 shows several bands that are absent in the rest of the nebula. These are at 6.4, 6.6, 7.0, 7.1, 8.2, and 10.5 m (Fig. 1). These bands are seen in several pixels of the IRS cube and well above the instrumental errors (Berné et al., 2013). To derive the precise parameters for these bands we fit them using Gaussian profiles and spline curves to subtract the underlying emission due to the wings of PAH bands. The positions, widths, and intensities of the bands are given in(Berné et al., 2013). The 7.0 m band has been attributed to C60 (Sellgren et al., 2010). The 6.6 m band has recently been attributed to (possible) planar C24 (García-Hernández et al., 2011). The 6.4, 7.1, 8.2, and 10.5 m bands have not been observed or discussed yet. Since HD 200775 is a B star, only low ionization potential atoms should emit in fine structure lines (e.g. [CII], [SIII] etc.), and these species do not have lines in this spectral range, so we exclude contamination by fine structure lines. These four new bands seem spatially correlated, i.e. all of them only appear in the regions closest to the star, which suggests a common carrier. As shown by Sellgren et al. (2010), C60 is also found only close to the star. Still, the four new bands only appear in the regions that are closest to the star, while Fig. 1 demonstrates that C60 emission is more extended. This suggests that the four new bands are carried by a species that is a product of the photoprocessing of C60 , an obvious carrier being C. In the following section we provide the spectroscopic arguments that support this observational evidence.
3 Spectroscopic signatures of C
The only IR spectroscopic data of C have been obtained in rare gas matrices by Fulara et al. (1993) and more recently by Kern et al. (2012). Two bands at 7.1 and 6.4 m seem definitively attributed to C, based on these experimental studies. Theory is another approach to obtain spectroscopic data, and density functional theory (DFT) in particular has been shown to be effective and accurate for calculations on neutral C60 (Chase et al., 1992; Fabian, 1996; Iglesias-Groth et al., 2011). However, an additional theoretical problem is that upon ionization C60 is known to undergo Jahn–Teller (JT) distortion (Chancey & O’Brien, 1997; Bersuker, 2006). This is described in more details in Berné et al. (2013) where we conclude that the accuracy of the calculated frequencies, guided by laboratory data, are nevertheless sufficient for an assignment. We performed our DFT calculations using the hybrid B3LYP exchange–correlation functional and the 4–31g Gaussian basis set. This combination is known to yield reasonably accurate vibrational frequencies, after scaling with an empirical factor to account for the overestimation of the frequencies. In the case of PAHs, is calculated by comparing the computed frequencies to the ones measured in the laboratory at low temperature in rare gas matrices (see Bauschlicher & Langhoff (1997) for a case-study on PAHs). Therefore, we used the IR absorption spectrum of C that was measured in Ne matrices by Kern et al. (2012) to calibrate our DFT calculations. The two bands definitively attributed to C by Kern et al. (2012) are found at 1550 and 1406 cm-1 and correspond to the strongest bands, predicted by theory at 1607 and 1434 cm-1. This implies a respective scaling factor of 0.9645 and 0.9805. We adopt an average value of . The resulting spectrum is shown in Fig. 1 (see Berné et al. 2013 for the list of unscaled frequencies). After scaling, the five strongest IR bands fall at wavelengths of 6.40, 7.17, 7.60, 8.23 and 10.50 m. Four of these are very close (within 2%) to the positions of the four new bands detected in NGC 7023 (6.43, 7.13, 8.10, 10.53 m). The observed match is very good considering that other factors are expected to affect the band positions, in particular band shift due to anharmonic coupling in hot emitting molecules (Joblin et al., 1995). The nondetection of the 7.6 m band in the observations is not surprising, since it is most likely hindered by the strong PAH emission at the same position (Fig. 1). Based on the observational (Sect. 2) and spectroscopic arguments presented, we argue that there is strong evidence for the presence of C in NGC 7023. Using the mid-IR intensity of the 4 bands detected in NGC 7023, we derive an abundance of about 10-4 of the elemental carbon to be locked in C(see Berné et al. 2013 for details).
4 Relation to DIBs
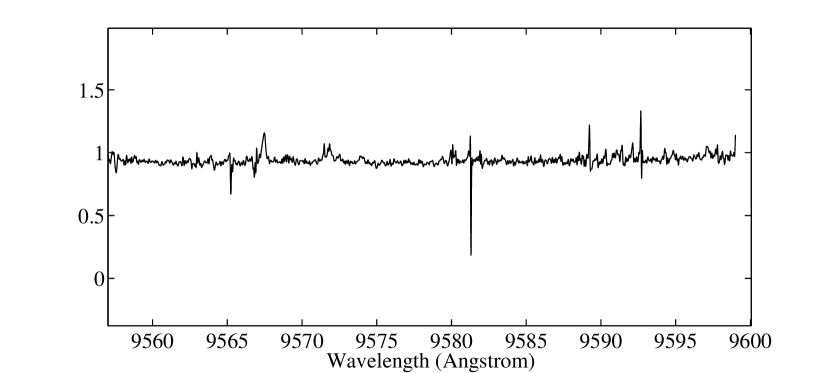
The 9577 and 9632 Å DIBs observed towards several hot stars have been attributed to the absorption of C present in the diffuse ISM (Foing & Ehrenfreund, 1994). However, the laboratory spectroscopic data on which this assignment relies were obtained in rare-gas matrices, and therefore a definitive attribution still awaits gas phase laboratory data. The detection presented here supports the idea that C is present in the ISM. However it should be noted that the abundances derived from the mid-IR emission spectrum of NGC 7023 are a factor of at least 10 smaller than those found by Foing & Ehrenfreund (1994) for the diffuse ISM. Since these environments are radically different, as well as the techniques used to derive these abundances, one cannot argue that this discrepancy is significative. The large abundances found in the diffuse ISM could result from high yields of C60 and C formation by the photochemical processing of PAHs under irradiation by massive stars, over large timescales (Berné & Tielens, 2012). In any case, the rather low abundance of C found in NGC 7023 suggests that, if they are indeed due to C, the 9577 and 9632 Å DIBs are expected to have a very weak optical depth in this object. Detailed calculations to determine if these absorptions could be detected in NGC 7023 are ongoing, but as a first check we have looked for the presence of the 9577 DIB in the near infrared spectrum of HD 200775. The data were obtained at the Pic du Midi observatory, with the NARVAL instrument, on the 2 meter Bernard Lyot telescope and with a resolution of 65 000 and presented in Alecian et al. (2008). The spectrum of HD 200775 was divided by a reference star in order to remove the telluric lines which are ubiquitous in this spectral range. So far, we were unable to find any signature of the 9577 Å DIB (Fig. 2, note that the 9632 Å DIB falls outside of the wavelength range observable with NARVAL). However, we insist that this non-detection cannot rule out the presence of the 9577 Å DIB in NGC 7023, especially because the signal-to-noise ratio obtained here is not optimal. Detailed modeling relying on the available laboratory data is needed to determine if this band together with the 9632 Å DIB are detectable. In the latter case, specific observations in the near-IR should be designed to maximize the chances of detection in the surroundings of HD 200775. In this frame, new gas-phase spectroscopic data in this spectral range would be an invaluable asset.
5 Conclusion
After studying the mid-IR spectra of the NGC 7023 nebula, we have found spectral signatures at 6.4, 7.1, 8.1, and 10.5 m, which we attribute to C60 in the cationic charge state (C). C has been proposed as a DIB carrier, and our identification supports this proposal. Ultimately, one would want to identify in the same source the spectroscopic signatures of C, in emission and in absorption. Modeling efforts to design specific observations, combined with new gas-phase data will be essential to reach this goal which would represent a significant step forward in the field of DIB research. Finally, we note that the detection presented in this paper also provides direct evidence for the presence of large carbon molecules in the gas phase in the ISM, giving further support to the PAH hypothesis (Leger & Puget, 1984).
References
- Alecian et al. (2008) Alecian, E., Catala, C., Wade, G. A., et al. 2008, MNRAS, 385, 391
- Bauschlicher & Langhoff (1997) Bauschlicher, C. W. & Langhoff, S. R. 1997, Spectrochimica Acta Part A: Molecular and Biomolecular Spectroscopy, 53, 1225
- Berné et al. (2007) Berné, O., Joblin, C., Deville, Y., et al. 2007, A&A, 469, 575
- Berné et al. (2013) Berné, O., Mulas, G., & Joblin, C. 2013, A&A, 550, L4
- Berné & Tielens (2012) Berné, O. & Tielens, A. G. G. M. 2012, Proceedings of the National Academy of Science, 109, 401
- Bersuker (2006) Bersuker, I. C. 2006, The Jahn–Teller Effect (Cambridge University Press)
- Cami et al. (2010) Cami, A., Bernard-Salas, A., Peeters, E., & Malek, S. E. 2010, Science, 329, 1180
- Chancey & O’Brien (1997) Chancey, C. C. & O’Brien, M. C. M. 1997, The Jahn–Teller Effect in C60 and Other Icosahedral Complexes (Princeton University Press)
- Chase et al. (1992) Chase, B., Herron, N., & Holler, E. 1992, The Journal of Physical Chemistry, 96, 4262
- Fabian (1996) Fabian, J. 1996, Phys. Rev. B, 53, 13864
- Foing & Ehrenfreund (1994) Foing, B. H. & Ehrenfreund, P. 1994, Nature, 369, 296
- Fulara et al. (1993) Fulara, J., Jakobi, M., & Maier, J. P. 1993, Chemical Physics Letters, 206, 203
- García-Hernández et al. (2011) García-Hernández, D. A., Iglesias-Groth, S., Acosta-Pulido, A. A., et al. 2011, ApJL, 737, L30
- Iglesias-Groth et al. (2011) Iglesias-Groth, S., Cataldo, F., & Manchado, A. 2011, MNRAS, 413, 213
- Joblin et al. (1995) Joblin, C., Boissel, P., Leger, A., D’Hendecourt, L., & Defourneau, D. 1995, A&A, 299, 835
- Joblin & Tielens (2011) Joblin, C. & Tielens, A. G. G. M., eds. 2011, EAS Publications Series, Vol. 46, PAHs and the Universe: A Symposium to Celebrate the 25th Anniversary of the PAH Hypothesis
- Kern et al. (2012) Kern, B., Strelnikov, D., Weis, P., Böttcher, A., & Kappes, M. M. 2012, in 67th International Symposium on Molecular Spectroscopy
- Kroto et al. (1985) Kroto, H. W., Heath, A. R., Obrien, S. C., Curl, R. F., & Smalley, R. E. 1985, Nature, 318, 162
- Leger & Puget (1984) Leger, A. & Puget, A. L. 1984, A&A, 137, L5
- Montillaud et al. (2013) Montillaud, Joblin, C., & Toublanc, D. 2013, A&A, 552, A15
- Moutou et al. (1999) Moutou, C., Sellgren, K., Verstraete, L., & Léger, A. 1999, A&A, 347, 949
- Pilleri et al. (2012) Pilleri, P., Montillaud, A., Berné, O., & Joblin, C. 2012, A&A, 542, A69
- Rapacioli et al. (2005) Rapacioli, M., Joblin, C., & Boissel, P. 2005, A&A, 429, 193
- Sellgren et al. (2010) Sellgren, K., Werner, M. W., Ingalls, A. G., et al. 2010, ApJ, 722, L54