An Astrometric Search for a Sub-stellar Companion of the M8.5 Dwarf TVLM 513–46546 Using Very Long Baseline Interferometry
Abstract
We conducted multi-epoch VLBI observations to search for astrometric reflex motion caused by a sub-stellar companion of the M8.5 dwarf TVLM 513–46546. The observations yield an absolute parallax corresponding to a distance of pc and a proper motion of mas yr-1. From the absence of significant residual motion, we place an upper limit to any reflex motion caused by a companion, extending the parameter space covered by previous near-infrared direct-imaging searches. By covering different orbital periods, the data exclude a phase-space of companion masses and orbital periods ranging from 3.8 with an orbital radius of AU (orbital period of 16 days) to 0.3 with an orbital radius of AU (orbital period of 710 days).
1 Introduction
Searches for extrasolar planets over the past decade have successfully utilized a wide range of techniques, including radial velocity, transits, gravitational microlensing, direct imaging, and even pulsar timing (Wolszczan & Frail, 1992; Mayor & Queloz, 1995; Charbonneau et al., 2000; Bond et al., 2004; Kalas et al., 2008). The various techniques provide sensitivity in different ranges of the orbital period and exoplanet mass phase-space, as well as in terms of the primary star’s brightness. In particular, radial velocity and transit searches of very low mass stars and brown dwarfs are quite challenging due to the faintness of these objects, their broad (molecular) spectral features, and their ubiquitous variability; indeed only a few exoplanet host stars with masses of M⊙ are currently known (Charbonneau et al., 2009; Kubas et al., 2012; Muirhead et al., 2012). An additional technique, which has not yielded exoplanet detections so far, is optical/infrared astrometry (Pravdo et al. 2005; although see the recent detection of a Mjup companion to an L1.5 dwarf: Sahlmann et al. 2013) relying on the positional shift of the star around the center of mass of the orbit (reflex motion). This technique in principle has the advantage that it is insensitive to the inclination of the exoplanet orbit.
Astrometric searches with the requisite sensitivity to detect exoplanets can also be carried out at radio frequencies using very long baseline interferometry (VLBI); see Bower et al. (2009); Forbrich & Berger (2009). In this context, the discovery of radio emission from late-M and L dwarfs (Berger et al., 2001; Berger, 2006) provides a unique opportunity to uncover exoplanets or brown dwarf companions to stars and brown dwarfs with M⊙. Our recent detection of the M8.5 dwarf TVLM 513–46546 (hereafter, TVLM 513) with VLBI (Forbrich & Berger, 2009), motivated us to perform an astrometric search for a sub-stellar companion using long-term VLBI observations. A previous direct imaging search for a companion to TVLM 513 (Close et al., 2003) yielded no detections at separations of , corresponding to about AU at the distance of the source.
In this paper we report the results of our multi-epoch VLBI program, carried out with the NRAO Very Long Baseline Array (VLBA). The observing sequence was designed to sample a range of timescales appropriate for measurements of parallax, proper motion, and any reflex motion from a sub-stellar companion. The observations thus allow us to both significantly improve on the optical measurements of the parallax and proper motion, and to detect a sub-stellar companion over a wide range of orbital separations in the sub-AU range. We summarize the known properties of TVLM 513 in §2, and describe the VLBI observations and analysis in §3. Our measurements of an improved parallax and proper motion are described in §4, and the results of the astrometric companion search are discussed in §5.
2 TVLM 513–46546
| ID BF100 | Date | UT Time | Flux | rms | SNR | RA, Dec |
|---|---|---|---|---|---|---|
| (mJy) | (mJy) | (J2000) | ||||
| A | 18-MAR-2010 | 07:58–13:00 | 0.324 | 0.046 | 7.1 | 15 01 08.159656832 +22 50 01.4994412 |
| B | 26-MAR-2010 | 07:26–12:28 | 0.286 | 0.045 | 6.4 | 15 01 08.158969547 +22 50 01.5058012 |
| C | 05-APR-2010 | 06:46–11:49 | 0.894 | 0.046 | 19.7 | 15 01 08.158010315 +22 50 01.5129404 |
| I | 26-APR-2010 | 04:59–12:00 | 0.274 | 0.033 | 8.4 | 15 01 08.155697329 +22 50 01.5240308 |
| D | 27-MAY-2010 | 03:22–08:25 | 0.349 | 0.052 | 6.8 | 15 01 08.152041141 +22 50 01.5285215 |
| E | 25-JUN-2010 | 01:28–06:31 | 0.162 | 0.054 | (3) | — |
| F | 03-NOV-2010 | 16:49–21:52 | 0.157 | 0.052 | (3) | — |
| G | 08-MAR-2011 | 08:39–13:43 | 0.155 | 0.045 | 3.4 | 15 01 08.1572406121 +22 50 01.4253832 |
| H | 03-AUG-2011 | 22:53–03:57(+1) | 0.163 | 0.054 | (3) | — |
| Parameter | BB251+ABCIDG |
|---|---|
| (mas) | |
| (mas yr-1) | |
| (mas yr-1) | |
| (mas yr-1) | |
| (deg) | |
| (pc) | |
| (km s-1) | |
An optical parallax of TVLM 513, an M8.5 star (Tinney et al., 1993), was first obtained by Tinney et al. (1995) who derive a relative parallax of mas, as well as a relative proper motion of mas toward position angle (East of North). From an estimate of the photometric distances to the reference stars, they derive an absolute parallax of mas. Subsequently, Dahn et al. (2002) improved this result with a similar technique, obtaining mas and a proper motion of mas with a position angle of . Their derived absolute parallax is mas, and the tangential velocity of the star is km s-1.
3 Observations and Calibration
Following our initial detection of TVLM 513 in VLBI observations (Forbrich & Berger, 2009), we observed the source at nine more epochs in 2010 and 2011 using the NRAO Very Long Baseline Array (project BF100 with tracks A-I). At one of these epochs (I), we added the 100-m NRAO Green Bank Telescope (GBT) to increase the sensitivity. Except for epoch I, which had a duration of 7 hours, the observations lasted for 5 hours each. The observing log is listed in Table 1. We used the initial observations to estimate the offset of TVLM 513 (with respect to the background sources), and the optical parallax and proper motion of Dahn et al. (2002) to predict positions for the interferometer correlations for subsequent observations. The observing sequence was designed to provide sensitivity to different masses and orbital periods for a potential sub-stellar companion.
We calibrated the raw interferometer visibility data with the AIPS software package using standard procedures. To improve the astrometric accuracy, we conducted “geodetic block” observations at 8.4 GHz of ICRF sources with well-determined positions (Reid & Brunthaler, 2004). These blocks were placed at the beginning and end of each observing track. For epoch I, which included the Green Bank Telescope, we inserted an additional block near the middle of the track. Ionospheric delays were removed using Global Positioning System total electron content measurements and the data were corrected using the best Earth orientation parameter values. Standard procedures included removing residual delays as clock drifts and zenith atmospheric delays. We removed electronic delays and differences between the IF bands using observations of a strong calibration source, J1800+782. Subsequently, we interpolated the phases for the rapid-switching reference source J1455+2131 (located away from the target) to cover the times of TVLM 513 scans and removed them from the latter.
We imaged the calibrated data with the AIPS task IMAGR, with a typical synthesized beam FWHM of 2.00.8 mas (for ROBUST=0 weighting), elongated in roughly the North-South direction, depending on the scheduling of each epoch. Finally, we estimated the source positions by fitting 2-dimensional Gaussian brightness distributions in the image plane. Maps of TVLM 513 for all epochs, with depictions of the synthesized beam sizes, are shown in Fig. 1. The results of the fits to determine the peak flux density and the source positions are listed in Table 1.
We note that the parallax and proper motion of the source are large enough to cause an apparent movement of up to 0.07 mas hr-1, i.e., 9% of the typical minor axis of the synthesized beam. Thus, the precise times of day of the observations were taken into account.


We detect TVLM 513 with a signal-to-noise ratio (SNR) only in the first five epochs (ABCID), collected within a two month span. Based on a parallax and proper motion fit using epochs BB251 (Forbrich & Berger, 2009) and ABCID, we searched images from the subsequent epochs EFGH for lower-significance detections at the predicted positions. We found that the source was detected in epoch G with . In epoch E, weak emission is seen offset by two beams from the predicted position (see Fig. 1), too far off to be considered a real detection of TVLM 513.
TVLM 513 is clearly variable with the brightest detection in epoch C at almost 0.9 mJy (19.7). Among the first five epochs, TVLM 513 is variable by a factor of 3.4. In fact, the quiescent flux density reported by Osten et al. (2006), at 22811 Jy, is only slightly above our 3 upper limits. The 3.4 detection in epoch G is at 15545 Jy.
4 Parallax and Proper Motion
Combining all detections, we estimate the absolute parallax and proper motion of TVLM 513. The fit results for the parallax and the absolute proper motion are listed in Table 2. Also listed are the multiple correlation coefficients of these parameters which are taken into account in the determination of the parameter errors.
To account for systematic errors, from residual atmospheric phase effects as well as ummodeled motion from an unseen companion, we introduce error floors for the positional uncertainties such that post-fit residuals yielded a reduced in both coordinates. This resulted in error floors of mas, which are considerably larger than the formal positional errors from the Gaussian fits (governed only by SNR), indicating that the total error is dominated by unmodeled effects.
The measured parallax of mas corresponds to a distance of pc. The total absolute proper motion is mas toward a position angle . At the derived distance, the proper motion translates into a tangential velocity of km s-1.
Our determination of the parallax is slightly lower than the parallax determined from optical measurements by Dahn et al. (2002), but the two measurements agree within joint-error. The main advantage of our measurement is that it is directly tied to an absolute reference frame, via phase referencing to the compact extragalactic source J1455+2131.
5 Astrometric Companion Search
The residuals of the parallax and proper motion fit are a measure of the (systematic-dominated) measurement error and any orbital reflex motion caused by potential sub-stellar companions. As shown in Figure 3, the residuals are smaller than 0.5 mas. The average thermal position uncertainty 111The thermal position uncertainty is calculated as a fraction of the synthesized beam size as 0.5 FWHM/SNR, where FWHM is the beam size and SNR is the signal to noise ratio (e.g., Reid et al., 1988). of mas (in the shape of the synthesized beam) is clearly insufficient to explain the residuals, especially in the easterly direction.
Plotted in temporal order, the residuals may indicate an orderly motion. In Figures 3 and 4, the residuals are shown as a function of time and separately for RA and Dec, focusing on the 2010 epochs ABCID and the corresponding fit.
For the companion search, we consider the radii of circular orbits and do not consider inclination since our interest is only in the maximum reflex motion. The reflex motion , a function of the orbital radius , can be expressed as a function of the observationally constrained orbital period using Kepler’s Third Law:
| (1) |
where is the distance, is the companion mass, and is mass of the central object. Assuming a mass of TVLM 513 of 0.08 , we can thus rule out a certain range of single sub-stellar companions, depending on their mass and orbital radius.
The pattern of residuals might be consistent with an orbital period of days and an amplitude of mas which would correspond to a companion mass of 2.5 with an orbital radius of 0.14 AU. However, conservatively, we only use the residuals to bound ranges of companion masses and semi-major axes (or orbital periods).
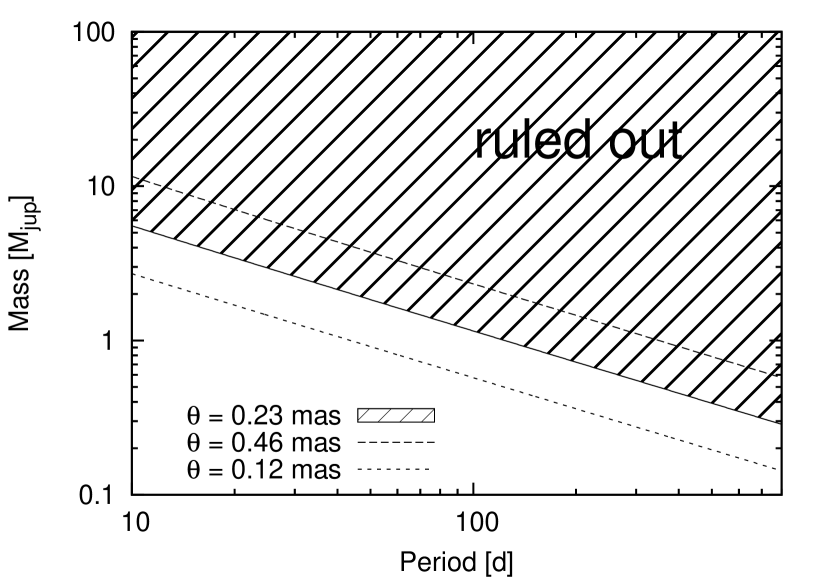
We use a total systematic error of 0.23 mas, as derived above, as an upper limit to any reflex motion caused by an assumed single companion. To make a statement on which mass range of (single) sub-stellar companions can be ruled out by our experiment, we also need to consider the sensitivity for certain time scales, as covered by the observations. Since the A and D observations are separated by 70 days, and since the maximum reflex motion is caused within half the orbital period, this corresponds to a sensitivity to periods of 140 days. Including epoch G, this sensitivity increases to 710 days, but the intervening time is not well sampled. The shortest time scale is set by the 8 days interval between observations A and B, corresponding to an orbital period of 16 days. Our experiment has some sensitivity also to shorter periods since any such companion would still increase the apparent astrometric noise in all epochs.
In Figure 5, we thus show the phase space that we can confidently rule out for single sub-stellar companions orbiting TVLM 513, as calculated from Equation 1. With the time scales covered by epochs ABCID, our upper limit rules out a companion of 0.9 with an orbital period of 140 days and a companion of 3.8 with an orbital period of 16 days. For epochs ABCIDG, the mass sensitivity drops to 0.3 , underlining the power of this method.
Previously, Close et al. (2003) have used near-infrared adaptive-optics imaging to rule out companions at separation of , corresponding to a projected orbital radius of AU. The largest orbital radii that we rule out are a 3.8 companion with an orbital radius of AU or a 0.3 companion with an orbital radius of AU when including epoch G. All of these orbits are smaller than the orbits that could be resolved by direct imaging observations.
6 Conclusions
A multi-epoch phase-referenced VLBI observation of TVLM 513 yields detections in six out of nine epochs. The observations were spaced in different intervals to search for residual reflex motion due to an unseen companion, with sensitivity to a wide range of orbits. A fit of the apparent motion to solve for the parallax and absolute proper motion yields a distance of pc with an accuracy of 0.25%. After accounting for the parallax and proper motion of TVLM 513, any residuals of this fit could be caused by unseen sub-stellar companions. We find a suggestive pattern in the residual motion which is close to the noise limit, and we use these residual as a measurement of the total systematic error, including any reflex motion. In this way, we obtain an upper limit to the reflex motion as a function of orbital period that would be caused by companions with masses higher than Mjup or Mjup with corresponding orbital periods of 16 and 710 days, respectively. The mass sensitivity could be improved to lower-mass companions with continued monitoring of this source even if in the case of TVLM 513, observations have been hampered by variability. More generally, the sensitivity upgrade of the VLBA is now enabling such observations toward a larger number of sources.
References
- Berger (2002) Berger, E. 2002, ApJ, 572, 503
- Berger (2006) —. 2006, ApJ, 648, 629
- Berger et al. (2001) Berger, E., et al. 2001, Nature, 410, 338
- Berger et al. (2008) —. 2008, ApJ, 673, 1080
- Bond et al. (2004) Bond, I. A., et al. 2004, ApJ, 606, L155
- Bower et al. (2009) Bower, G. C., Bolatto, A., Ford, E. B., & Kalas, P. 2009, ApJ, 701, 1922
- Charbonneau et al. (2000) Charbonneau, D., Brown, T. M., Latham, D. W., & Mayor, M. 2000, ApJ, 529, L45
- Charbonneau et al. (2009) Charbonneau, D., et al. 2009, Nature, 462, 891
- Close et al. (2003) Close, L. M., Siegler, N., Freed, M., & Biller, B. 2003, ApJ, 587, 407
- Dahn et al. (2002) Dahn, C. C., et al. 2002, AJ, 124, 1170
- Doyle et al. (2010) Doyle, J. G., Antonova, A., Marsh, M. S., Hallinan, G., Yu, S., & Golden, A. 2010, A&A, 524, A15
- Forbrich & Berger (2009) Forbrich, J., & Berger, E. 2009, ApJ, 706, L205
- Hallinan et al. (2006) Hallinan, G., Antonova, A., Doyle, J. G., Bourke, S., Brisken, W. F., & Golden, A. 2006, ApJ, 653, 690
- Hallinan et al. (2007) Hallinan, G., et al. 2007, ApJ, 663, L25
- Kalas et al. (2008) Kalas, P., et al. 2008, Science, 322, 1345
- Kubas et al. (2012) Kubas, D., et al. 2012, A&A, 540, A78
- Mayor & Queloz (1995) Mayor, M., & Queloz, D. 1995, Nature, 378, 355
- Muirhead et al. (2012) Muirhead, P. S., et al. 2012, ApJ, 747, 144
- Osten et al. (2006) Osten, R. A., Hawley, S. L., Bastian, T. S., & Reid, I. N. 2006, ApJ, 637, 518
- Pravdo et al. (2005) Pravdo, S. H., Shaklan, S. B., & Lloyd, J. 2005, ApJ, 630, 528
- Reid & Brunthaler (2004) Reid, M. J., & Brunthaler, A. 2004, ApJ, 616, 872
- Reid et al. (1988) Reid, M. J., Schneps, M. H., Moran, J. M., Gwinn, C. R., Genzel, R., Downes, D., & Roennaeng, B. 1988, ApJ, 330, 809
- Sahlmann et al. (2013) Sahlmann, J., Lazorenko, P. F., Segransan, D., Martin, E. L., Queloz, D., Mayor, M., & Udry, S. 2013, A&A in press
- Tinney et al. (1993) Tinney, C. G., Mould, J. R., & Reid, I. N. 1993, AJ, 105, 1045
- Tinney et al. (1995) Tinney, C. G., Reid, I. N., Gizis, J., & Mould, J. R. 1995, AJ, 110, 3014
- Wolszczan & Frail (1992) Wolszczan, A., & Frail, D. A. 1992, Nature, 355, 145