Keck-I MOSFIRE spectroscopy of the candidate galaxy UDFj-39546284 ⋆
Abstract
We report the results of deep (4.6h) H band spectroscopy of the well studied H-band dropout galaxy candidate UDFj-39546284 with MOSFIRE on Keck-I. These data reach a sensitivity of per 4.4Å resolution element between sky lines. Previous papers have argued this source could either be a large equivalent width line emitting galaxy at or a luminous galaxy at . We find a peak associated with a line candidate in deep Hubble-Space-Telescope Wide-Field-Camera 3 Infrared grism observations, but at a lower flux than what was expected. After considering several possibilities we conclude these data can not conclusively confirm or reject the previous line detection, and significantly deeper spectroscopic observations are required. We also search for low-redshift emission lines in ten other , , and -dropout candidates in our mask and find no significant detections.
Subject headings:
galaxies: high-redshift – galaxies: formation – line: identification1. Introduction
Deep photometric surveys with the Hubble Space Telescope (HST) are revolutionizing our knowledge of the star forming galaxy population at the epoch of hydrogen re-ionization, only a few hundred million years after the Big Bang. Hundreds of candidate galaxies have now been discovered using the Lyman break galaxy (LBG or ’dropout’) technique using newly available HST Wide-Field-Camera-3-Infrared (WFC3-IR) data (Bouwens et al., 2010; Oesch et al., 2010; McLure et al., 2013; Ellis et al., 2013). Recently, this technique has been pushed to by using hundreds of HST orbits to probe to unprecedented depths in the Hubble-Ultra-Deep-Field 2012 (HUDF12) (Ellis et al., 2013).
The LBG or ’dropout’ technique relies on absorption by intervening neutral hydrogen below the Lyman limit at 912Å and Ly at 1216Å to create a strong spectral break that differentiates high and low redshift galaxies using only broad-band photometry. This technique was first introduced in the 1980’s and 1990’s (Cowie, 1988; Steidel et al., 1996) and broadly adopted as the main technique for finding candidate distant sources once it was shown to be effective spectroscopically on large samples at (Steidel et al., 1999, 2002) and then deployed at ever higher redshifts (Iwata et al., 2003; Ouchi et al., 2004; Bouwens et al., 2007). The current frontier is to use the near-infrared Wide Field Camera 3 (WFC3/IR) Hubble Ultra Deep Field data for ’J and H -dropout’ galaxies at redshifts and has led to a handful of tentative detections, most noticeably the source UDFj-39546284, a candidate galaxy (Ellis et al., 2013) previously claimed to be at (Bouwens et al., 2011a; Oesch et al., 2012). If confirmed to be at such high redshifts, even this single galaxy would be of paramount importance to probe the physics of the earliest phases of galaxy formation, and to quantify how star forming galaxies contribute to the re-ionization of the Universe (Robertson et al., 2010; Bouwens et al., 2011a; Oesch et al., 2012).
However, spectroscopic redshifts are fundamental to ascertain the true redshifts of candidate high- LBGs. At application of the dropout technique has lead to notably diverse results (Iwata et al., 2003; Ouchi et al., 2004; Bouwens et al., 2007; van der Burg et al., 2010) with only limited samples being spectroscopically confirmed (Vanzella et al., 2009; Stark et al., 2010; Mallery et al., 2012), and the vast majority of spectroscopy failing to detect anything significant. For example, Stark et al. (2010) and Vanzella et al. (2009), two of the largest spectroscopic samples at to date, confirm less than half of their targeted objects. This is particularly problematic at where exotic objects can contaminate the dropout selection (Capak et al., 2011).
A growing body of evidence suggests extreme line emitters and unusual evolved galaxies at are a contaminant in LBG selections (Atek et al., 2011; Capak et al., 2011; Hayes et al., 2012). In published spectroscopic studies of galaxies the vast majority of results are null, with a large fraction of detected objects placed at (Vanzella et al., 2011; Capak et al., 2011; Caruana et al., 2012; Hayes et al., 2012; Ono et al., 2012; Caruana et al., 2012; Bunker et al., 2013). The null results, combined with the type of contamination is worrying because it is from a poorly understood population of objects and so is difficult to include in the simulations required to quantify LBG selection criteria (Capak et al., 2011). In the near term this highlights the need for deep spectroscopic studies at where current spectrographs can hope to confirm existing high-z candidates and characterize contaminating populations. In the longer run the James Web Space Telescope (JWST) and Thirty-meter class ground based telescopes will be necessary to obtain the requisite spectroscopic samples at and faint fluxes needed to understand these populations.
UDFj-39546284 has been well studied by many authors and is only detected in the F160W H band filter with HST WFC3-IR, even though the deepest currently possible data exists at both bluer and redder wavelengths. It was first reported by Bouwens et al. (2011a) who originally claimed it was at . Ellis et al. (2013) recently improved the depth of the HUDF F160W and the F105W images by 0.2 and 0.5 magnitudes respectively and added deep F140W imaging which overlaps the blue half of F160W. This new data (HUDF12) favors UDFj-39546284 being at , but still allows the possibility it could be a strong line emitter at . Subsequently, Brammer et al. (2013) reported a line detection at with a flux of based on 40,500 seconds of HST WFC3-IR grism spectroscopy. However this detection required significant modeling of the data to remove overlapping spectra and background artifacts. Subsequent re-analysis of the deeper imaging and spectroscopic data by Bouwens et al. (2013) now lead them to the conclusion that the galaxy is more likely at than based on the argument that the galaxy would be unusually luminous if actually at .
If UDFj-39546284 is at low redshift, the photometric constraints indicate it must be a young blue galaxy with strong line emission that has a line flux of for a typical dwarf galaxy velocity dispersion (Ellis et al., 2013; Brammer et al., 2013; Bouwens et al., 2013). Furthermore, the line reported by Brammer et al. (2013) falls in a region largely free of sky lines and so can be confirmed by ground based spectroscopy which has significantly higher sensitivity and spectral resolution.
In this paper we present R -band spectroscopy of UDFj-39546284 with the MOSFIRE multi-object infrared spectrograph (McLean et al., 2010, 2012) on the Keck-I telescope, reaching the sensitivity of the WFC3 grism spectroscopy between sky lines. This new instrument saw its first-light in April 2012, and provides a substantial boost in sensitivity relative to previous facilities for studies of very faint distant galaxies. Its high-multiplexing of up to 46 adjustable slitlets over a field of view of enables the simultaneous acquisition of scores of individual sources. In addition to UDFj-39546284 we give a summary of the results from other objects on our slit mask in Table 1.
We adopt a cosmological model with , , and and magnitudes in the AB system.
2. Data
Data were collected on the nights of Jan 15 &16, 2013 using the MOSFIRE instrument on the Keck-I telescope. Conditions were photometric on both nights, with a median seeing of 1.2′′ . The instrument was configured with the H band grating, slit widths, 180s exposures, and 16 Multiple Correlated Double Samples (MCDS). The telescope was nodded by ′′ between observations with 44 exposures taken on Jan 15, and 48 on Jan 16, yielding a total exposure time of 4.6h on the mask.
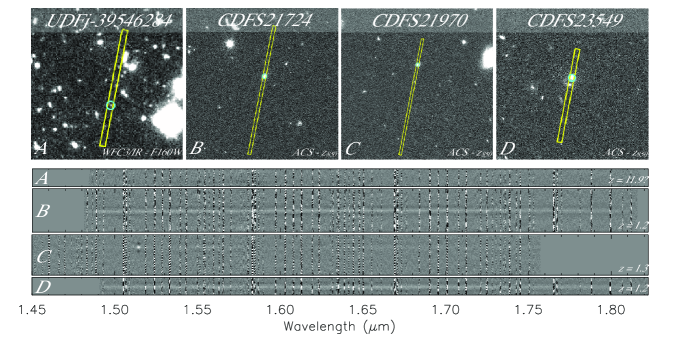
We used bright 2MASS stars for alignment, but noted a significant offset between the 2MASS and HUDF12 astrometry which was corrected before generating the mask. We verified the alignment stars and galaxies in the HUDF12 were on the same astrometric system by comparing the astrometry of the alignment stars and galaxies on the HUDF12 images and the surrounding HST-ACS images which covered a wider area. Based on repeated alignment exposures taken every 1-2 hours during both nights the mask was aligned to better than 0.1′′ during the observations. Finally, to verify the mask was properly aligned, relatively bright objects were placed on slits around the mask and their flux checked against the expectations from photometry (See Figure 1).
The data were reduced using the MOSFIRE python reduction package which subtracts nodded pairs of images, then shifts and co-adds the exposures using a sigma-clipped noise weighted mean. The Argon and Neon arc lamps along with sky lines were used for wavelength calibration. We generated a combined image of all 92 (4.6h) exposures as well as combinations including only 3/4 of the data (3.45h) to test the robustness of the reductions, noise estimates, and for temporal variations .
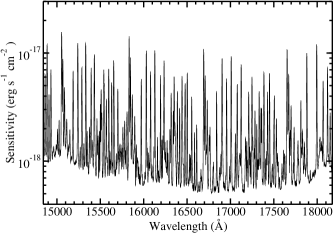
Flux calibration was accomplished by taking spectra of the white dwarf spectrophotometric standard star GD71. The standard star was observed with a pair of exposures using identical setting to the science observations and reduced in the same way as the science data. The well detected spectra of the compact, 0.36′′ FWHM in the HST F160W images, galaxy CDFS21724 was used to verify our spectrophotometric calibration, slit loss, and noise estimates by comparing this spectra to the ISAAC H band flux from the MUSYC catalog (Cardamone et al., 2010), the GOODS-S Early Release Science (ERS) F160W flux, and the noise estimates from the MOSFIRE exposure time calculator. Based on the CDFS21724 spectra additional slit losses due to object extent and mask mis-alignment are estimated to be greater than estimated for the standard star. The noise measured in CDFS21724 between 15920-15950Å is per 4.4Å resolution element consistent with the estimate of from the exposure time calculator once the slit losses of due to poor seeing, and due to object extension and mask alignment are taken into account. Two other bright objects CDFS21970 and CDFS23549 were also placed on the mask to verify the throughput and resulted in the expected signal-to-noise, but were not used for quantitative analysis because of a strong emission line (CDFS21970) and complex morphology (CDFS23549) which made a comparison to UDFj-39546284 more difficult. The estimated sensitivity per resolution element is plotted in Figure 2 and results for the alignment galaxies and high-z spectra are given in Table 1.
| ID | RA | DEC | Comments | |
|---|---|---|---|---|
| CDFS21724b | 20.49 | low-z, Continuum SNR | ||
| CDFS21970b | 21.04 | low-z, Continuum SNR, strong Hα line | ||
| CDFS23549b | 20.41 | low-z, Continuum SNR | ||
| UDFj-39546284a | 29.3 | J drop, no detection | ||
| UDF12-4106-7304a | 29.7 | J drop, no detection | ||
| UDF12-3947-8076a | 29.0 | J drop, no detection | ||
| UDFj-43696407a | 29.5 | J drop, no detection | ||
| UDFj-35427336a | 29.6 | J drop, no detection | ||
| UDFy-33436598a | 29.4 | Y drop, no detection | ||
| UDF12-3858-6150c | 29.9 | Y drop, no detection | ||
| UDF12-3939-7040c | 28.9 | Y drop, no detection | ||
| UDF12-4057-6436c | 28.7 | z drop, no detection | ||
| UDF12-3817-7327c | 30.3 | z drop, no detection | ||
| UDF12-3853-7519c | 29.7 | z drop, no detection |
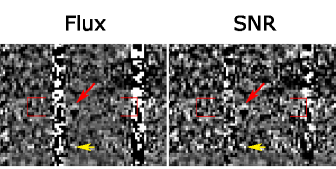
To find potential emission lines we used SExtractor to automatically search for groups of 9 pixels above with no smoothing yielding a net detection, as well as visually inspecting the spectra at the expected position of UDFj-39546284. We find no robust line detections, but do find a peak at with a flux of in a 6-pixel diameter aperture (Figure 3), consistent at the1.5 level with the wavelength and flux reported in Brammer et al. (2013). We also measured the line flux using an optimal extraction assuming a 1.2′′ gaussian FWHM and found the same result. This corresponds to of the measured broad band flux, and would correspond to an observed frame equivalent width of Å.
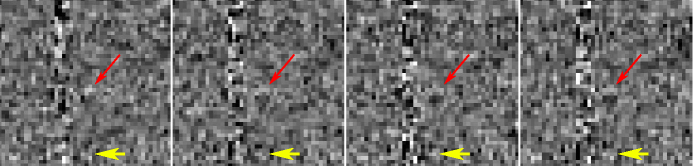
The peak is present in all of the reductions which include only 3/4 of the data (at reduced significance, see Figure 4) and measurement of the flux at the positions of the expected negative images due to the dithering return a consistent negative flux, increasing the reliability of the detection. No known detector artifacts fall on this part of the detector, and no decaying latent images from alignment or previous observations are visible in the early frames of each observation or in the un-dithered stack of the data. A negative ”spot” corresponding to a region of known bad pixels at one dither position is observed just below the line. The bad pixels have been masked, but as a result the data at this position only comes from one dither position. This negative spot is likely a sky-subtraction artifact due to a corresponding positive spot visible at the other dither position where the sky was determined. This is not an astrophysical object because the expected dual negative, single positive pattern is not observed. Furthermore, this region varies in intensity in the 3/4 reductions, indicating it is either a noise fluctuation, or a transient effect in the detector. The region does not produce the adjacent positive detection observed for UDFj-39546284 in other masks taken on the same nights.
Despite the positive evidence, this detection should be considered tenuous because 291 other peaks are found between sky lines, 37 of which occur in the full stack and all four 3/4 time stacks, and 4 of which have two negative detections at the two expected dither positions. This places the probability of a chance co-incidence between a noise peak and the reported WFC3 grism observations at between and depending on wether we assume there are 4 or 291 peaks. In addition the peak is near a sky line increasing the chance of residuals.
Besides UDFj-39546284, we observed 4 J dropout, 3 Y dropout, and 3 z dropout galaxies taken from Ellis et al. (2013) and Schenker et al. (2013) with details noted in Table 1. The goal of including these sources was to search for strong emission lines if the sources were actually at since all are expected to have Ly- blue ward of our spectroscopic range. We find no lines at a sensitivity within 10% of that indicated in Figure 2 placing useful limits for future spectroscopic observations seeking Ly- in the Y and J bands.
3. Discussion
Considering the possibility that UDFj-39546284 is a galaxy, the HST observations imply a line flux of . If we combine our 2.2 flux measurement with the 2.7 result of Brammer et al. (2013) it results in a detection at with a flux of , at the lower-end of what is required to explain the photometry. If we take this combined result at face value along with the photometric analysis of Bouwens et al. (2013) it indicates UDFj-39546284 is likely at , and we are seeing the [O III] 5007Å line. But, at the low significance of our data and that of Brammer et al. (2013) confirmation bias due to co-incident noise peaks is problematic and significant unknown systematic effects could be present in both reductions. Furthermore, for typical [O III]/H line ratios of in strong line emitting galaxies (Kakazu et al., 2007) one would expect a detection in F140W filter imaging if this source were at and this is not observed. In contrast to Brammer et al. (2013) we find even the extreme object they find with a [O III]/H line ratio of should also result in a detection assuming the Ellis et al. (2013) photometric limits. The discrepancy is due either to differences in the depths quoted between Brammer et al. (2013) and Ellis et al. (2013) which differ by magnitudes and/or to how the extreme object photometry and spectra were compared to the UDFj-39546284 limits. In particular, we note the spectral energy distribution shown in Brammer et al. (2013) is not directly comparable to the plotted UDFj-39546284 limits because the filters in the two observations have significantly different bandwidths and the spectral energy distribution is dominated by lines which create significant non-linear flux changes as they redshift through the filter bandpasses. An alternative low redshift explanation is that we are detecting one of the [O II] 3727Å doublet lines at , however this is less likely since the [O II] line is typically significantly weaker than the [O III] 5007Å line. So more data are required before coming to any firm conclusions.
We estimate of integration in good conditions with Keck-I-MOSFIRE or an equivalent instrument would confirm the tentative detection at 15985.5Å at , but still be insufficient to detect other lines for typical [O III]/H line ratios in high-equivalent width line emitting galaxies (Kakazu et al., 2007). If the preliminary detection is the strong [O III] 5006.8Å line at the 4958.9Å line would be behind a bright sky line and H would be too faint to detect. If instead we are seeing the less likely 3727Å [O II] doublet at the second line of the doublet would be hidden behind the nearby sky line.
One could also integrate for a similar amount of time in the band, and attempt to detect the H line if the source is at or both of the [O III] lines if the source is at . Assuming our preliminary detection is real, all three of these lines fall between sky lines and should be detectable at for typical line ratios. This may be a more productive approach since it can differentiate between , 3.29, and 12.14.
Spectroscopic confirmation with ALMA would be expensive. Assuming this source is at , is un-obscured, and all of the continuum flux is due to star formation, the expected C II 158m luminosity would be Jy assuming 1% of the bolometric luminosity is emerging in this line. With full ALMA this would require hours of integration in one receiver tuning to detect at . However, a non-detection would not confirm a low-redshift because of the intrinsic scatter in bolometric luminosity to C II line ratio.
If UDFj-39546284 is at high redshift we expect no detection in the longer spectra and it is unlikely that any conclusive spectra can be obtained with current instrumentation. The typical equivalent width of Ly in galaxies is with a tail out to and is expected to decrease at due to the increasing opacity of the inter-galactic medium (IGM) (Stark et al., 2011; Mallery et al., 2012). Assuming UDFj-39546284 is at , our flux limit would require a Ly- equivalent width of to yield a detection. This large an equivalent width is occasionally observed in the universe, but less likely at where the inter-galactic medium is expected to be more absorptive. For a normal equivalent width of , h of observation with Keck-I-MOSFIRE would be required to detect this galaxy, and even an adaptive optics assisted thirty-meter class telescope would require h of integration.
4. Conclusions
Using the Keck-I MOSFIRE infrared spectrograph we recover the line detection reported in Brammer et al. (2013) at the level. Combining these results we find 3.5 line a with an estimated flux of , but the likelihood that this is a chance coincidence of noise peaks is non-negligible, so further observations are needed. If confirmed, the detection indicates UDFj-39546284 is actually a low redshift line emitter at or 3.29, so both and band spectra should be obtained to uniquely determine its redshift. If the source is at it is unlikely ground based 8-10m telescopes or ALMA could confirm it and additional data will yield a non-detection. The difficulty in interpreting this source, and the high likelihood that it is actually at low-redshift highlights the need for spectroscopic studies at to understand possible sources of contamination at even higher redshifts.
References
- Atek et al. (2011) Atek, H., Siana, B., Scarlata, C., et al. 2011, ApJ, 743, 121
- Bouwens et al. (2007) Bouwens, R. J., Illingworth, G. D., Franx, M., & Ford, H. 2007, ApJ, 670, 928
- Bouwens et al. (2010) Bouwens, R. J., Illingworth, G. D., Oesch, P. A., et al. 2010, ApJ, 709, L133
- Bouwens et al. (2011a) Bouwens, R. J., Illingworth, G. D., Labbe, I., et al. 2011a, Nature, 469, 504
- Bouwens et al. (2011b) Bouwens, R. J., Illingworth, G. D., Oesch, P. A., et al. 2011b, ApJ, 737, 90
- Bouwens et al. (2013) Bouwens, R. J., Oesch, P. A., Illingworth, G. D., et al. 2013, ApJ, 765, L16
- Brammer et al. (2013) Brammer, G. B., van Dokkum, P. G., Illingworth, G. D., et al. 2013, ApJ, 765, L2
- Bunker et al. (2013) Bunker, A. J., Caruana, J., Wilkins, S. M., et al. 2013, MNRAS, 430, 3314
- Capak et al. (2011) Capak, P., Mobasher, B., Scoville, N. Z., et al. 2011, ApJ, 730, 68
- Cardamone et al. (2010) Cardamone, C. N., van Dokkum, P. G., Urry, C. M., et al. 2010, ApJS, 189, 270
- Caruana et al. (2012) Caruana, J., Bunker, A. J., Wilkins, S. M., et al. 2012, MNRAS, 427, 3055
- Cowie (1988) Cowie, L. L. 1988, in Post-Recombination Universe, ed. N. Kaiser & A. N. Lasenby, 1–18
- Ellis et al. (2013) Ellis, R. S., McLure, R. J., Dunlop, J. S., et al. 2013, ApJ, 763, L7
- Hayes et al. (2012) Hayes, M., Laporte, N., Pelló, R., Schaerer, D., & Le Borgne, J.-F. 2012, MNRAS, 425, L19
- Iwata et al. (2003) Iwata, I., Ohta, K., Tamura, N., et al. 2003, PASJ, 55, 415
- Kakazu et al. (2007) Kakazu, Y., Cowie, L. L., & Hu, E. M. 2007, ApJ, 668, 853
- Mallery et al. (2012) Mallery, R. P., Mobasher, B., Capak, P., et al. 2012, ApJ, 760, 128
- McLean et al. (2010) McLean, I. S., Steidel, C. C., Epps, H., et al. 2010, in Society of Photo-Optical Instrumentation Engineers (SPIE) Conference Series, Vol. 7735, Society of Photo-Optical Instrumentation Engineers (SPIE) Conference Series
- McLean et al. (2012) McLean, I. S., Steidel, C. C., Epps, H. W., et al. 2012, in Society of Photo-Optical Instrumentation Engineers (SPIE) Conference Series, Vol. 8446, Society of Photo-Optical Instrumentation Engineers (SPIE) Conference Series
- McLure et al. (2013) McLure, R. J., Dunlop, J. S., Bowler, R. A. A., et al. 2013, MNRAS, arXiv:1212.5222
- Oesch et al. (2010) Oesch, P. A., Bouwens, R. J., Carollo, C. M., et al. 2010, ApJ, 709, L21
- Oesch et al. (2012) Oesch, P. A., Bouwens, R. J., Illingworth, G. D., et al. 2012, ApJ, 745, 110
- Ono et al. (2012) Ono, Y., Ouchi, M., Mobasher, B., et al. 2012, ApJ, 744, 83
- Ouchi et al. (2004) Ouchi, M., Shimasaku, K., Okamura, S., et al. 2004, ApJ, 611, 660
- Robertson et al. (2010) Robertson, B. E., Ellis, R. S., Dunlop, J. S., McLure, R. J., & Stark, D. P. 2010, Nature, 468, 49
- Schenker et al. (2013) Schenker, M. A., Robertson, B. E., Ellis, R. S., et al. 2013, ApJ, 768, 196
- Stark et al. (2010) Stark, D. P., Ellis, R. S., Chiu, K., Ouchi, M., & Bunker, A. 2010, MNRAS, 408, 1628
- Stark et al. (2011) Stark, D. P., Ellis, R. S., & Ouchi, M. 2011, ApJ, 728, L2
- Steidel et al. (1999) Steidel, C. C., Adelberger, K. L., Giavalisco, M., Dickinson, M., & Pettini, M. 1999, ApJ, 519, 1
- Steidel et al. (1996) Steidel, C. C., Giavalisco, M., Pettini, M., Dickinson, M., & Adelberger, K. L. 1996, ApJ, 462, L17
- Steidel et al. (2002) Steidel, C. C., Hunt, M. P., Shapley, A. E., et al. 2002, ApJ, 576, 653
- van der Burg et al. (2010) van der Burg, R. F. J., Hildebrandt, H., & Erben, T. 2010, A&A, 523, A74
- Vanzella et al. (2009) Vanzella, E., Giavalisco, M., Dickinson, M., et al. 2009, ApJ, 695, 1163
- Vanzella et al. (2011) Vanzella, E., Pentericci, L., Fontana, A., et al. 2011, ApJ, 730, L35